
0 ITEMS

Electronics Marketplace Financial Model Excel Template
The Online Marketplace Financial Model Template helps entrepreneurs, founders, consultants, analysts, and business owners build a structured forecast for a two-sided marketplace business. Instead of relying on a generic spreadsheet, the model is designed around the economics that matter for an online marketplace, including gross merchandise value, take rates, buyer and seller activity, subscriptions, promoted listings, payment processing, platform costs, payroll, and operating expenses. It gives users a practical way to translate marketplace assumptions into revenue projections, cash flow expectations, profitability targets, and funding needs. This template is especially useful for anyone preparing a business plan, investor deck, loan application, internal budget, or strategic growth plan for a marketplace platform. Users can adjust revenue assumptions, startup costs, operating expenses, staffing plans, and growth expectations to reflect their specific marketplace concept, whether it focuses on products, services, creators, local vendors, B2B transactions, or niche communities. The model helps show how transaction volume, average order value, commission rate, seller subscriptions, marketing spend, and customer acquisition costs affect overall financial performance. Built for financial planning and decision-making, the template supports up to five years of projections and helps users review profitability, break-even timing, cash requirements, and return potential. It connects assumptions with outputs so users can see the impact of changing take rates, scaling buyer and seller acquisition, increasing order frequency, adding premium seller services, or controlling fixed costs. This makes it easier to identify risks, compare strategic options, and understand whether the marketplace can become financially sustainable. The Online Marketplace Financial Model is fully editable and ready to use in Microsoft Excel and Google Sheets, making it suitable for both non-financial founders and experienced finance professionals. It saves time by providing a pre-built structure while still allowing complete customization. With organized inputs, automated calculations, professional reports, dashboard views, and investor-oriented outputs, it helps users present a clearer financial story to partners, lenders, investors, advisors, and internal teams.
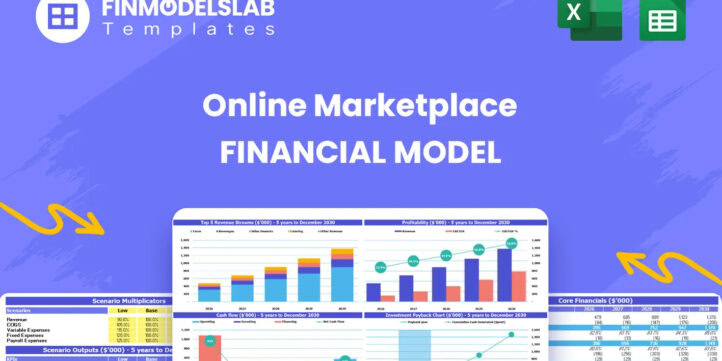


Financial Model Overview
The Online Marketplace Financial Model Financial Model Template gives users a structured and editable way to plan, forecast, and evaluate a digital marketplace business. An online marketplace depends on more than simple sales revenue, because performance is driven by buyers, sellers, listings, transaction volume, gross merchandise value, commission rates, subscription tiers, seller services, payment fees, marketing spend, platform costs, and retention. This template brings those drivers together in one financial planning tool so founders, entrepreneurs, consultants, analysts, and business owners can move from assumptions to usable financial projections. It is designed for business planning, funding preparation, budgeting, investor discussions, lender presentations, and internal decision-making. By organizing the key financial mechanics of a marketplace, the model helps users estimate startup investment, forecast revenue streams, plan operating expenses, assess cash flow, evaluate profitability, and understand the path toward scale. Because the template is fully customizable, users can adapt the assumptions to a niche product marketplace, service marketplace, local seller platform, B2B marketplace, creator platform, or any other two-sided marketplace concept.
All-in-One Dashboard
The all-in-one dashboard brings the core inputs and core outputs of the Online Marketplace Financial Model into a single management view. This component is useful because marketplace businesses involve many connected assumptions, and decision-makers need a quick way to see how user activity, revenue, expenses, cash flow, and profitability interact. The dashboard may include input areas for key operating drivers such as buyer growth, seller growth, gross merchandise value, take rate, subscription pricing, advertising or promoted listing fees, payment processing costs, payroll, and overhead. It then translates those inputs into outputs such as revenue, EBITDA, net income, cash balance, margin performance, and funding needs. For planning purposes, the dashboard helps users avoid jumping between disconnected tabs and instead provides an immediate snapshot of the business model. For investor or stakeholder discussions, it gives a clean summary of how the marketplace is expected to perform under the selected assumptions. It is especially valuable for founders who want to test strategic decisions quickly, such as raising the commission rate, increasing seller subscription adoption, accelerating marketing spend, or delaying hiring until revenue reaches a stronger level.
Low, Base, and High Scenario Analysis
The low, base, and high scenario analysis component allows users to compare three different versions of the marketplace forecast without rebuilding the model from scratch. This is important because online marketplace outcomes can vary significantly depending on acquisition efficiency, buyer retention, seller supply, order frequency, average order value, take rate, and the timing of monetization features. The low case can be used to model slower growth, higher customer acquisition costs, weaker seller conversion, or delayed adoption of premium services. The base case can represent the expected operating plan, using realistic assumptions for marketplace development, transaction volume, subscription revenue, and operating costs. The high case can show what happens if the platform scales faster, improves retention, increases gross merchandise value, or expands higher-margin revenue streams. Outputs may include scenario-based revenue, expenses, EBITDA, cash flow, funding requirements, and profitability timing. This component helps users prepare for uncertainty, communicate risk more clearly, and make better decisions before committing capital. It is also useful for investors, lenders, and advisors because it shows that the business plan has been pressure-tested rather than built around a single optimistic forecast.
Professional Charts
The professional charts component turns forecast data into visual reports that are easier to interpret and present. Online marketplace financial models can contain many detailed calculations, but founders and stakeholders often need a clear visual explanation of the story behind the numbers. This section may display charts for revenue growth, gross merchandise value, cash balance, EBITDA, operating expenses, net income, break-even timing, marketing spend, and major cost categories. It can also help visualize the relationship between marketplace activity and financial outcomes, such as how rising transaction volume affects commission revenue or how fixed costs become more efficient as the platform scales. These charts are useful for business plans, investor decks, board updates, lender conversations, and internal strategy meetings. Instead of manually creating visuals after completing the forecast, users can rely on pre-built chart structures that update when assumptions are changed. This saves time and reduces the risk of inconsistent presentation materials. For decision-making, the visual format makes trends and pressure points easier to identify, allowing users to quickly see whether revenue growth is outpacing costs, whether cash burn is manageable, and whether the business is moving toward sustainable profitability.
ROE Components and DuPont Analysis
The ROE components and DuPont analysis section helps users evaluate return on equity by breaking overall performance into the underlying drivers of profitability, efficiency, and leverage. For an online marketplace, this is useful because investors want to understand not only whether the business can grow, but also whether it can produce attractive returns on the capital invested. This component may analyze net profit margin, asset turnover, equity multiplier, and other factors that contribute to return on equity. It can also connect marketplace-specific assumptions, such as transaction volume, commission revenue, subscription revenue, operating margins, and capital requirements, with broader investor metrics. By showing the components of ROE, the model helps users identify whether return improvement is coming from stronger margins, more efficient use of assets, better cost control, or higher scale. This is valuable for funding preparation because it gives founders and analysts a more sophisticated way to explain capital efficiency and long-term performance. It can also support internal decision-making by showing whether additional investment in platform development, marketing, hiring, or seller services is likely to improve or dilute returns over time.
Revenue Inputs
The revenue inputs component is where users define the commercial assumptions that drive the Online Marketplace Financial Model. A marketplace may earn revenue through commissions on transactions, subscription fees, premium seller plans, buyer memberships, promoted listings, advertising placements, fulfillment-related services, lead generation, or other value-added services. This section helps users enter assumptions for gross merchandise value, average order value, order frequency, buyer growth, seller growth, take rate, subscription pricing, seller conversion into paid plans, and adoption of promotional features. Because marketplace revenue depends on activity across both sides of the platform, the revenue input area is critical for building a forecast that reflects real operating dynamics. The outputs generated from these assumptions may include monthly and annual revenue projections, revenue by stream, effective take rate, GMV growth, and monetization trends. This component is useful for financial planning because it forces users to connect pricing and monetization strategy with user behavior. It also helps decision-makers test whether the marketplace can generate enough revenue to cover payment fees, marketing costs, payroll, technology spending, and overhead while still leaving room for profitable growth.
Bank-Ready Reports
The bank-ready reports component organizes the financial outputs into a format suitable for lenders, funding applications, advisors, and professional stakeholders. Marketplace founders often need to explain how much capital is required, how the funds will be used, when the business expects to generate positive cash flow, and whether the company can support repayment or future financing needs. This section may include projected income statements, cash flow statements, balance sheet summaries, loan or funding assumptions, debt service views, profitability metrics, and cash position forecasts. The value of this component is that it presents the model’s calculations in a structured and credible format rather than leaving users with raw spreadsheet data. It helps users communicate financial feasibility, operating discipline, and the expected path from launch costs to revenue generation. For lenders, the reports can provide a clearer view of repayment capacity, working capital needs, and financial risk. For founders and consultants, the reports save time when preparing a business plan or financing package. They also help ensure that major areas such as startup costs, operating expenses, payroll, revenue growth, cash flow, and profitability are addressed in a consistent financial story.
Revenue Breakdown
The revenue breakdown component provides a detailed view of how each revenue stream contributes to total marketplace income. This is especially important for online marketplaces because relying on one source of revenue can create risk, while adding multiple monetization layers can improve margin and resilience. The section may separate commission revenue from gross merchandise value, seller subscription revenue, buyer membership revenue, promoted listing income, seller advertising fees, premium service fees, and other platform monetization sources. Inputs may include pricing levels, adoption rates, transaction volumes, take rates, and timing of new revenue streams. Outputs may show monthly and annual revenue by category, percentage contribution by stream, average revenue per seller, average revenue per buyer, and changes in revenue mix over time. This component helps users understand which revenue streams are doing the most work and which require further development. It is also useful for investor presentations because it shows how the marketplace can expand beyond basic commissions into higher-margin services. For budgeting and strategy, the revenue breakdown helps founders decide where to focus product development, sales efforts, seller education, and promotional campaigns.
KPI Dashboard
The KPI dashboard component tracks the performance metrics that matter most for an online marketplace and helps compare the plan against benchmarks or internal targets. A marketplace business must monitor both financial and operating indicators because revenue growth depends on activity, liquidity, retention, and monetization. This section may include key metrics such as gross merchandise value, number of buyers, number of sellers, active listings, order volume, average order value, take rate, customer acquisition cost, seller acquisition cost, conversion rates, retention, churn, revenue per user, contribution margin, burn rate, runway, EBITDA margin, and cash balance. The outputs help users see whether the marketplace is becoming more efficient as it grows or whether acquisition costs, payment fees, payroll, or overhead are putting pressure on profitability. This component is useful for internal decision-making because it highlights the operational levers behind the financial forecast. It also helps users build credibility with investors by showing that assumptions are tied to measurable marketplace economics. By using the KPI dashboard, founders and analysts can monitor whether growth targets are realistic, identify weak points early, and adjust strategy before small performance gaps become major financial problems.
Startup Costs and Funding Requirements
The startup costs and funding requirements component helps users estimate the initial investment needed to launch or expand an online marketplace. Marketplace businesses often require meaningful upfront spending before revenue reaches scale, especially for platform development, user experience design, payment integration, security, legal setup, branding, launch marketing, initial hiring, software subscriptions, equipment, and working capital. This section may allow users to enter one-time setup costs, capital expenditures, pre-launch expenses, deposits, professional fees, and cash reserves needed to cover early operating losses. The outputs may include total startup investment, funding required before launch, use of funds, initial cash position, and the amount of capital needed to support the business until it reaches break-even or positive cash flow. This component is useful for business planning because underestimating startup costs can create cash shortages during the most vulnerable stage of the company. It is also valuable for investor and lender discussions because it provides a clear explanation of how much money is needed and why. By linking startup investment with the broader forecast, users can see whether the funding plan is sufficient to support hiring, marketing, platform operations, and growth milestones.
Break-Even and Cash Flow Planning
The break-even and cash flow planning component helps users determine when the online marketplace may become financially self-sustaining and how much cash is needed along the way. Break-even analysis can show the point at which monthly revenue covers operating expenses, while cash flow planning shows whether the business has enough liquidity to survive the period before that milestone is reached. Inputs may include revenue growth, gross merchandise value, take rate, subscription adoption, payment fees, payroll, marketing spend, software costs, rent, professional services, taxes, debt payments, and working capital assumptions. Outputs may include monthly cash flow, ending cash balance, burn rate, runway, lowest cash point, break-even month, and cumulative funding needs. This component is particularly useful for marketplace businesses because growth often requires upfront investment in buyer and seller acquisition before transaction volume becomes large enough to absorb fixed costs. For decision-making, it helps users evaluate whether to raise more capital, reduce expenses, phase hiring, increase monetization, or adjust marketing strategy. For stakeholders, it provides a clear view of financial risk and shows how management plans to maintain liquidity while building toward profitability.
File types:
Excel – Single-User: .xlsx
Excel – Multi-User: .xlsx
Similar ProductsOther customers were also interested in...


 HenrySheykin
Fashion Marketplace Financial Model Excel Template
The Fashion Retail Financial Model helps entrepreneurs, founders, business owners, consultants, and ... Read more
Etsy & Ebay Store Financial Model Excel Templa...
The Etsy and eBay Store Financial Model helps marketplace sellers, founders, consultants, and busine... Read more

Toys Marketplace Financial Model Excel Template
The Toy Marketplace Financial Model Template helps founders, entrepreneurs, consultants, analysts, a... Read more
Collectibles And Antiques Marketplace Financial Mo...
The Antique Store Financial Model helps entrepreneurs, business owners, consultants, founders, and a... Read more

Arts, Crafts And Gifts Marketplace Financial Model...
The Handmade Goods Marketplace Financial Model helps founders, entrepreneurs, consultants, and analy... Read more

 Pushkar
Online Car Rental – 3 Statement Financial Mo...
Online Car Rental Platform Business Plan Model is a perfect tool for a feasibility study on launchin... Read more

 Yash
Beauty on Demand Marketplace Financial Model
This Financial Model is related to Startup marketplace model operating in the space of Beauty on Dem... Read more
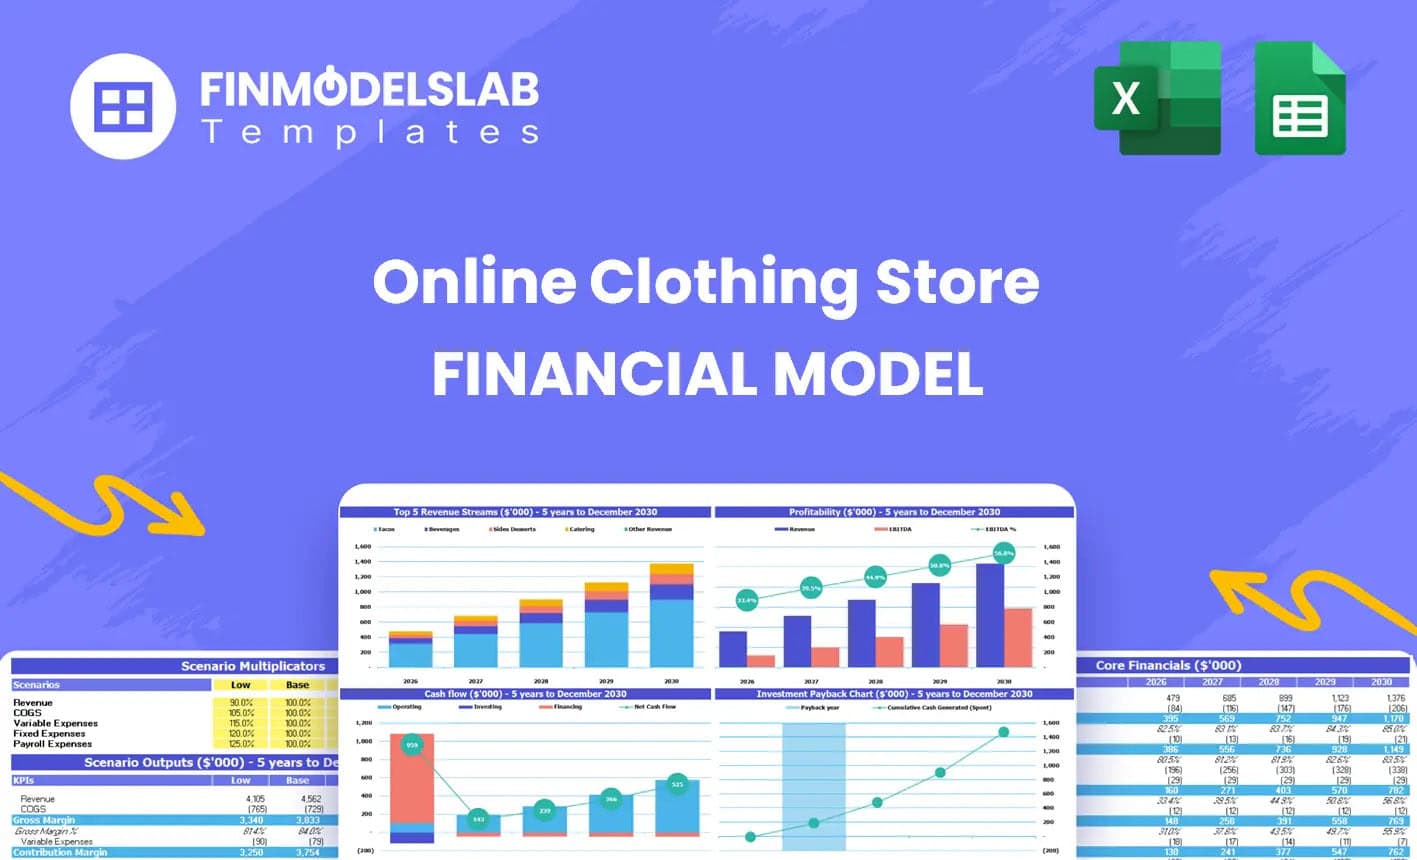
Online Clothing Store Financial Model Excel Templa...
The Online Clothing Store Financial Model helps founders, entrepreneurs, business owners, consultant... Read more

Online Services Marketplace Financial Model Excel ...
The Online Services Marketplace Financial Model helps founders, entrepreneurs, consultants, analysts... Read more

General Marketplace Financial Model Excel Template
The General Marketplace Financial Model Financial Model Template helps users plan, evaluate, and pre... Read more
You must log in to submit a review.