
0 ITEMS

Corporate Trainer Financial Model Excel Template
The Corporate Training Financial Model helps users turn a professional development or corporate learning business concept into a structured financial forecast. It is built for planning training programs, leadership courses, sales academies, technical bootcamps, and digital learning subscriptions with clear assumptions around pricing, enrollment, occupancy, capacity, costs, and profitability. Instead of starting with a blank spreadsheet, users can work from a ready-to-use financial model template that organizes the key drivers of a corporate training business into an editable planning tool. This template is useful for entrepreneurs, founders, business owners, consultants, analysts, and teams preparing business plans, funding documents, lender submissions, or internal growth strategies. It helps estimate revenue assumptions across training offerings, calculate startup costs, plan operating expenses, organize payroll needs, and evaluate whether the business can generate sustainable profit. By linking assumptions to financial outputs, the model gives users a clearer view of how course capacity, monthly fees, trainer costs, marketing spend, staffing, and digital product revenue affect the overall financial outlook. The Corporate Training Financial Model also supports practical decision-making by showing how the business may perform over time under realistic conditions. Users can review profitability, cash flow, break-even analysis, investor return metrics, and performance indicators without manually building complex formulas from scratch. The structure is designed to be understandable for non-financial users while still providing the depth expected by investors, lenders, and stakeholders reviewing a corporate training venture. Because the template is fully customizable, users can adjust the assumptions to match their own market, training formats, customer base, pricing strategy, and operating plan. Whether the goal is launching a new corporate training company, expanding an existing learning and development practice, building an internal training budget, or preparing a financial case for funding, this model provides a practical framework for testing scenarios, validating financial feasibility, and presenting a professional forecast with confidence.
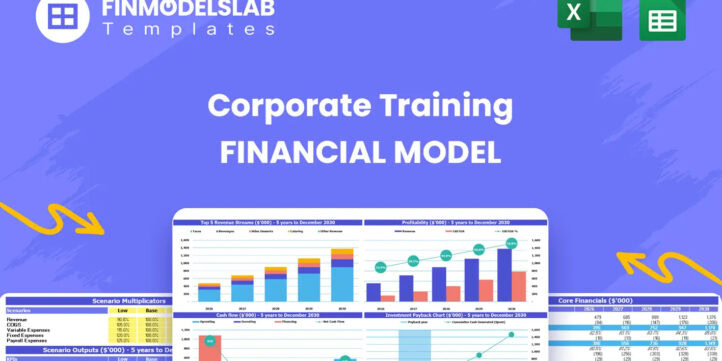


Corporate Training Financial Model Overview
The Corporate Training Financial Model is a ready-to-use financial model template designed for planning, launching, funding, or expanding a corporate learning and professional development business. It helps users organize the financial logic behind training programs, leadership development courses, sales training, technical skills bootcamps, and digital learning library subscriptions. The model connects the most important business drivers, including seats available, occupancy rates, monthly fees, startup investment, staffing, operating expenses, profitability, cash flow, and investor return metrics. For entrepreneurs, consultants, analysts, business owners, and teams preparing funding documents, it provides a structured way to replace guesswork with a clear forecast that can be edited, tested, and presented. Instead of building formulas from scratch, users can input their own assumptions and use the template to evaluate whether a corporate training business can generate enough revenue, maintain liquidity, reach break-even, and scale profitably over time.
All-in-One Dashboard
The all-in-one dashboard brings the most important inputs and outputs of the Corporate Training Financial Model into one centralized planning view. It is designed to help users quickly understand how their assumptions translate into financial results without having to move through every worksheet in detail. The dashboard may include core inputs such as program pricing, seat capacity, occupancy rates, revenue streams, cost assumptions, payroll levels, startup investment, and forecast timing. It then summarizes outputs such as total revenue, gross margin, EBITDA, net profit, cash balance, break-even timing, return metrics, and other performance indicators. For a corporate training business, this is especially useful because the model depends on multiple interconnected drivers, such as how many seats are filled in leadership development courses, how monthly fees are set, how trainer costs scale, and how digital subscriptions contribute to margins. The dashboard gives founders, consultants, and financial planners an at-a-glance way to review the business case, identify financial strengths and weaknesses, and prepare a clear summary for decision-making meetings, business plans, funding discussions, or internal strategy reviews.
Low, Base, and High Scenario Analysis
The low, base, and high scenario analysis section allows users to test how different assumptions affect the financial outlook of a corporate training business. Rather than relying on one static forecast, the model can show a conservative case, a realistic base case, and an upside case based on changes in key variables. These variables may include enrollment levels, occupancy rates, program pricing, customer acquisition pace, class capacity, hiring speed, marketing spend, trainer fees, digital learning subscription growth, and operating cost inflation. This component is valuable because corporate training demand can vary based on market conditions, enterprise budgets, sales cycles, and customer retention. By switching between scenarios, users can see how revenue, profit margins, cash runway, and funding needs change if the business fills fewer seats than expected, grows according to plan, or exceeds expectations. This helps users stress-test the plan, prepare for downside risk, set realistic targets, and communicate a more thoughtful financial strategy to investors, lenders, partners, or management teams. Scenario analysis also supports better decision-making by revealing which assumptions have the greatest influence on financial performance.
Professional Charts
The professional charts section turns the financial forecast into clear visual outputs that are easier to understand and present. A corporate training financial model may contain detailed monthly and annual calculations, but stakeholders often need a quick visual view of revenue growth, profitability trends, cash flow movement, cost structure, margin development, and business performance over time. This component can include charts for total revenue, revenue by training stream, EBITDA, net profit, cash balance, break-even progress, customer or seat growth, and expense trends. These visuals help users communicate the financial story behind the business, especially in pitch decks, business plans, lender packages, board meetings, and internal strategy discussions. For a corporate training company, charts can make it easier to explain how occupancy improves over time, how fixed costs create operating leverage, how digital learning products support margin expansion, and how the company moves toward profitability. The benefit is not only presentation quality, but also practical analysis. Visual reports make it easier to identify patterns, spot unrealistic assumptions, compare years, and understand whether the business is progressing toward sustainable growth.
ROE Components and DuPont Analysis
The ROE components and DuPont analysis section helps users evaluate the financial efficiency of the corporate training business by breaking return on equity into its underlying drivers. Instead of viewing return on equity as a single output, this component can show how profitability, asset use, and financial structure contribute to overall investor returns. Inputs may include net income, revenue, assets, equity, margins, and balance sheet assumptions, while outputs may include return on equity, profit margin, asset turnover, and equity multiplier. For a corporate training business, this analysis is useful because it helps users understand whether strong returns are coming from healthy margins, efficient use of resources, or leverage. A business with scalable training programs and digital learning subscriptions may show improving profitability as occupancy rises and fixed costs are spread across more revenue. DuPont analysis provides a more detailed view of capital efficiency, making it helpful for investors and founders who want to evaluate whether the business can generate attractive returns from the capital invested. It also supports more informed planning by showing which operational or financial levers can improve long-term performance.
Revenue Inputs
The revenue inputs section is where users define the key assumptions that drive sales in the Corporate Training Financial Model. For a training business, revenue is typically based on the number of available places in each program, the percentage of seats filled, the pricing or monthly fee per participant, the number of courses offered, and any recurring income from digital learning access. Inputs may include leadership development course capacity, sales excellence program pricing, technical skills bootcamp enrollment, subscription fees for a digital learning library, occupancy assumptions, annual growth rates, and timing of new program launches. This component is essential because revenue forecasting for corporate training is not just about applying a generic growth percentage. It requires understanding the relationship between capacity, demand, pricing, and program mix. By separating revenue drivers, users can test whether their pricing strategy is realistic, whether they need more seats to reach their goals, how much revenue comes from high-margin digital products, and how sensitive the business is to enrollment changes. Clear revenue inputs make the model easier to edit, easier to explain, and more credible when used for funding, budgeting, or strategic planning.
Bank-Ready Reports
The bank-ready reports section provides structured financial outputs that can be used for lender conversations, funding applications, investor reviews, and professional business planning. These reports may include an income statement, cash flow statement, balance sheet, summary financial projections, debt service indicators, profitability metrics, and other lender-friendly outputs. For a corporate training company seeking startup capital, working capital, or expansion financing, lenders want to see whether the business can generate consistent revenue, control expenses, maintain cash reserves, and repay obligations. This component helps users present that information in a clear and organized format. Inputs from the rest of the model flow into the reports, so changes to revenue assumptions, payroll, marketing costs, startup expenses, or financing structure are reflected in the financial statements. This saves time and reduces the risk of disconnected calculations. Bank-ready reporting is useful not only for external financing, but also for internal management, because it helps users review the financial health of the business in the same format that professional stakeholders expect. It gives the forecast a polished, credible structure for serious decision-making.
Revenue Breakdown
The revenue breakdown section gives users a detailed view of how total revenue is generated across the different training products and services in the business. Instead of only showing one total sales figure, this component separates income by stream, such as leadership development courses, sales excellence programs, technical skills bootcamps, and digital learning library access. Each stream may have its own assumptions for pricing, capacity, occupancy, growth, and launch timing. This is particularly valuable for a corporate training business because not all revenue streams behave the same way. Instructor-led programs may have capacity limits and trainer costs, while digital subscriptions may scale more efficiently and contribute higher margins over time. The revenue breakdown helps users identify which offerings generate the most income, which programs may need pricing adjustments, and how the mix of services affects profitability. It also supports sales planning and resource allocation by showing where demand needs to be built and where expansion may produce the strongest return. For investors and stakeholders, a detailed revenue breakdown makes the forecast more transparent and helps explain the business model beyond a single top-line number.
KPI Dashboard
The KPI dashboard summarizes the performance metrics that matter most for managing and evaluating a corporate training business. It may include indicators such as occupancy rate, revenue per seat, revenue per program, gross margin, EBITDA margin, net profit margin, cash balance, return on equity, payback period, customer growth, cost ratios, and benchmark comparisons. This component helps users move beyond traditional financial statements and focus on the operating metrics that explain performance. In corporate training, KPIs can reveal whether courses are filling at the expected pace, whether pricing supports profitability, whether trainer and marketing costs are in line with revenue, and whether digital subscriptions are contributing meaningful recurring income. The dashboard can also be useful for comparing projected performance against industry standards or internal targets, helping users validate assumptions and identify areas for improvement. For founders, consultants, and analysts, the KPI dashboard provides a practical management tool for tracking progress, preparing stakeholder updates, and making data-driven decisions. It also improves presentation quality by translating complex forecast outputs into concise metrics that are easier to discuss with investors, lenders, executives, or team members.
Startup and Operating Cost Planning
The startup and operating cost planning section helps users estimate the initial investment required to launch the corporate training business and the recurring expenses needed to operate it. Startup costs may include curriculum development, office setup, IT hardware, software licenses, website development, branding, legal setup, deposits, initial marketing, and working capital. Ongoing expenses may include trainer fees, employee salaries, payroll taxes, contractor costs, rent, learning management systems, software subscriptions, marketing campaigns, sales expenses, administrative costs, insurance, and professional services. This component is important because many training businesses require investment before revenue becomes consistent, especially if programs must be designed, materials produced, technology configured, and sales activity started before the first cohort is filled. By organizing startup costs separately from recurring operating expenses, users can understand how much funding is needed before launch and how much monthly revenue is required to support the cost base. The section also supports budgeting by helping users distinguish fixed costs from variable costs, align hiring with revenue growth, and avoid unexpected cash shortfalls. For funding documents, a clear cost plan shows investors or lenders that the business has considered both launch requirements and ongoing operational discipline.
Break-Even and Cash Flow Planning
The break-even and cash flow planning section helps users understand when the corporate training business may become profitable and whether it has enough liquidity to operate through the early months of growth. Break-even analysis can use assumptions such as revenue per participant, class occupancy, fixed costs, variable trainer costs, marketing spend, payroll, and gross margin to estimate the point at which revenue covers expenses. Cash flow planning then shows the timing of cash inflows and outflows, including startup investments, operating costs, customer payments, payroll, taxes, financing, and any capital expenditures. This is especially useful for a corporate training company because revenue may ramp up as programs fill, while many costs begin before full enrollment is achieved. A business may appear profitable on paper but still face cash pressure if payments arrive late, hiring happens too quickly, or upfront spending is too high. This component helps users monitor cash runway, plan funding needs, evaluate whether pre-sales or deposits are necessary, and make better decisions about when to expand course offerings or add staff. For entrepreneurs, analysts, and stakeholders, break-even and cash flow planning provide a practical view of financial feasibility and help determine whether the business can move from launch to sustainable profitability.
File types:
Excel – Single-User: .xlsx
Excel – Multi-User: .xlsx
Similar ProductsOther customers were also interested in...

 HenrySheykin
Business Brokerage Financial Model Excel Template
The Business Brokerage Financial Model helps entrepreneurs, brokerage owners, consultants, analysts,... Read more
Attorney Employment Agency Financial Model Excel T...
The Recruiting Agency Financial Model helps founders, agency owners, consultants, and analysts build... Read more
Law Firm Financial Model Excel Template
The Law Firm Financial Model Template helps users turn a legal practice concept into a structured fi... Read more
Architecture Firm Financial Model Excel Template
The Architectural Firm Financial Model Template helps founders, architecture practice owners, consul... Read more
Auditor Financial Model Excel Template
The Auditing Firm Financial Model helps founders, consultants, analysts, and business owners turn an... Read more
Financial Advisors Agency Financial Model Excel Te...
The Financial Advisor Financial Model is a ready-to-use financial model template built for planning,... Read more

Notary Financial Model Excel Template
The Notary Service Financial Model helps entrepreneurs, business owners, consultants, analysts, and ... Read more
Legal Services Financial Model Excel Template
The Legal Services Financial Model Financial Model Template helps entrepreneurs, law firm founders, ... Read more
Event Planner Financial Model Excel Template
The Event Planner Financial Model helps users turn an event planning business idea into a structured... Read more

Wedding Planner Agency Financial Model Excel Templ...
The Wedding Planning Agency Financial Model helps users turn a wedding planning business idea into a... Read more
You must log in to submit a review.