
0 ITEMS

Data Analytics Software Financial Model Excel Template
The Data Analytics Software Financial Model helps users build a structured financial forecast for a subscription-based analytics platform without starting from a blank spreadsheet. It is designed around the economics of a real SaaS business, including tiered subscriptions, usage-based revenue, one-time setup fees, retention, cloud hosting costs, staffing, customer acquisition, and scaling assumptions. Instead of relying on a generic software forecast, buyers can work from a ready-to-use financial model template that connects revenue assumptions, startup costs, operating expenses, cash flow, profitability, and investor metrics in one organized planning file. This template is built for entrepreneurs, founders, business owners, consultants, analysts, and finance teams preparing business plans, funding documents, lender packages, or internal growth plans for a data analytics software company. It gives users a practical way to estimate how the business may perform over time, evaluate whether pricing and customer growth can support the cost structure, and understand the funding required to launch or expand. The model is fully editable, so users can update subscription tiers, pricing, conversion rates, transaction volumes, hiring plans, payroll, marketing spend, technology costs, and other assumptions to match their own strategy. The financial model template supports a five-year planning view with detailed outputs for revenue, expenses, profit, cash flow, break-even analysis, and key performance indicators. Users can review monthly and annual projections, compare different scenarios, and see how changes in customer acquisition, churn, pricing, hosting costs, or staffing affect the overall business outlook. This makes it useful not only for presenting to investors or lenders, but also for day-to-day decision-making, budgeting, and testing the financial impact of strategic choices before committing resources. With investor-ready formatting, dashboard visuals, scenario tools, and professional financial outputs, the Data Analytics Software Financial Model helps turn assumptions into a more credible and decision-ready forecast. It is compatible with Microsoft Excel and Google Sheets, making it easy to customize, share with co-founders or advisors, and reuse as the business evolves. Whether you are launching a new analytics platform, validating a SaaS business plan, or preparing a funding presentation, this template provides a clear framework for understanding revenue potential, cost requirements, cash needs, profitability, and the path to sustainable growth.
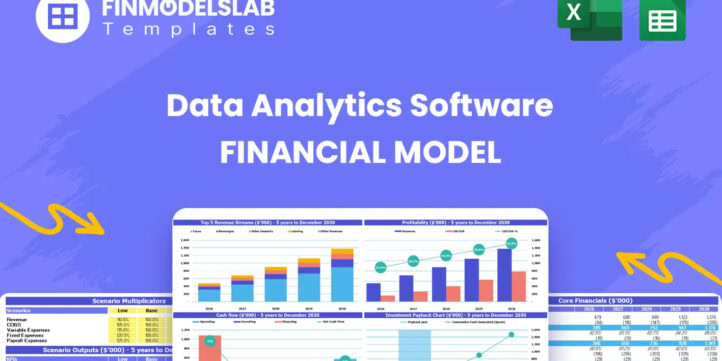


Financial Model Overview
The Data Analytics Software Financial Model is a ready-to-use financial model template created for founders, operators, consultants, analysts, and business planning teams working on a data analytics software venture. It is built around the financial drivers that matter most in a SaaS and analytics platform environment, including recurring subscription revenue, usage-based fees, implementation charges, customer growth, retention, cloud infrastructure, payroll, marketing spend, operating expenses, cash flow, and profitability. Instead of forcing users to adapt a generic spreadsheet, the model gives a structured planning framework for estimating how a data analytics software company may perform over a five-year period. It helps users organize assumptions, test commercial strategies, review funding needs, and prepare professional outputs for investors, lenders, internal teams, or strategic partners. Because the template is editable, users can replace the default assumptions with their own pricing, customer acquisition, cost structure, hiring plan, and expansion strategy, making it useful for both startup launch planning and established software businesses preparing for growth.
All-in-One Dashboard
The all-in-one dashboard brings the most important inputs and outputs into one practical view so users can understand the financial position of the data analytics software business quickly. This component is useful because SaaS models often include many moving parts, such as monthly recurring revenue, customer additions, churn, pricing tiers, cloud costs, payroll, marketing spend, capital requirements, and cash balances. The dashboard helps consolidate those drivers into a clear snapshot of revenue, expenses, profit, cash flow, margins, and other core financial outputs. Users can update key assumptions in the model and then review how those changes affect the overall business forecast without manually rebuilding summaries. For planning and decision-making, this section helps founders and analysts see whether the business model is balanced, whether growth assumptions are realistic, and whether the projected financial results support the company’s funding, hiring, and product development strategy. It is especially useful for investor discussions because it gives stakeholders a concise view of the business case before they review the deeper financial schedules.
Low Base High Scenario Analysis
The low, base, and high scenario analysis section helps users compare multiple possible outcomes for the data analytics software business. This is especially important for a software company because performance can vary significantly depending on trial-to-paid conversion, customer acquisition cost, retention, pricing strategy, enterprise adoption, transaction volume, and the timing of new hires. The base case can represent the expected operating plan, while the low case can show a more conservative path with slower growth, higher churn, or increased spending, and the high case can show upside potential from stronger sales execution or better enterprise conversion. The component helps generate different views of revenue, profitability, cash flow, and funding needs under each scenario, allowing users to evaluate risk before making commitments. For entrepreneurs, this can support smarter budgeting and more realistic runway planning. For investors and lenders, it demonstrates that the business plan has been stress-tested and that the management team understands how key variables may influence financial performance.
Professional Charts
The professional charts section transforms the model’s financial outputs into presentation-ready visuals that are easier to interpret than raw spreadsheet rows. For a data analytics software company, charts can help communicate revenue growth, expense trends, gross margin improvement, EBITDA progression, cash flow movement, customer growth, and other important patterns over time. This component uses the model’s underlying assumptions and projections to generate visual summaries that can support investor decks, board updates, lender presentations, and internal strategy meetings. Charts are useful because financial stakeholders often need to understand the story behind the numbers quickly, such as when the business starts generating meaningful recurring revenue, how expenses scale, or whether profitability improves as the customer base expands. By presenting complex forecasts in a clearer format, this section helps users make the financial model more persuasive and accessible. It also helps teams spot trends, compare performance across years, and identify areas where the forecast may need adjustment before the plan is shared externally.
ROE Components and DuPont Analysis
The ROE components and DuPont analysis section helps users evaluate the drivers behind return on equity rather than looking only at the final return figure. This is valuable for a data analytics software business because investor returns are influenced by profitability, operating efficiency, asset use, capital structure, and the relationship between growth and funding requirements. The section can break return on equity into underlying components so users can see whether projected returns are being driven by strong margins, efficient use of capital, revenue scalability, or leverage. Inputs may include net income, equity, assets, revenue, margins, and balance sheet assumptions, while outputs help show how the company’s financial structure contributes to shareholder return. This component is useful for investor readiness because it gives a more analytical view of performance and helps explain why the business may be attractive from a return perspective. It also supports internal decision-making by showing whether improvements should come from pricing, cost management, asset efficiency, or funding structure.
Revenue Inputs
The revenue inputs section is one of the core planning areas of the Data Analytics Software Financial Model because it defines how the business earns money. For a data analytics software company, revenue may come from tiered monthly subscriptions, usage-based transaction fees, one-time setup or implementation charges, enterprise plans, and other recurring or variable streams. This component allows users to enter assumptions for pricing, customer volumes, conversion rates, acquisition pace, plan mix, usage levels, and revenue growth over time. Outputs from this section feed into the broader financial forecast, including monthly recurring revenue, total sales, gross profit, cash flow, and profitability. It is useful because small changes in subscription pricing, customer growth, churn, or enterprise adoption can have a major effect on the forecast. By structuring revenue assumptions clearly, the model helps users test whether the planned pricing strategy can support product development, sales efforts, infrastructure costs, and long-term growth. It also helps investors understand the commercial logic behind the forecast instead of seeing unsupported revenue estimates.
Bank-Ready Reports
The bank-ready reports section provides lender-friendly financial outputs that can support financing discussions, loan applications, or working capital planning. Lenders typically want to see clear projections for revenue, operating expenses, profit and loss, cash flow, balance sheet movement, debt capacity, and repayment ability. This component organizes the model’s outputs into a professional format that helps demonstrate whether the data analytics software business can generate enough cash to sustain operations and meet financial obligations. Inputs may come from the revenue forecast, cost assumptions, payroll plan, startup investment, financing structure, and operating expense schedules. Outputs can help show monthly and annual financial performance, projected liquidity, and the stability of the business over time. This is useful for founders seeking bank financing, credit lines, equipment funding, or other forms of non-dilutive capital. It also benefits business owners and consultants preparing formal funding documents because it converts the forecast into reports that are easier for financial institutions and stakeholders to review.
Revenue Breakdown
The revenue breakdown section provides a more detailed view of how total revenue is built across different streams, customer groups, and pricing categories. In a data analytics software business, revenue may not come from a single source. A company may have basic subscriptions for smaller users, professional plans for growing teams, enterprise intelligence packages for larger customers, setup fees for implementation, and variable usage charges tied to transactions, data volume, or platform activity. This component helps users separate and analyze those revenue streams so they can understand which products or customer segments contribute most to growth and profitability. Inputs may include pricing by plan, number of customers by tier, adoption rates, upsell assumptions, usage volume, and one-time service charges. Outputs help show total revenue by category, the mix between recurring and non-recurring income, and the potential impact of shifting toward higher-value customers. This is useful for strategic planning because it can highlight whether growth depends on volume, pricing, enterprise conversion, usage expansion, or a combination of these drivers.
KPI Dashboard
The KPI dashboard section focuses on the performance metrics that help users assess whether the data analytics software business is operating efficiently and scaling in a financially healthy way. For a SaaS-style analytics platform, key metrics may include monthly recurring revenue, annual recurring revenue, customer acquisition cost, conversion rates, churn, customer lifetime value, gross margin, EBITDA margin, payback period, cash balance, burn rate, and revenue per customer. This component can compare performance against internal targets or industry benchmarks, helping users validate assumptions and identify areas that may require improvement. Inputs come from the model’s revenue, customer, cost, payroll, and cash flow schedules, while outputs turn those calculations into clear business indicators. The KPI dashboard is useful for founders managing growth, advisors reviewing the plan, and investors evaluating scalability. It helps users move beyond headline revenue and understand whether the underlying business model is improving over time, whether sales and marketing spend is efficient, and whether the company can build sustainable profitability.
Startup Costs and Operating Expense Planning
The startup costs and operating expense planning section helps users estimate the capital required to launch and run the data analytics software business. Startup costs may include initial software development, cloud architecture setup, computing hardware, data infrastructure, licenses, legal setup, branding, marketing assets, security tools, office or remote work setup, and initial working capital. Operating expenses may include payroll, contractor support, hosting, software subscriptions, sales and marketing, customer support, insurance, accounting, professional services, product maintenance, and general administration. This component is useful because it separates one-time launch investments from recurring monthly costs, giving users a clearer view of funding needs and burn rate. Inputs can be adjusted to match the company’s product roadmap, team structure, go-to-market strategy, and operational requirements. Outputs help estimate launch budget, monthly expense levels, cash runway, and the cost structure needed to support revenue growth. For planning and funding, this section helps founders avoid underestimating capital requirements and gives investors a more detailed view of how funds will be used.
Break-Even Analysis
The break-even analysis section helps users identify when the data analytics software business is projected to move from operating at a loss to generating enough revenue to cover its costs. This is a critical planning tool because software companies often invest heavily in product development, marketing, infrastructure, and sales capacity before reaching stable profitability. The section can use assumptions for subscription revenue, usage fees, setup charges, cost of goods sold, payroll, hosting costs, marketing spend, and other operating expenses to calculate the point at which total revenue exceeds total costs. Outputs may include the estimated break-even month, revenue required to break even, customer volume needed to support the cost base, and the effect of different pricing or expense assumptions on profitability timing. This component is useful for entrepreneurs preparing launch plans, investors evaluating risk, and managers making decisions about hiring, customer acquisition, and cost control. It gives the user a practical milestone for measuring progress and helps determine whether the business model can reach sustainable profitability within an acceptable timeframe.
File types:
Excel – Single-User: .xlsx
Excel – Multi-User: .xlsx
Similar ProductsOther customers were also interested in...

 HenrySheykin
E-Commerce Software Financial Model Excel Template
The E-Commerce Platform Financial Model Financial Model Template helps founders, entrepreneurs, cons... Read more
Customer Service Software Financial Model Excel Te...
The Customer Service Software Financial Model helps founders, operators, consultants, and analysts t... Read more
Equipment Rental Subscription Financial Model Exce...
The Equipment Rental Subscription Financial Model helps users turn an equipment-as-a-service busines... Read more
CRM Software Financial Model Excel Template
The CRM Software Financial Model is a ready-to-use financial model template designed to help founder... Read more
Fresh Flowers Subscription Financial Model Excel T...
The Subscription Box Financial Model Template helps entrepreneurs, founders, analysts, consultants, ... Read more
Procurement Software Financial Model Excel Templat...
The Procurement Software Financial Model helps founders, entrepreneurs, consultants, analysts, and b... Read more

Software Development Financial Model Excel Templat...
The Software Development Financial Model Template helps founders, entrepreneurs, consultants, analys... Read more
Accounting Software Financial Model Excel Template
The Accounting Software Financial Model helps founders, entrepreneurs, consultants, analysts, and bu... Read more
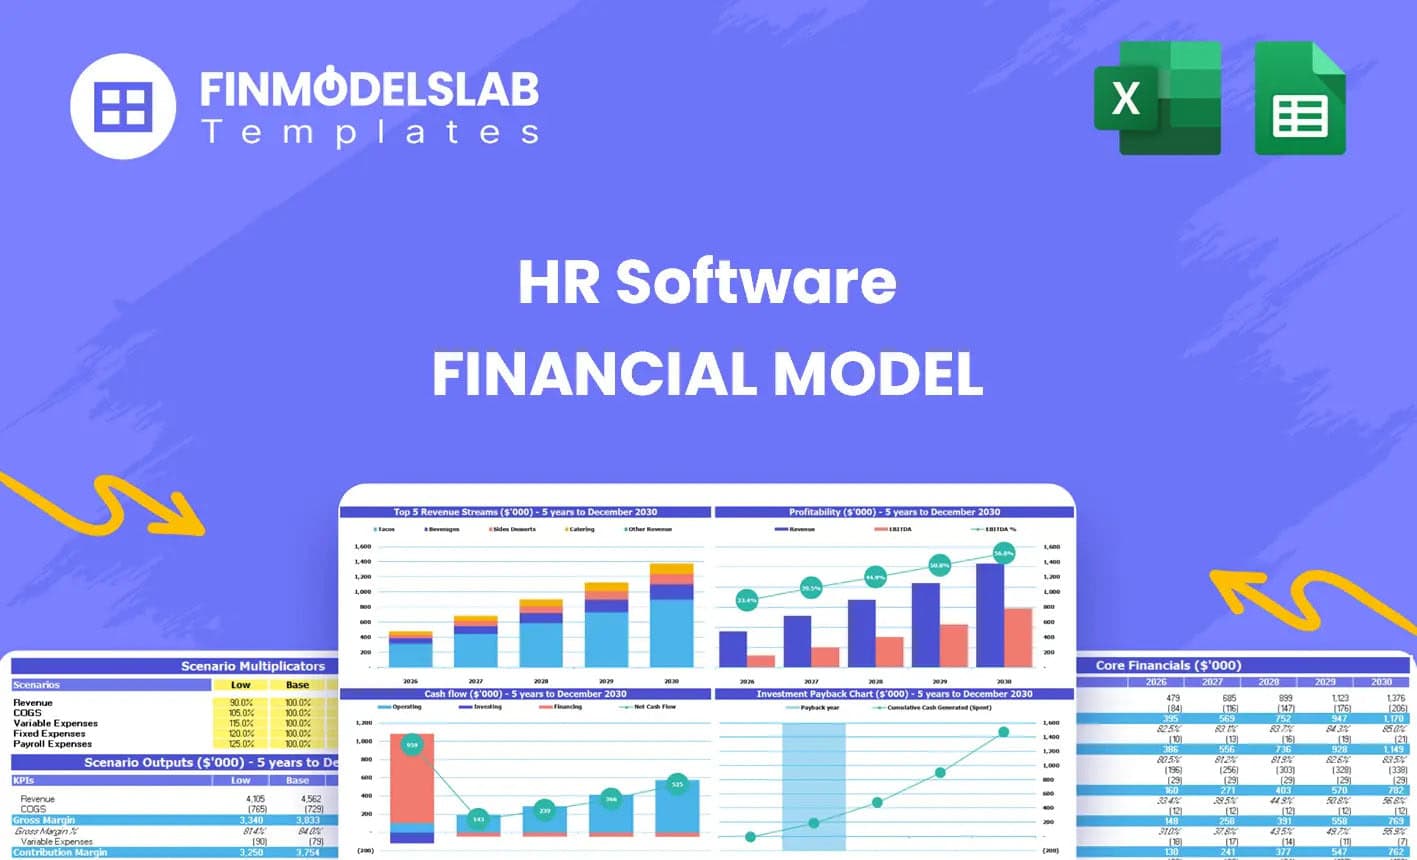
Human Resource Software Financial Model Excel Temp...
The HR Software Financial Model Financial Model Template helps founders, business owners, consultant... Read more
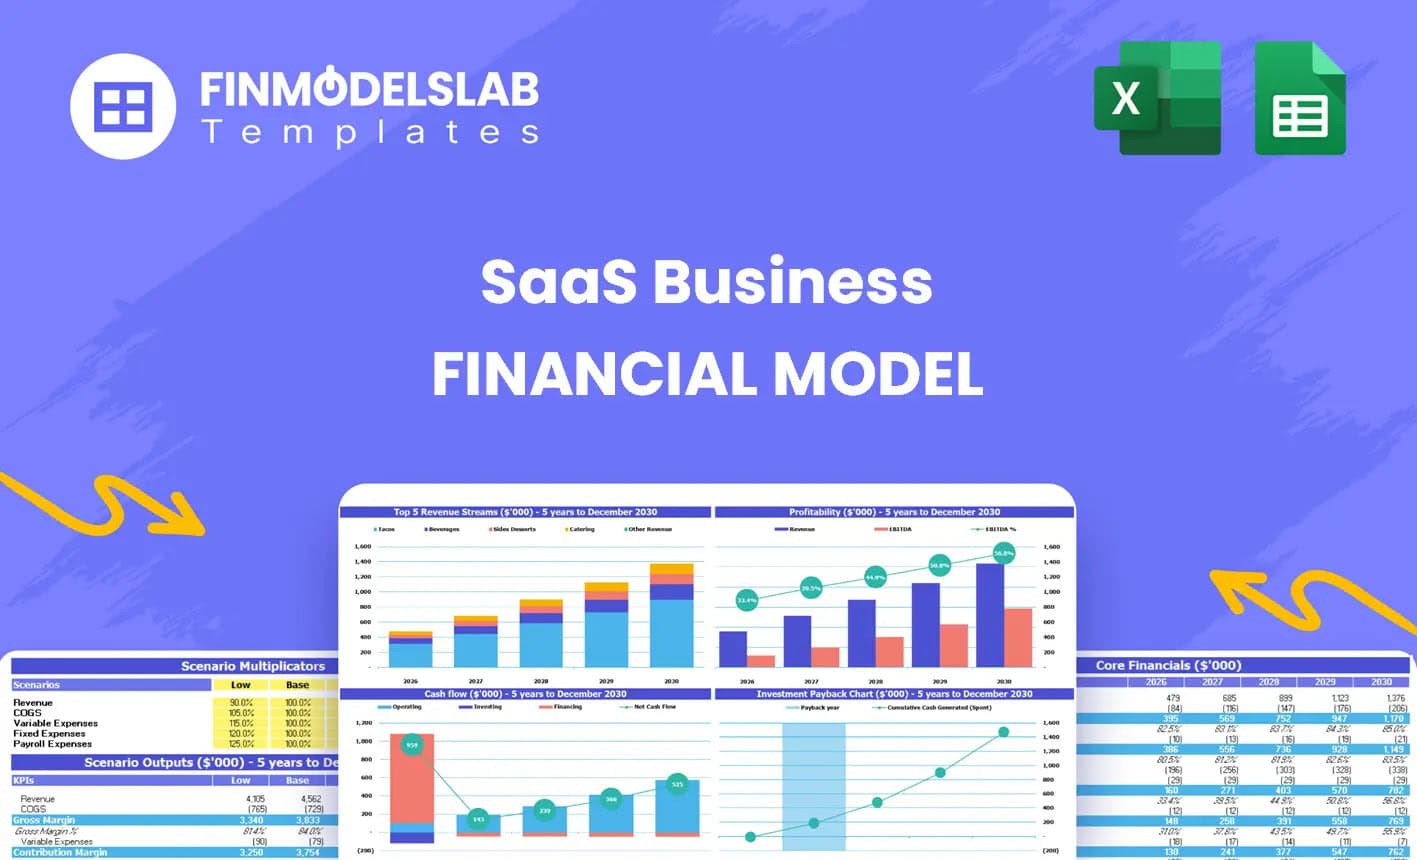
SaaS Actuals Opt-In Financial Model Excel Template
The SaaS Business Financial Model helps founders, entrepreneurs, consultants, analysts, and business... Read more
You must log in to submit a review.