
0 ITEMS

10 Key Financial Value Drivers in Business

“What gets measured gets managed.” This classic adage holds true in business valuation. Every company has key factors that drive its worth. Business value isn’t random—key financial factors drive it. Measuring the right metrics helps businesses grow, stay profitable, and attract investors. Revenue, margins, cash flow, and efficiency all shape a company’s worth. Strong financial management ensures long-term success. By tracking these drivers, businesses can maximize their value. In this blog, we break down the top 10 value drivers in business that influence a company’s success, guiding you on what to measure—and how to manage it for higher returns.
Understanding key financial drivers is essential for maximizing your business’s value and long-term growth.
- Metrics like revenue growth, EBITDA margin, and valuation multiples directly influence a company’s market worth.
- Managing cash flow metrics such as days receivables and inventory turnover improves liquidity and operational efficiency.
- Balancing debt and equity ratio reduces financial risk while supporting sustainable expansion.
- Scenario analysis helps identify growth opportunities and mitigate risks in changing market conditions.
- Focusing on these drivers ensures a holistic approach to boosting business valuation and attracting investors.
Read on to see which strategies can have the most impact on your company’s success.
What are Business Value Drivers?
Business value drivers are key factors that increase a company’s worth. They influence profitability, growth, efficiency, and risk. Strong value drivers improve cash flow, optimize resources, and attract investors. They help businesses stay competitive and build long-term success. Measuring and managing these drivers ensures sustainable financial growth. Companies with high-value drivers attract investors and buyers. Identifying and improving these factors helps businesses grow and stay competitive.
These business value drivers fall into two categories: financial and non-financial. They drivers focus on revenue, profit, cash flow, and efficiency. Non-financial drivers include brand strength, customer loyalty, innovation, and leadership. Strong financials keep the business stable, while non-financial drivers ensure long-term growth. Understanding and improving these areas can boost business valuation and market appeal.
In finance, business value drivers are activities that boost revenue and profit. In other words, business value drivers shape financial success.

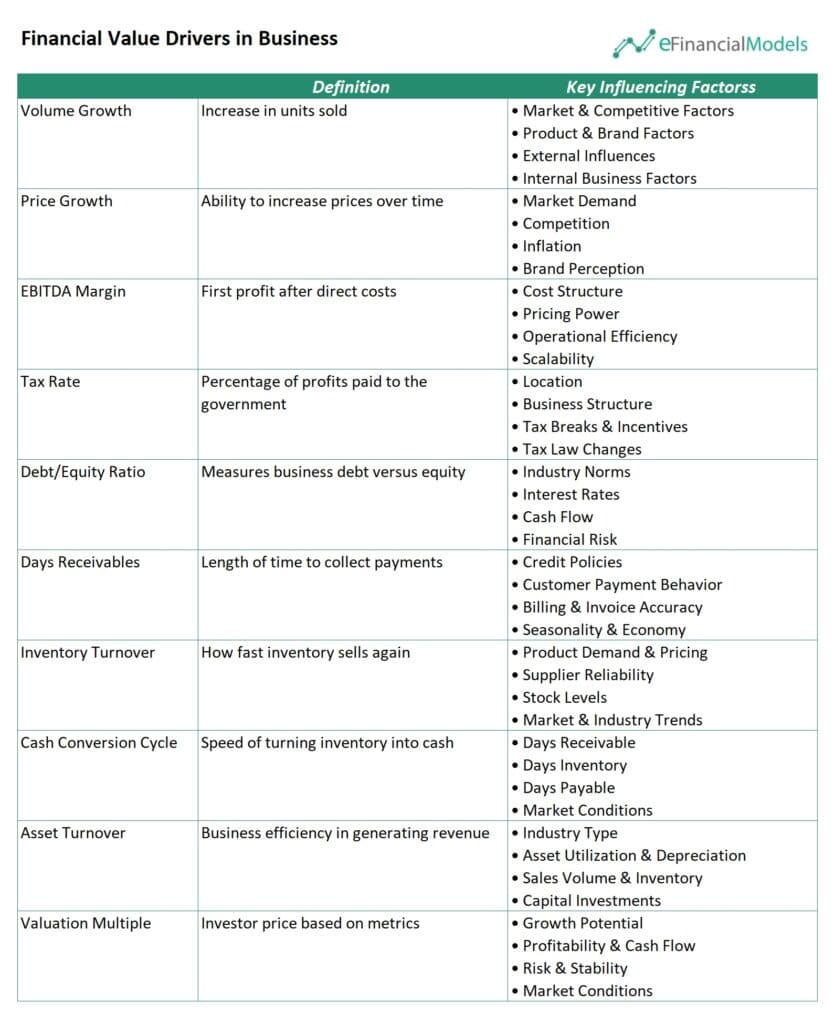
This article explores ten key financial drivers that impact business growth and stability.
- Volume Growth
- Price Growth
- EBITDA Margin
- Tax Rate
- Debt/Equity Ratio
- Days Receivables
- Inventory Turnover
- Cash Conversion Cycle
- Asset Turnover
- Valuation Multiple
Each factor plays a vital role. Understanding these metrics helps businesses maximize value and long-term potential.

Why Value Drivers in Business Matter
Value drivers in business are the key factors influencing success and long-term profitability. They shape business strategy, impact financial performance, and create competitive advantages. Strong value drivers in business lead to high profit margins, promote growth, improve the efficiency in the invested capital and attract investors. Understanding and optimizing these factors can lead to higher profits and long-term stability.
- Competitive Advantage: A strong competitive advantage sets a business apart. It can come from value drivers in business like innovation, customer service, or brand reputation. Companies with a clear edge can capture market share, build customer loyalty, and sustain long-term success. Without differentiating value drivers in business, it risks losing relevance and profitability.
- High-Profit Margins: High profit margins show how well a business controls costs and prices its products for maximum earnings. Strong margins mean the company keeps more profit from each sale, boosting cash flow and long-term growth. Investors see high margins as a sign of financial strength and pricing power. Businesses with strong margins can reinvest in innovation, marketing, or expansion without relying too much on debt. As a key value driver, high-profit margins increase a company’s overall worth, making it more attractive to buyers, investors, and stakeholders.
- Sustainable Growth: Sustainable growth ensures long-term success without overextending resources. Businesses must balance expansion with financial stability and operational efficiency. Strategies to optimize value drivers in business drive steady progress. Companies that grow sustainably build lasting value and withstand economic downturns.
- Increase Business Valuation: Higher business valuation attracts investors, enables better financing options, and improves exit opportunities. Strong financial performance, scalable operations, and consistent revenue growth drive valuation. Focusing on value drivers in business can command higher acquisition prices and secure funding more easily.
- Market Positioning: Effective market positioning helps businesses connect with their ideal customers. It defines how a company differentiates itself and influences customer perception. A clear market positioning strategy enhances value drivers in business.
Risk Mitigation: Managing risks protects businesses from financial losses and operational disruptions. Identifying and addressing risks early prevents costly setbacks. Strategies to enhance value drivers in business ensure stability. Businesses that prioritize risk management can adapt quickly and maintain resilience in uncertain markets.
Without understanding value drivers in business, as mentioned above, growing, competing, and staying profitable will be a struggle. You will risk weak positioning, low valuation, and poor financial performance. Without a clear advantage, you will lose market share and miss opportunities. Ignoring risk leads to costly failures and instability. Sustainable growth becomes impossible without a solid foundation. To succeed, you must identify and strengthen your key value drivers in business.
























































What Are the Top 10 Financial Value Drivers of A Company?
What makes a company valuable? Investors and buyers look at key factors that determine a company’s worth. Below are the top 10 financial value drivers of a company:
Volume Growth
Volume growth refers to the increase in the number of units a business sells over time. It directly impacts revenue and profitability, making it one of a company’s most crucial value drivers. Strong volume growth signals high market demand and efficient operations. Businesses that achieve consistent volume growth tend to scale faster and strengthen their competitive position.
Several factors influence volume growth. Market demand, pricing strategy, and competitive landscape play key roles. Product quality, brand reputation, and customer satisfaction also impact sales volume. External elements like economic conditions, industry trends, and technological advancements can either boost or limit growth potential. Internal factors, such as production capacity, distribution channels, and sales efficiency, further determine a company’s ability to scale.
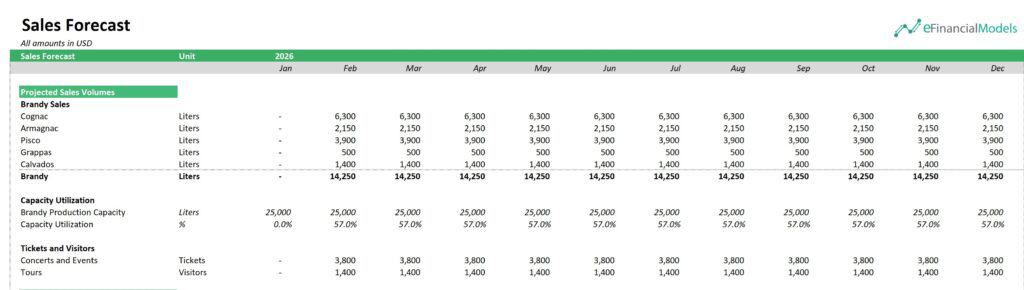
The above sales forecast chart from our Brandy Distillery Business Financial Model shows steady brandy sales, with monthly production reaching 14,250 liters and utilizing 57% of capacity. Increasing sales volume can drive business value by maximizing production capacity, reducing per-unit costs, and boosting profitability.
Price Growth
Price growth is also one of the value drivers of a company directly impacting revenue and profitability. It refers to the ability to increase prices over time without losing customers. Strong price growth indicates high demand, brand strength, and pricing power. Businesses that raise prices while maintaining sales volume create long-term value and boost investor confidence.
Several factors influence price growth, including market demand, competition, inflation, and brand perception. Companies with unique products or strong customer loyalty can raise prices more easily. Economic conditions also play a role—high inflation often pushes prices up, while intense competition can limit pricing power. Cost structures also matter; rising costs may force businesses to increase prices to maintain margins.
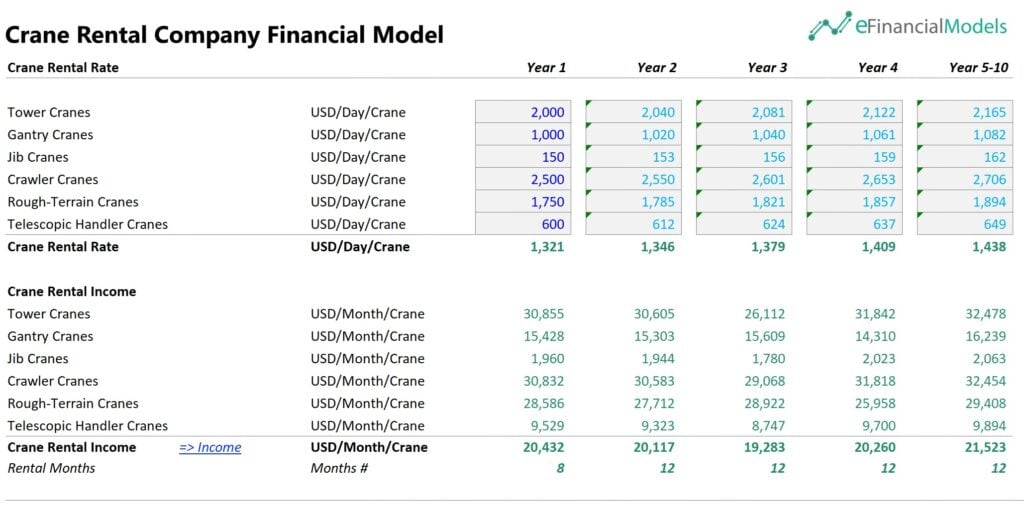
The chart above from our Crane Rental Company Financial Model shows how steady price increases boost value over time. Rental rates rise yearly, driving up the average price per crane. This increases monthly rental income, especially as utilization improves from 8 to 12 months yearly. Even small price hikes, like a 2% annual increase, compound over time, significantly impacting revenue.
EBITDA Margin
EBITDA margin measures a company’s profitability before deducting interest, taxes, depreciation, and amortization. It shows the first profit level after covering direct costs like raw materials and labor. This margin helps investors and business owners understand how efficiently a company generates earnings before financial and accounting expenses impact the bottom line. A high EBITDA margin means strong operational performance, while a low margin signals inefficiencies or high costs.
Several factors influence EBITDA margin, including pricing power, cost structure, and operational efficiency. A company with strong pricing power can charge higher prices, boosting revenue without increasing costs. Efficient cost management, such as controlling labor and material expenses, also plays a key role. External factors like industry competition, supply chain disruptions, and economic conditions can impact margins by affecting both revenue and costs. Businesses with a scalable model often see higher EBITDA margins as they grow.
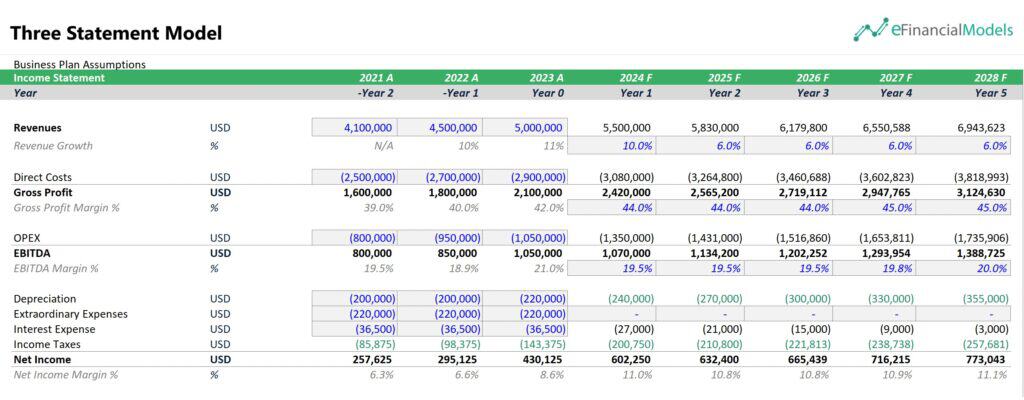
The above chart presents our Three Statement Model focusing on revenue, costs, and profitability over multiple years. A key insight is the rising EBITDA margin, improving from 19.5% in 2021 to 20.0% in 2028. This increase signals stronger operational efficiency as the business generates more profit from each dollar of revenue.
Tax Rate
The tax rate is the percentage of a company’s profits paid to the government in taxes. It determines how much of a company’s profits go to the government. A lower income tax rate or tax credits can reduce this burden, leaving more cash for growth. This directly impacts cash flow and profitability, making tax planning essential for long-term success.
Several factors affect a business’s tax rate. Location matters, as different countries and states have varying tax policies. Business structure also plays a role—corporations, LLCs, and sole proprietorships are taxed differently. Deductions, credits, and government incentives can further influence the final tax bill. Economic policies and changes in tax laws can shift rates, making it important to stay updated.
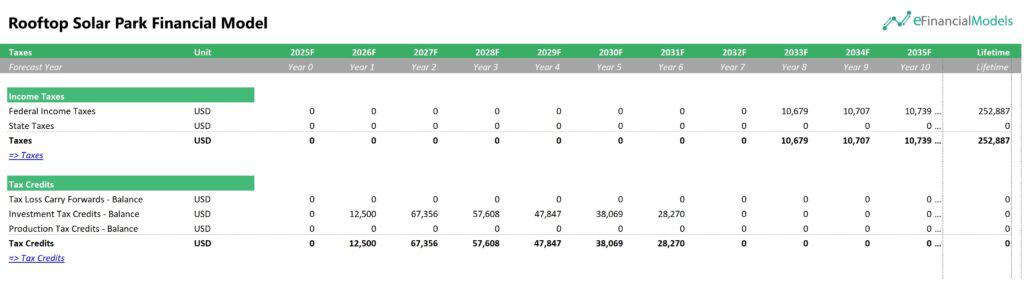
The chart above shows how tax incentives impact the financial outlook of our Rooftop Solar Park Financial Model. In the early years, tax credits like Investment Tax Credits (ITC) significantly reduce tax liabilities, helping the business recover costs and improve cash flow. By utilizing these credits, the project avoids taxes in the initial years, allowing more funds for reinvestment. However, as tax credits phase out, taxable income rises, leading to federal income taxes in later years. This structured approach enhances business value by maximizing early savings, reducing upfront financial strain, and ensuring long-term profitability.
Debt/Equity Ratio
The Debt/Equity Ratio measures financial leverage, showing how much debt a business uses to boost returns. Borrowing can amplify profits, but too much debt increases financial risk. A well-balanced ratio ensures a company can fund growth without overburdening itself with obligations. It is one of the most essential value drivers of a company that investors and lenders watch out for.
Several factors influence the Debt/Equity Ratio. Industry norms, interest rates, and a company’s cash flow impact how much debt is sustainable. Some argue that leverage does not create value since it divides profits differently between debt and equity holders. However, excessive debt increases financial risk, making highly leveraged companies vulnerable during downturns.

The chart above shows key bank ratios of our SaaS B2C Financial Model for Irregular Subscription Renewal. The Debt/Equity ratio fluctuates over time, starting at 24.0% and dropping close to zero before rising again. The data suggests that as profitability improves, debt reliance decreases, showing a shift toward financial stability. Finding the right balance between debt and equity is key to long-term growth.
Days Receivables
Days Receivables, or Days Sales Outstanding (DSO), measures how long a company takes to collect payments after a sale. It reflects how efficiently a business manages credit sales and cash flow. A lower DSO means faster collections, while a higher DSO signals delayed payments, which can strain liquidity.
Several factors influence DSO. Credit policies play a key role—loose terms lead to slower collections. Customer payment behavior also matters, as some industries naturally have longer cycles. Billing efficiency and invoice accuracy impact how quickly payments arrive. Seasonality and economic conditions can also affect customers’ ability to pay on time.

The chart above shows the efficiency ratios of our Construction Machinery Rental Company Financial Model. It includes Days Receivables, which measures how long it takes to collect customer payments. Lower days receivables, as seen in later years (dropping from 35 to around 24-26), means faster cash collection, improved cash flow, and reduced risk of bad debt. This efficiency strengthens working capital, allowing the company to reinvest in new equipment, expand operations, or reduce financing costs.
Inventory Turnover
Inventory turnover measures how often a business sells and replaces its stock within a period. A low turnover means slow-moving inventory, which ties up cash and increases storage costs. A high turnover shows strong sales and efficient inventory management. Businesses should aim for an optimal balance to avoid stockouts or excess inventory.
Several factors affect inventory turnover. Product demand, pricing strategy, and supplier reliability all play a role. Holding too much inventory increases carrying costs, while frequent stockouts hurt sales. Seasonal trends, industry norms, and supply chain efficiency also impact how quickly inventory moves.
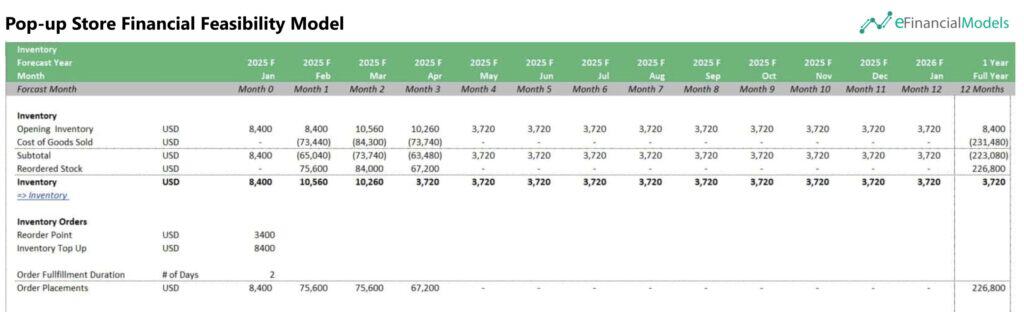
The chart above shows how inventory levels, cost of goods sold (COGS), and reorder points affect our Pop-up Store Financial Feasibility Model Template. A higher inventory turnover, seen through frequent reorders and reduced stock holding, frees up cash, lowers storage costs, and improves liquidity. Efficient inventory management signals strong demand and operational effectiveness, making the business more attractive to investors.
Cash Conversion Cycle
One of the most important key value drivers of a company is the Cash Conversion Cycle (CCC). It measures how fast a business can turn investments in inventory into cash. It is calculated as Days Receivable + Days Inventory – Days Payables. A lower CCC means the company gets cash faster, improving liquidity and financial health. Businesses with a short cycle can reinvest quickly, reducing the need for external funding.
Several factors affect CCC. Days Receivable depends on how fast customers pay. Days Inventory reflects how long products sit before selling. Days Payable measures how long a company takes to pay suppliers. Industry norms, supplier terms, and demand fluctuations also play a role. A long CCC can strain cash flow, making it harder to cover expenses.
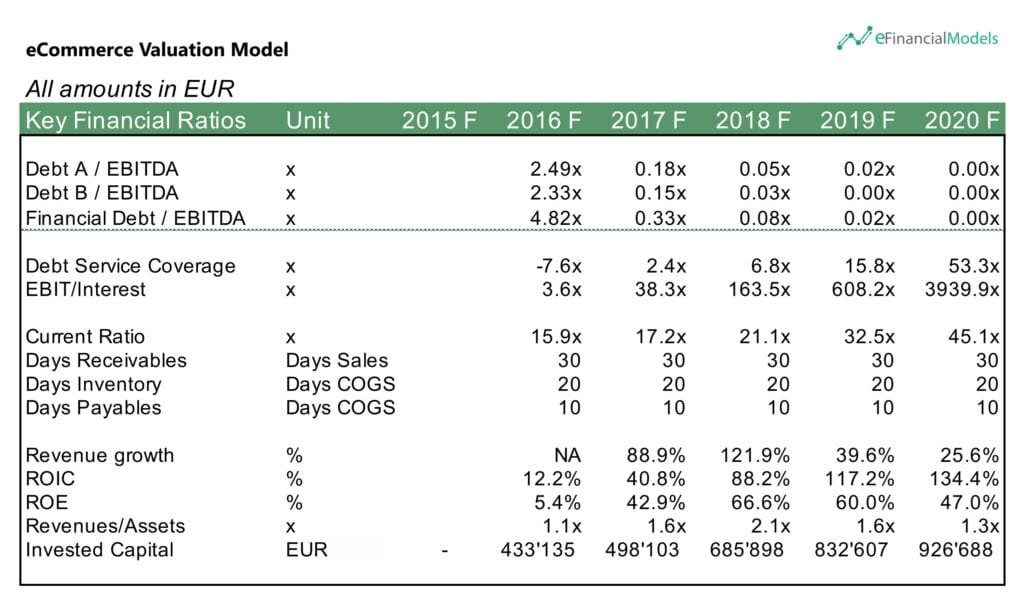
The chart above shows the key financial ratios of our eCommerce Valuation Model. It includes Days Receivables (30), Days Inventory (20), and Days Payables (10), which determine the Cash Conversion Cycle (CCC). The CCC = 30 + 20 – 10 = 40 days, meaning the business takes 40 days to turn inventory into cash. It is decent but could be improved to increase cash flow and business value. A shorter CCC improves liquidity, reduces financing needs, and increases operational efficiency, making the business more valuable.
Asset Turnover
Asset turnover measures how efficiently a business uses its assets to generate revenue. It is calculated by dividing revenue by total assets. A high asset turnover ratio means the company generates more revenue per dollar of assets, while a low ratio suggests underutilized resources or a capital-intensive business. This metric is crucial for assessing operational efficiency and how effectively a company converts its investments into sales.
Several factors impact asset turnover. Industry type plays a big role—retail businesses often have higher asset turnover than manufacturers due to lower capital requirements. Depreciation, asset utilization, and sales volume also influence the ratio. If a company holds excessive inventory, inefficiently uses equipment, or faces slow sales, its asset turnover will decline. Additionally, large property, plant, or machinery investments can lower the ratio, even if necessary for long-term growth.
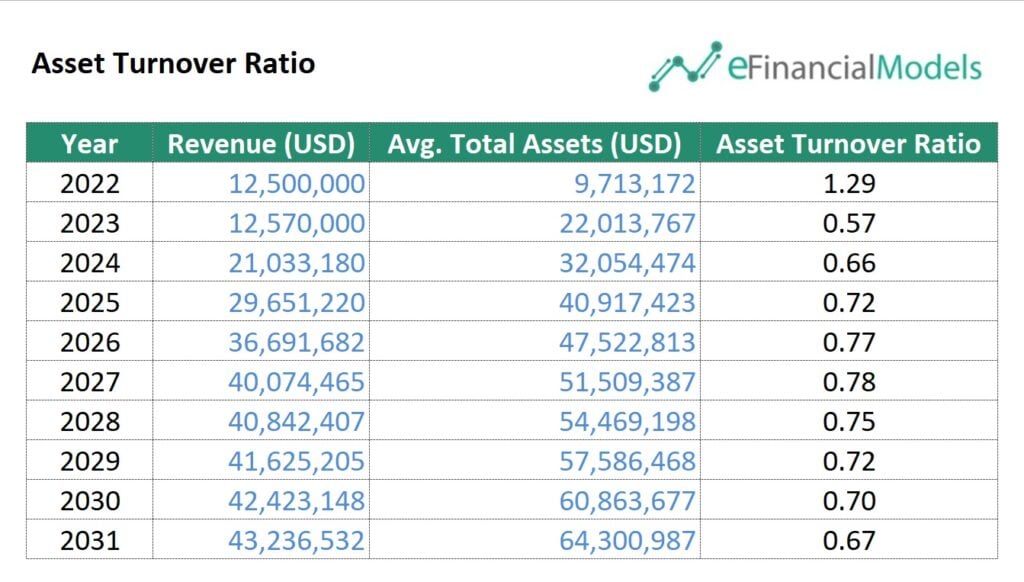
The above Asset Turnover Ratio chart shows how efficiently a business generates revenue from its assets. A higher ratio means better asset utilization, which can increase profitability and investor confidence. 2022 the ratio was 1.29, but it dropped in later years, stabilizing around 0.67 to 0.78. While revenue grows, assets increase at a faster rate, lowering efficiency. Businesses can improve this by optimizing operations, reducing underutilized assets, or boosting sales. For example, a Financial Model for a Simple Retail Chain Rollout can improve the Asset Turnover Ratio by optimizing store expansion, inventory management, and sales forecasting to maximize revenue while minimizing asset investment.
Valuation Multiples
Valuation multiples measure how much investors are willing to pay for a company based on its earnings, revenue, or other financial metrics. A higher multiple means a higher valuation, which directly increases a business’s worth. Investors and buyers use these multiples to compare companies and make informed decisions. Strong financial performance, market potential, and industry trends heavily influence these figures.
Several factors affect valuation multiples. Growth potential, profitability, and risk levels play a key role. Companies in high-growth industries, such as technology, often command higher multiples. Stable revenue streams and strong cash flow also attract higher valuations—external factors like interest rates, economic conditions, and investor sentiment further impact how multiples fluctuate.
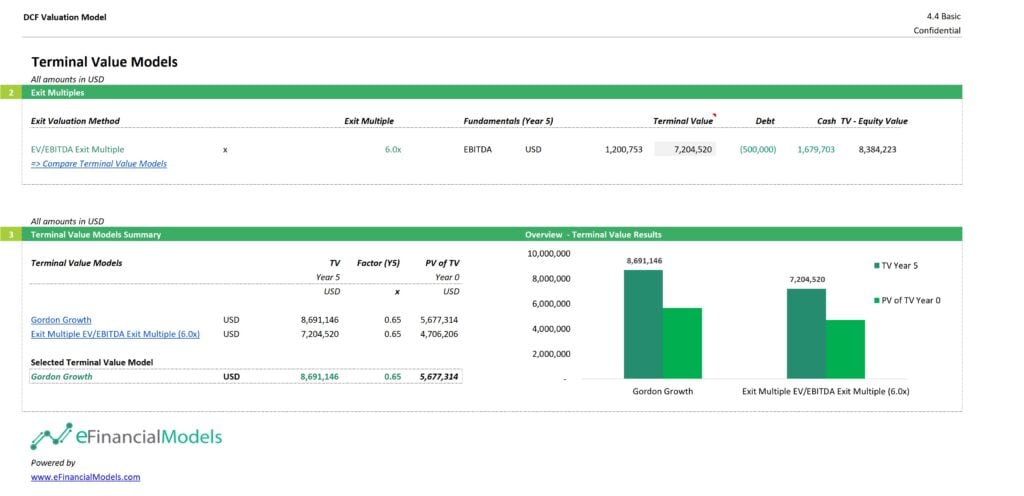
The above chart showcases how valuation multiples, like the EV/EBITDA Exit Multiple, influence business value in a Discounted Cash Flow (DCF) Valuation Model. The 6.0x exit multiple applied to EBITDA estimates a terminal value of $7.2M, which impacts the final equity value calculation. The Terminal Value Models Summary compares this method to the Gordon Growth Model, showing that different approaches yield varying valuations. Higher exit multiples lead to a higher terminal value, boosting the company’s perceived worth. This highlights why investors focus on multiples when assessing a business’s future value.
Maximizing Business Value: Scenario Analysis in Action
Boosting business value starts with optimizing key financial drivers. Increase sales volume and pricing power to grow revenue. Strengthen EBITDA margins by cutting costs and improving efficiency. Lower tax rates to retain more profits. Balance debt and equity for smart financing. Speed up receivables collection and inventory turnover to enhance cash flow. Shorten the cash conversion cycle for better liquidity. Maximize asset turnover to generate higher returns. Finally, a strong valuation multiple is secured to increase the overall worth. While each metric independently contributes to financial performance, they are interconnected and require a holistic approach. Focus on these drivers to build a financially strong and valuable business.
To effectively maximize business value, companies must go beyond static financial metrics and embrace scenario analysis as a proactive decision-making tool. Businesses can anticipate risks, identify growth opportunities, and optimize resource allocation by simulating various market conditions, economic shifts, and operational challenges. Financial scenarios help assess the impact of cash flow fluctuations, capital investment strategies, and profitability margins, while non-financial scenarios evaluate brand resilience, customer retention, workforce dynamics, and technological disruptions. A well-structured scenario analysis empowers businesses to make data-driven adjustments, strengthen both financial and non-financial value drivers, and create a resilient, high-value enterprise in any economic climate.
Unlock your business’s full potential—leverage scenario analysis in Excel to drive sustainable growth and maximize value today!
You might also like:
- 10 Main Elements of a Business Plan
- 10 Tips to Develop a First Class Business Valuation Report
- 10-Step Financial Planning Checklist for Smart Executives
- Business Valuation
- How to Value a Business Using a Discounted Cash Flow Model
- What Are the Main Drivers of Business Valuations?
- Financial Planning for Small Business Owners – Taking an SBA Loan
- Financial Modeling for Startups and Small Businesses
- Scenario Analysis
- 10 Ideas to Increase Average Revenue Per User
- Real Estate
- Financial Model Templates Easy to Use
- Developing a 5 Year Financial Projection Template
- Financial Ratios Analysis and Its Importance
- Calculating Revenue Growth Rate: A Key Metric for Business Success
- Understanding What is Yield to Maturity and Why It Matters
- Investment
- 10 Key Financial Value Drivers in Business
- Simple Budget Planner Template
- Financial Feasibility Study