
0 ITEMS

Townhomes Development Real Estate Financial Model Excel Template
The Townhome Development Financial Model Template helps developers, founders, consultants, analysts, and real estate entrepreneurs evaluate a townhome community before committing major capital. It gives users a structured way to forecast development costs, unit sales, funding needs, operating expenses, payroll, cash flow, profitability, and long-term returns in one editable model. Instead of building a real estate pro forma from scratch, buyers can start with a ready-to-use framework designed around the realities of land acquisition, construction timelines, sales absorption, lender review, and investor decision-making. This template is especially useful for preparing business plans, funding documents, lender packages, investor presentations, internal feasibility studies, or expansion plans for multiple townhome projects. It allows users to document revenue assumptions, estimate pricing and sales timing, plan startup costs, build operating budgets, and review how cash moves through the development cycle. Because townhome projects often require significant upfront investment before sales proceeds arrive, the model helps users understand capital requirements, liquidity pressure, construction draw timing, and the point at which the project can begin generating positive returns. The Townhome Development Financial Model is built to support practical financial planning and clear decision-making. Users can adjust assumptions such as unit pricing, construction cost, project timing, sales velocity, financing terms, overhead, marketing spend, payroll, and other key cost drivers. The template then connects those inputs to projected financial statements, cash flow, profitability metrics, break-even analysis, return measures, and visual summaries. This helps users test whether the development can support its cost structure, satisfy lender expectations, and deliver acceptable returns under realistic conditions. Designed for both Excel and Google Sheets, the template is fully customizable and suitable for non-financial users as well as experienced analysts. It provides a professional format for organizing assumptions, reviewing scenarios, comparing outcomes, and presenting financial projections with confidence. Whether you are evaluating your first townhome development, modeling a pipeline of communities, or preparing materials for a bank, partner, or investor, this template helps turn a complex development concept into a clear, editable financial forecast.
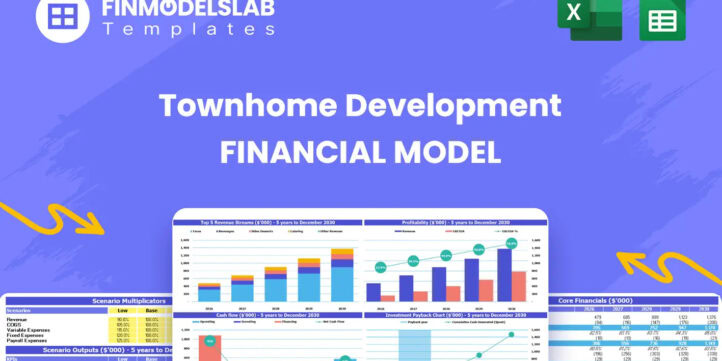


Financial Model Overview
The Townhome Development Financial Model Template is a ready-to-use planning tool for evaluating the financial feasibility of a townhome development business or project pipeline. It is designed for real estate developers, entrepreneurs, consultants, analysts, lenders, and investors who need to understand how land acquisition, construction spending, sales timing, financing, operating expenses, payroll, and profitability interact over a multi-year development cycle. Townhome development can be highly capital intensive, with large cash outflows occurring before unit sales begin, so a structured model is essential for planning funding needs, managing liquidity, and presenting a credible financial case.
This template brings the key assumptions and outputs together in an editable Excel and Google Sheets format, helping users forecast up to five years of performance, test different market conditions, and prepare lender-ready or investor-ready financial projections without starting from a blank spreadsheet.
All-in-One Dashboard
The all-in-one dashboard gives users a central view of the most important inputs and outputs in the Townhome Development Financial Model. It is designed to make the model easier to navigate by bringing together core assumptions, major financial results, and high-level performance indicators in one place. Users can review or update key drivers such as project timing, unit sale assumptions, development costs, financing requirements, and operating expense expectations, then see how those assumptions affect the forecast.
The dashboard is useful because townhome development decisions often require quick comparisons between capital requirements, revenue timing, profitability, cash flow pressure, and investment returns. Instead of searching through multiple worksheets, users can use the dashboard to understand the overall financial story, identify areas that need refinement, and prepare for discussions with partners, lenders, or internal decision-makers. It also supports faster review of the business plan because stakeholders can see the relationship between the project plan and the projected financial outcomes at a glance.
Low, Base, and High Scenario Analysis
The Low, Base, and High scenario analysis section helps users evaluate how the development may perform under different market and execution conditions. This component is especially valuable for townhome projects because small changes in sales price, construction cost, absorption rate, financing cost, or project timing can have a significant effect on cash flow, break-even timing, and investor returns. Users can create a conservative case, a most likely case, and an upside case by adjusting key assumptions such as average sale price per unit, number of units sold per period, land and construction costs, interest rates, contingency allowances, or sales velocity.
The model then helps show how those changes affect revenue, profitability, funding requirements, IRR, ROE, and cash balance over time. This is useful for risk management, funding preparation, and decision-making because it prevents users from relying on a single forecast. A lender or investor will often want to know what happens if costs rise, sales are delayed, or prices soften, and this section gives users a structured way to answer those questions with clear financial outputs.
Professional Charts
The professional charts section turns financial projections into visual reports that are easier to review, explain, and present. Townhome development models can include a large amount of detailed information, including monthly cash flows, cost categories, unit sales timing, debt activity, profitability trends, and return metrics. Charts help convert those detailed calculations into a more understandable format for business plans, lender meetings, investor decks, internal reviews, and stakeholder updates.
This component may visualize revenue growth, expense trends, EBITDA movement, cash balance, development spending, project returns, and other key metrics over the forecast period. The benefit is that users can quickly communicate where the business is in the development cycle, when major cash outflows occur, when revenue begins, and how profitability improves as completed units are sold. Professional visuals are also useful for spotting problems, such as a cash trough that requires additional financing or an expense category that grows faster than expected. By combining detailed spreadsheet logic with presentation-ready charts, the template helps users make the forecast more persuasive and easier to understand.
ROE Components and DuPont Analysis
The ROE components and DuPont analysis section helps users understand the drivers behind return on equity rather than only viewing the final percentage. For a townhome development project, return on equity can be influenced by profit margins, asset efficiency, leverage, financing structure, cost control, and sales timing. This component breaks the return profile into more understandable parts so users can see whether returns are being driven by operating profitability, efficient use of capital, or the level of debt and equity used to fund the project.
Inputs may include net income, revenue, total assets, equity investment, debt usage, margin assumptions, and project performance over time. The outputs help users evaluate whether a low or high ROE is caused by pricing, costs, capital intensity, leverage, or slow sales absorption. This is useful for developers and investors because it supports more informed decision-making about whether to improve sales pricing, reduce construction costs, negotiate better financing, adjust the project size, or reconsider the equity contribution. It also gives stakeholders a more sophisticated view of the investment case, which can strengthen conversations with partners and capital providers.
Revenue Inputs
The revenue inputs section allows users to define the commercial assumptions that drive sales projections for the townhome development. Because revenue in this type of model is typically generated through the sale of completed townhome units, users need a clear way to enter assumptions such as number of units, average sale price, project start dates, construction completion dates, sales absorption timing, closing schedules, and the sequencing of multiple communities.
This component may also allow users to adjust assumptions for different developments, such as separate communities with different timelines, budgets, or pricing strategies. The outputs generated from these inputs flow into revenue forecasts, cash flow projections, profitability calculations, and return metrics. This section is useful because it connects the development plan directly to financial performance. If units sell later than expected, revenue is delayed and financing needs may increase. If sale prices improve, margins and returns may rise. By giving users a dedicated place to model revenue assumptions, the template helps create a defensible forecast that can be explained to lenders, investors, brokers, and internal planning teams.
Bank-Ready Reports
The bank-ready reports section is designed to present the financial model in a format that supports lender review and funding discussions. Lenders evaluating a townhome development will typically want to understand project costs, sales assumptions, debt requirements, cash flow timing, repayment capacity, profitability, and the overall feasibility of the plan. This component helps organize the model’s outputs into clear financial reports, including summaries that may cover profit and loss, cash flow, balance sheet projections, key assumptions, debt activity, and investment performance.
The value of this section is that it reduces the time needed to reformat information for external review and helps users answer lender questions more efficiently. It can support loan applications, construction financing discussions, refinancing conversations, or partner presentations by showing how the project is expected to use capital and generate proceeds from unit sales. Clean, lender-friendly outputs also help improve credibility because assumptions are documented, calculations are organized, and the financial story is easier to follow.
Revenue Breakdown
The revenue breakdown section provides a more detailed view of how projected revenue is generated across the townhome development portfolio. Rather than showing only total sales, this component helps users analyze revenue by project, community, unit group, phase, time period, or revenue stream. For a developer managing several townhome communities, this is important because each project may have a different acquisition date, construction schedule, sales launch, closing timeline, unit count, and average sale price.
Users can review which developments contribute the most revenue, when cash proceeds are expected to arrive, and how the timing of completed unit sales affects the broader financial forecast. The outputs from this section can support monthly and annual sales projections, cash flow planning, profitability analysis, and performance review against the business plan. It is useful for decision-making because it helps users identify whether the forecast depends too heavily on one project, whether a delayed community could create a funding gap, or whether future developments should be reprioritized. A detailed revenue breakdown also makes the financial model more transparent for investors and lenders who want to understand the source and timing of projected income.
KPI Dashboard
The KPI dashboard summarizes the most important performance metrics used to evaluate the townhome development forecast. This section may include metrics such as revenue, EBITDA, gross margin, net profit, cash balance, IRR, ROE, payback period, break-even timing, development cost per unit, sales absorption, debt levels, and other financial ratios relevant to real estate development. Users can compare these indicators against internal targets, lender expectations, or industry benchmarks to determine whether the plan is realistic and financially attractive.
The KPI dashboard is useful because it condenses a complex development model into a set of actionable measurements. Developers can use it to monitor whether the business is moving toward profitability, whether cash flow risk is increasing, and whether investment returns justify the capital required. Consultants and analysts can use it to explain performance to clients, while founders and business owners can use it to support strategy meetings or funding presentations. By making the most important metrics easy to review, this section supports faster decisions and better communication with stakeholders.
Development Cost, Startup Cost, and Operating Expense Budget
The development cost, startup cost, and operating expense budget section helps users estimate both the initial setup needs of the business and the ongoing costs required to execute the townhome development plan.
Townhome projects require more than land and construction spending, so this section can organize assumptions for company setup, office equipment, development software, surveying tools, professional fees, permitting, legal support, engineering, marketing, payroll, insurance, rent, utilities, administrative expenses, and other overhead. It may also separate project-specific costs, such as land acquisition and vertical construction, from corporate costs that support the overall development company. The outputs help users understand total capital requirements, monthly expense levels, cost timing, and how spending affects cash flow before unit sales begin.
This section is useful for budgeting and funding because it reduces the risk of underestimating the capital needed to launch and operate the business through the development cycle. It also helps users evaluate whether their expense structure is sustainable, where cost reductions may be possible, and how changes in payroll, overhead, or construction budgets affect profitability and break-even timing.
Cash Flow, Debt Draw, and Break-Even Planning
The cash flow, debt draw, and break-even planning section helps users understand how money moves through the townhome development project from launch through construction, sales, repayment, and profitability. This component is especially important because development projects often experience large negative cash balances before completed units are sold. Users can model inflows from equity contributions, construction loans, credit facilities, and unit sale proceeds, along with outflows for land, construction, payroll, operating expenses, financing costs, taxes, and other obligations.
The section can also help estimate when debt draws may be needed, when sales proceeds may become available, and when cumulative revenue can cover accumulated costs. Break-even analysis is useful because it identifies the point at which the development begins to recover its investment and move toward sustainable profitability.
For lenders, this information helps assess repayment risk and liquidity needs. For developers and investors, it supports decisions about how much funding to raise, how much contingency to hold, whether to phase construction, and how changes in sales timing or cost overruns could affect the project’s ability to remain solvent. This component turns the forecast into a practical cash management tool for planning, budgeting, and funding decisions.
File types:
Excel – Single-User: .xlsx
Excel – Multi-User: .xlsx
Similar ProductsOther customers were also interested in...


 HenrySheykin
Multi Family Development REIT Financial Model Exce...
The Multi-Family Development Financial Model helps developers, real estate entrepreneurs, consultant... Read more

Apartments Development REFM Financial Model Excel ...
The Apartment Development Financial Model Template helps real estate developers, entrepreneurs, busi... Read more
Condominium Development REFM Financial Model Excel...
The Condo Development Financial Model helps developers, investors, analysts, consultants, and busine... Read more
Residential Development REIT Financial Model Excel...
The Residential Development Financial Model helps users evaluate the financial feasibility of a resi... Read more
Single Family Development REFM Financial Model Exc...
The Residential Development Financial Model helps users evaluate the financial feasibility of a resi... Read more
Condo Hotel Financial Model Excel Template
The Condo Hotel Financial Model helps users turn a condo hotel concept, launch plan, or investment o... Read more

 Giorgos
Senior Living Development – 10 Year Financial Mo...
Senior living apartments are just that – apartments (townhouses and condos may also fall in this c... Read more
 JILL LIU
Real Estate Acquisition-Rent-Sell Comprehensive An...
An integrated, dynamic and ready-to-use Real Estate Acquisition-Rent-Sell Comprehensive Analysis Mod... Read more

 Jason Varner
Real Estate Financial Model Bundle
This is a collection of financial model templates that provides the financial projections and valuat... Read more
You must log in to submit a review.