
0 ITEMS

Condominium Development REFM Financial Model Excel Template
The Condo Development Financial Model helps developers, investors, analysts, consultants, and business planners evaluate the financial feasibility of a condominium development project before committing major capital. Instead of relying on a generic real estate spreadsheet, this template is structured around the way condo projects actually operate, including unit sales, development timelines, acquisition costs, construction spending, closing revenue, financing needs, and project-level profitability. It gives users a practical framework for turning assumptions into a clear financial forecast that can support planning, funding discussions, and internal decision-making. This financial model template is useful for entrepreneurs entering real estate development, existing property developers reviewing new sites, consultants preparing client feasibility studies, and founders building investor or lender materials. Users can customize revenue assumptions, startup costs, operating expenses, payroll, construction budgets, project timelines, and financing structures to reflect a specific condo development strategy. The model is designed to help users understand how large upfront costs, delayed revenue recognition, presales, construction draws, and sales velocity affect cash flow and profitability over time. The template supports detailed financial planning by connecting revenue assumptions with project costs, operating expenses, capital requirements, and expected returns. It helps users evaluate whether the development can generate enough proceeds from condo unit sales or full-building dispositions to cover acquisition, construction, selling costs, overhead, and financing obligations. By organizing these inputs in one ready-to-use model, it makes it easier to compare scenarios, review cash flow gaps, test profitability, and identify the assumptions that have the greatest impact on project outcomes. Built for professional use, the Condo Development Financial Model includes investor-ready formatting, editable assumptions, visual outputs, and lender-friendly reports that can be used in business plans, funding documents, feasibility studies, and stakeholder presentations. It helps users estimate break-even timing, review profitability, assess funding needs, and make more informed decisions before moving forward with a condo project. Whether planning a single building or a portfolio of developments, the template provides a structured starting point for analyzing financial viability with greater clarity and confidence.
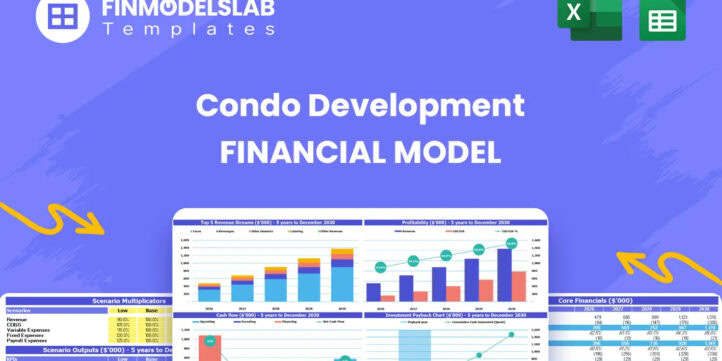


Financial Model Overview
The Condo Development Financial Model is a ready-to-use financial model template created for condominium development projects where timing, capital intensity, construction costs, financing, and sales velocity determine the success of the investment. Unlike a generic real estate spreadsheet, this model is built around the core mechanics of condo development, including project acquisition, construction draws, revenue from completed property sales, presales activity, operating overhead, financing needs, and investor returns. It helps developers, entrepreneurs, consultants, analysts, and business owners translate a development concept into structured financial projections that can be reviewed, edited, and presented.
Users can adjust assumptions for unit sales, project costs, payroll, operating expenses, financing, and development timelines to evaluate how the project may perform over a five-year horizon. The model is especially useful for preparing lender discussions, investor presentations, feasibility studies, business plans, and internal decision-making documents because it connects the full development lifecycle from initial setup and land acquisition through construction, closing revenue, cash flow recovery, profitability, and payback.
All-in-One Dashboard
The all-in-one dashboard provides a centralized view of the most important inputs and outputs in the Condo Development Financial Model, making it easier to understand the project without searching through disconnected worksheets. This section brings together core assumptions such as acquisition costs, construction budgets, project timing, sales values, operating expenses, financing requirements, and high-level return metrics in one practical summary. It helps users see how the overall condo development plan is performing by displaying key outputs such as revenue, costs, profitability, cash position, payback timing, and investor return measures.
For a capital-intensive development project, this type of dashboard is useful because stakeholders need a fast way to evaluate whether the project is on track, underfunded, over budget, or financially attractive. Entrepreneurs and developers can use it to review the model before making strategic decisions, while consultants and analysts can use it to communicate assumptions and conclusions clearly. The dashboard also supports lender and investor conversations by presenting the financial story of the development in an organized, professional format that can be updated as assumptions change.
Low, Base, and High Scenario Analysis
The Low, Base, and High scenario analysis section allows users to test how the condo development performs under different market and execution conditions. Because real estate development depends heavily on uncertain variables such as construction cost escalation, sales price per square foot, unit absorption, financing rates, entitlement timing, and closing schedules, a single forecast is rarely enough for responsible planning.
This component gives users a structured way to compare downside, expected, and upside cases by adjusting key assumptions and reviewing the resulting impact on revenue, margins, cash flow, capital needs, and return metrics. A low scenario may reflect slower sales, higher costs, delayed closings, or lower sale prices, while a high scenario may reflect stronger pricing, faster absorption, better financing, or improved cost control. The base scenario can represent the most realistic operating plan.
This feature is useful for investors, lenders, and management teams because it highlights the range of possible outcomes and identifies the assumptions that carry the most risk. It also supports better decision-making by helping users plan contingencies, evaluate project resilience, and avoid relying on overly optimistic projections.
Professional Charts
The professional charts component turns the financial projections into clear visual outputs that are easier to interpret and present. Condo development models can include large amounts of detail, from monthly construction spending and loan draws to revenue recognition, operating costs, cash balances, profitability, and investor returns.
Charts help simplify this information by showing trends, comparisons, and milestones visually. This section may include graphs for revenue growth, project cost timing, cash flow movement, cumulative profitability, funding requirements, EBITDA, debt balances, and return metrics. These visuals are especially valuable when presenting to stakeholders who need to understand the project quickly but may not want to review every formula or schedule in detail.
Developers can use the charts to monitor whether revenue is expected to arrive after major cash outflows, while lenders can use them to understand funding peaks and repayment timing. Consultants and analysts can include these outputs in feasibility reports, investment memoranda, or business plan presentations. By converting complex financial data into presentation-ready visuals, this component strengthens communication and helps decision-makers focus on the financial issues that matter most.
ROE Components and DuPont Analysis
The ROE components and DuPont analysis section helps users understand what is driving return on equity rather than simply viewing a final percentage. In condo development, equity returns can be influenced by profit margin, asset efficiency, financing structure, leverage, project timing, and the relationship between invested capital and sales proceeds. This component breaks down return on equity into underlying drivers so users can see whether returns are being created through strong development margins, efficient use of assets, appropriate leverage, or other performance factors.
Inputs may include net income, equity investment, total assets, revenue, financing assumptions, and cost structures, while outputs can include ROE, margin indicators, asset turnover measures, and leverage-related insights. This is useful for developers and investors because two projects with similar headline returns may carry very different risk profiles. A project that depends heavily on leverage may appear attractive but be more vulnerable to delays or cost overruns, while a project with healthier margins may be more resilient. By showing the components behind equity performance, the model helps users evaluate whether returns are sustainable, explain performance to capital partners, and refine the development strategy.
Revenue Inputs and Sales Assumptions
The revenue inputs and sales assumptions section is where users define the commercial logic behind the condo development forecast. Revenue in a condo project is driven by the sale of developed properties, which may include individual condominium units, phases of a building, or entire completed projects. This component allows users to organize assumptions such as unit mix, sales pricing, total sellable area, expected sale value, presale activity, absorption timing, closing schedules, and project-specific revenue milestones. For a portfolio of developments, users can model separate projects with different acquisition costs, construction budgets, timelines, and revenue potential.
The section is useful because revenue recognition in condo development is often delayed until units or buildings are completed and sold, creating a significant gap between spending and income. By structuring the revenue assumptions clearly, the model helps users understand when cash inflows are expected, how sales velocity affects liquidity, and whether the projected proceeds are sufficient to support the development plan. This section also supports market testing, allowing users to adjust pricing and absorption assumptions to reflect local demand, comparable sales, competitive projects, and investor expectations.
Bank-Ready Reports
The bank-ready reports section is designed to help users present the financial model in a format that lenders, financing partners, and professional stakeholders can review efficiently. Condo development financing often requires clear documentation of capital requirements, construction draw timing, project costs, revenue assumptions, repayment capacity, cash flow troughs, and expected exit proceeds. This component organizes financial outputs into lender-friendly summaries that can support loan discussions, underwriting reviews, and funding applications. It may include projected income statements, cash flow forecasts, balance sheet summaries, project cost schedules, debt assumptions, funding sources, and repayment views.
The value of this section is that it translates a complex development forecast into structured financial statements and reports that speak the language of banks and institutional capital providers. Developers can use these reports to demonstrate that they understand the timing of costs and cash inflows, while lenders can review whether the proposed financing structure is realistic. The reports also help identify potential funding gaps before they become operational issues, making it easier to adjust equity contributions, loan sizing, contingency reserves, or development phasing in advance.
Revenue Breakdown
The revenue breakdown section provides a more detailed view of how total revenue is generated across the condo development plan. Instead of showing only a single top-line revenue figure, this component separates revenue by project, phase, unit category, property sale, or other relevant revenue stream. For a multi-project condo development company, this can include separate views for each development and the timing of proceeds from each completed property. Inputs may include sale prices, unit counts, expected closing dates, percentage sold, building disposition values, and project-specific assumptions.
Outputs can show revenue contribution by property, revenue timing by period, cumulative sales proceeds, and the relationship between sales revenue and project costs. This section is important because total revenue may look strong in aggregate while being concentrated in only one project or delayed until late in the development timeline. A detailed breakdown helps users evaluate concentration risk, compare projects, plan cash flow, and communicate the source of returns to stakeholders. It also allows users to adjust specific projects without disrupting the entire model, making the financial forecast more flexible and useful for portfolio planning.
KPI Dashboard and Benchmark Metrics
The KPI dashboard and benchmark metrics section helps users evaluate condo development performance using the financial indicators that matter most to investors, lenders, and development teams. This component may track key performance indicators such as internal rate of return, return on equity, equity multiple, margin on cost, gross development value, total project cost, cash balance, payback period, debt requirements, and profitability margins. It can also compare selected outputs against industry benchmarks or target thresholds so users can assess whether the project is competitive, underperforming, or ready for further review.
For example, a developer may want to know whether the projected return compensates for entitlement risk and construction risk, while a lender may focus on repayment timing and capital coverage. By consolidating key metrics into one view, the KPI dashboard supports faster decision-making and helps users avoid getting lost in detailed schedules. It is also useful for investor presentations because it highlights the most important outcomes of the model in a clear and credible way. When assumptions are updated, the KPIs automatically reflect the revised economics, allowing users to see the effect of changes in costs, pricing, timing, and financing.
Startup and Project Cost Breakdown
The startup and project cost breakdown component helps users organize the capital required to launch and execute the condo development plan. Condo development requires multiple layers of investment, including corporate setup costs, land or property acquisition, hard construction costs, soft costs, professional fees, permits, design and engineering, marketing, brokerage, financing fees, contingencies, technology, office setup, payroll, and general administrative overhead.
This section separates startup and corporate costs from project-specific development costs so users can understand both the initial business funding requirement and the larger capital required for each property. Inputs may include acquisition prices, construction budgets, renovation or infrastructure costs, consultant fees, legal costs, insurance, software, office expenses, and working capital reserves. Outputs can include total startup investment, total project cost, monthly cost timing, cost categories, and funding requirements.
This component is useful because development projects often fail financially when early costs are underestimated or when cash needs are not matched to financing availability. A clear cost breakdown helps users budget more accurately, plan construction draws, negotiate financing, evaluate contingencies, and identify where cost control efforts may have the greatest impact on profitability.
Break-Even and Payback Analysis
The break-even and payback analysis component helps users understand when the condo development is expected to recover its accumulated costs and begin generating net financial value. In real estate development, cash flow can remain negative for a long period while acquisition, construction, soft costs, payroll, and financing expenses are incurred before sales revenue is realized. This section calculates the point at which cumulative revenue from completed unit or property sales is sufficient to cover accumulated development and operating costs.
It can also estimate months to payback, cumulative cash recovery, and the timing of investor capital return. Inputs may include project cost schedules, sales timing, closing revenue, operating expenses, financing costs, and equity contributions. Outputs may include a break-even month, cumulative profit position, payback period, and recovery timeline. This analysis is useful for developers, investors, and lenders because it identifies how long capital is at risk and when the project begins to support itself financially.
It also helps users test whether earlier presales, faster construction, reduced selling costs, improved pricing, or better financing terms could accelerate break-even. For funding documents and business plans, this component provides a clear milestone that demonstrates the financial viability of the condo development strategy.
File types:
Excel – Single-User: .xlsx
Excel – Multi-User: .xlsx
Similar ProductsOther customers were also interested in...







 anthony
The Realtors Quintessential ALL-IN-ONE Toolkit
Professional Realtors need a professional Toolkit which allows them to operate at a higher level. Th... Read more
 HenrySheykin
Condo Hotel Financial Model Excel Template
The Condo Hotel Financial Model helps users turn a condo hotel concept, launch plan, or investment o... Read more
 Jason Varner
Mixed-Use Real Estate Model: Leverage / JV Options
A general real estate model to plan all assumptions for up to 7 'uses' for a given property. Include... Read more
 Eastwich Advisors
Multifamily Rehab Model (Includes Investor Returns...
Introducing the Multifamily Rehab Flip Model with Investor Returns Waterfall - a comprehensive tool ... Read more
 Andreas
Construction / Development Financial Model
Development & Construction Model presents the case where a property with multiple residential un... Read more
 JILL LIU
Real Estate Acquisition-Rent-Sell Comprehensive An...
An integrated, dynamic and ready-to-use Real Estate Acquisition-Rent-Sell Comprehensive Analysis Mod... Read more
Acquisition Model for Commercial Property
This is the Quintessential Commercial Property Acquisition Model that allows you to compare up to 20... Read more
 Giorgos
Single Tenant Net Lease (NNN) – Investment &...
10-Year financial model for a Single Tenant Net Lease (NNN) Investment projecting rental income, ope... Read more
 David
David
Property Development & Rental Financial Projec...
3-Statement 5-year rolling projection model with a valuation for new or existing business developing... Read more
 eFinancialModels
Real Estate Financial Model Templates Package
This is a collection of ready-made Excel financial model templates for real estate businesses and it... Read more
You must log in to submit a review.