
0 ITEMS

Multi Family Development REIT Financial Model Excel Template
The Multi-Family Development Financial Model helps developers, real estate entrepreneurs, consultants, analysts, and founders turn a multi-property residential development plan into a structured financial forecast. Instead of relying on rough estimates, users can organize acquisition assumptions, construction budgets, rental income, ancillary revenue, startup costs, operating expenses, payroll, financing needs, and exit value in one editable model. It is designed for multi-family projects where capital is deployed before properties are stabilized, making cash flow timing, funding gaps, and long-term profitability especially important. Built for business planning, lender discussions, investor presentations, and internal decision-making, this financial model template gives users a practical way to evaluate whether a development project can support its cost structure and financing plan. The model helps forecast revenue assumptions across multiple properties, estimate ongoing expenses, track development costs, evaluate operating cash flow, and review profitability over a multi-year period. It is useful for preparing feasibility studies, underwriting apartment developments, comparing investment scenarios, and communicating the financial logic of a project to stakeholders. The template is fully editable, allowing users to adjust rents, lease-up timing, vacancy, construction costs, property acquisition costs, staffing plans, debt assumptions, equity contributions, operating expenses, and exit assumptions. It helps users understand how changes in rent growth, development timing, interest rates, cap rates, and cost overruns may affect cash flow, profitability, returns, and the break-even analysis. This makes it valuable for both early-stage planning and more advanced investment review, especially when decisions depend on the timing of capital draws and stabilized property performance. Rather than building a complex spreadsheet from scratch, buyers can start with a ready-to-use structure tailored to multi-family development. The model connects assumptions to financial statements, dashboards, charts, and lender-friendly outputs so users can quickly review project economics and prepare more credible funding documents. It supports clearer decision-making by showing where the project creates value, when cash needs may peak, when operations may break even, and how projected returns may change under different market conditions.


Financial Model Overview
The Multi-Family Development Financial Model is a ready-to-use financial model template designed to help users evaluate the economics of a residential development project from acquisition through construction, lease-up, stabilization, and exit. Multi-family development requires careful planning because cash is often invested long before properties generate stabilized rental income. This model brings the major assumptions together in one structured workbook so entrepreneurs, developers, real estate analysts, consultants, business owners, and funding teams can forecast revenue, development costs, operating expenses, payroll, cash flow, profitability, break-even timing, and investor returns. It is especially useful for preparing lender discussions, investor presentations, feasibility studies, internal underwriting files, and business plans because it connects detailed assumptions to financial outputs that stakeholders expect to review. Users can edit the inputs to reflect their own property portfolio, construction timeline, rental strategy, debt structure, equity plan, operating cost profile, and exit valuation, making the template practical for both early concept review and more developed project analysis.
All-in-One Dashboard
The all-in-one dashboard gives users a central view of the most important inputs and outputs in the Multi-Family Development Financial Model. It is designed to reduce the time spent searching through separate worksheets by placing key project assumptions, financial results, and performance indicators in one organized location. Users can review core inputs such as acquisition timing, development schedule, rental income assumptions, operating expense levels, financing structure, and exit assumptions, while also seeing outputs such as cash flow, profitability, funding requirements, return metrics, and major financial statement summaries. For a multi-family development project, this is valuable because the moving parts are connected: construction budgets affect funding needs, lease-up timing affects operating cash flow, and exit values affect investor returns. The dashboard helps users understand the overall financial picture quickly, identify areas that need attention, and communicate the project’s current forecast to partners, lenders, and decision-makers in a clear and practical format.
Low, Base, and High Scenario Analysis
The low, base, and high scenario analysis section helps users test how the project may perform under different market and execution conditions. A multi-family development forecast is highly sensitive to assumptions such as construction cost inflation, rent growth, vacancy rates, lease-up speed, interest rates, operating expenses, and exit capitalization rates. This component allows users to compare a conservative case, an expected case, and an upside case without rebuilding the model from scratch. Inputs may include lower or higher rental rates, slower or faster stabilization, increased or reduced construction budgets, different debt terms, and alternative exit valuation assumptions. Outputs can show how each scenario changes cash flow, peak funding needs, EBITDA, break-even timing, IRR, return on equity, and overall profitability. This is useful for planning and funding because lenders and investors often want to know not only what the expected forecast looks like, but also how the project responds when costs rise, leasing takes longer, or market pricing improves.
Professional Charts
The professional charts component turns complex financial projections into clear visual reports that are easier to understand and present. Multi-family development models can include many months of acquisition costs, construction spending, operating losses, debt draws, rental income growth, and exit proceeds, which can be difficult to interpret from raw spreadsheet rows alone. This section uses pre-built charts and graphs to display major trends such as revenue growth, expense behavior, cash balance movement, profitability trajectory, funding gaps, and return metrics over time. Inputs are drawn automatically from the model’s assumptions and linked financial statements, while outputs help users visualize how the project progresses from development stage to stabilized operations and eventual sale. These charts are useful for investor presentations, lender reviews, board updates, internal planning meetings, and business plan documents because they help stakeholders grasp the story behind the numbers. Instead of presenting only detailed tables, users can show where capital is being used, when revenue begins to build, and how the forecasted returns develop over the hold period.
ROE Components and DuPont Analysis
The ROE components and DuPont analysis section helps users understand what is driving return on equity rather than looking at a single return percentage in isolation. In a multi-family development project, return on equity can be influenced by net profitability, asset efficiency, leverage, construction cost control, rental performance, financing structure, and exit valuation. This component breaks the return profile into underlying drivers so users can see whether performance is being supported by stronger operating margins, more efficient use of assets, higher leverage, or changes in capital structure. Inputs may include net income, total assets, equity investment, debt balances, revenue, operating costs, and final sale proceeds. Outputs can help explain how the project’s ROE is built and where management action may improve results. This is useful for investment decision-making because two projects can show similar headline returns while having very different risk profiles. By reviewing ROE components, users can better understand whether the projected return is supported by healthy operations, reasonable leverage, disciplined development spending, or aggressive assumptions that may require further review.
Revenue Inputs
The revenue inputs section gives users a structured place to build the income side of the multi-family development forecast. Revenue assumptions may include monthly rental fees by property, unit mix, rent per unit, occupancy levels, lease-up timing, vacancy, concessions, rent growth, parking income, storage fees, application fees, service fees, and other ancillary income streams. Because multi-family projects often involve multiple properties acquired or developed at different times, this component helps users organize income assumptions property by property and period by period. The outputs feed into the revenue forecast, profit and loss statement, cash flow forecast, KPI dashboard, and return calculations. This section is useful because rental revenue is one of the most important drivers of project feasibility, debt service capacity, and exit value. By clearly documenting revenue assumptions, users can test whether the project can generate enough income to cover operating expenses, support financing, reach break-even, and create value at sale. It also helps users prepare a more credible case for lenders and investors by showing that income expectations are based on specific drivers rather than broad estimates.
Bank-Ready Reports
The bank-ready reports component organizes the model’s financial outputs into a format that supports lender review and funding conversations. Multi-family development lenders generally need more than a simple profit estimate; they want to understand the full capital plan, development budget, cash flow timing, operating performance, debt requirements, and repayment capacity. This component helps present key statements and schedules in a clear, lender-friendly way, including projected profit and loss, cash flow, balance sheet outputs, funding requirements, debt service assumptions, and major investment metrics. Inputs come from the broader model, including acquisition costs, construction budgets, rental assumptions, operating expenses, payroll, financing terms, and exit assumptions. Outputs are designed to help users explain when the project needs capital, how much funding may be required, when rental income begins supporting operations, and how the project may generate returns. This is useful for loan applications, refinancing discussions, investor updates, and capital planning because it gives stakeholders a structured view of the project’s financial viability and reduces the risk of presenting disconnected or incomplete numbers.
Revenue Breakdown
The revenue breakdown component provides a more detailed view of how total income is generated across the development project. Instead of showing only one combined revenue line, this section can separate income by property, revenue stream, month, year, or business driver. For a multi-family development, this may include rental income from each property, other tenant-related income, parking, storage, service charges, fees, and eventual proceeds from an asset sale at exit. Inputs may include each property’s expected opening date, stabilized occupancy, monthly rent levels, other income assumptions, annual growth rates, and planned disposition timing. Outputs help users see which properties or revenue streams contribute most to total income and when those contributions begin. This is useful for planning because development projects rarely become profitable evenly across all assets at the same time. A detailed revenue breakdown helps users identify reliance on specific properties, understand the timing of lease-up, review the importance of ancillary income, and explain the revenue model to investors or lenders with greater transparency.
KPI Dashboard
The KPI dashboard component highlights the performance metrics that matter most for multi-family development underwriting and ongoing project review. This section can track financial and investment indicators such as IRR, return on equity, equity multiple, cash-on-cash return, operating margin, net operating income, occupancy, revenue growth, expense ratios, cash balance, payback period, and funding requirements. Inputs are linked to the model’s assumptions and financial statements, allowing the dashboard to update as users adjust rents, construction costs, lease-up timing, operating expenses, financing terms, or exit values. Outputs provide a quick way to monitor whether the project is meeting target thresholds and whether the investment case remains attractive under the current assumptions. This is useful for decision-making because senior stakeholders often need a concise view of performance before reviewing the detailed schedules. The KPI dashboard also supports presentations by translating a complex development forecast into a set of measurable indicators that show the project’s financial health, risk profile, and return potential.
Startup and Development Cost Budget
The startup and development cost budget component helps users estimate the capital required before and during project execution. Multi-family development involves significant upfront spending, including land or property acquisition, due diligence, legal fees, permits, architectural and engineering work, hard construction costs, contractor payments, contingency reserves, vehicles, office setup, software, initial marketing, pre-opening payroll, and other capital expenditures. This section allows users to organize these costs by category and timing so the model can calculate total capital needs and the monthly draw profile. Outputs may include total development cost, cost per property, cost per unit, monthly spending schedule, cumulative investment, and the impact of development spending on cash flow and funding needs. This is useful because underestimating startup and development costs can create funding gaps that delay construction or weaken investor confidence. A detailed cost budget helps users negotiate financing, plan equity contributions, monitor budget discipline, and compare the financial impact of different construction scopes or acquisition strategies.
Break-Even Analysis
The break-even analysis component helps users identify when the project’s income becomes sufficient to cover its ongoing operating expenses and begin moving toward sustainable performance. In multi-family development, break-even may occur after a period of acquisition spending, construction outflows, lease-up losses, and early operating deficits. This section can use assumptions such as rental income, occupancy, ancillary income, property management costs, payroll, utilities, maintenance, insurance, taxes, corporate overhead, and other operating expenses to calculate the point at which monthly operations stop generating losses. Outputs may include break-even date, break-even revenue, required occupancy, margin of safety, and the effect of changes in rent, expenses, or lease-up speed. This is useful for planning and funding because stakeholders need to understand how long the project may require external capital before operations can support themselves. It also helps users evaluate tactical decisions, such as increasing pre-leasing efforts, reducing controllable expenses, adjusting rents, or revising the construction schedule to reach break-even sooner and improve the project’s cash position.
File types:
Excel – Single-User: .xlsx
Excel – Multi-User: .xlsx
Similar ProductsOther customers were also interested in...


 HenrySheykin
Apartments Development REFM Financial Model Excel ...
The Apartment Development Financial Model Template helps real estate developers, entrepreneurs, busi... Read more
Townhomes Development Real Estate Financial Model ...
The Townhome Development Financial Model Template helps developers, founders, consultants, analysts,... Read more
Condominium Development REFM Financial Model Excel...
The Condo Development Financial Model helps developers, investors, analysts, consultants, and busine... Read more
Residential Development REIT Financial Model Excel...
The Residential Development Financial Model helps users evaluate the financial feasibility of a resi... Read more
Single Family Development REFM Financial Model Exc...
The Residential Development Financial Model helps users evaluate the financial feasibility of a resi... Read more
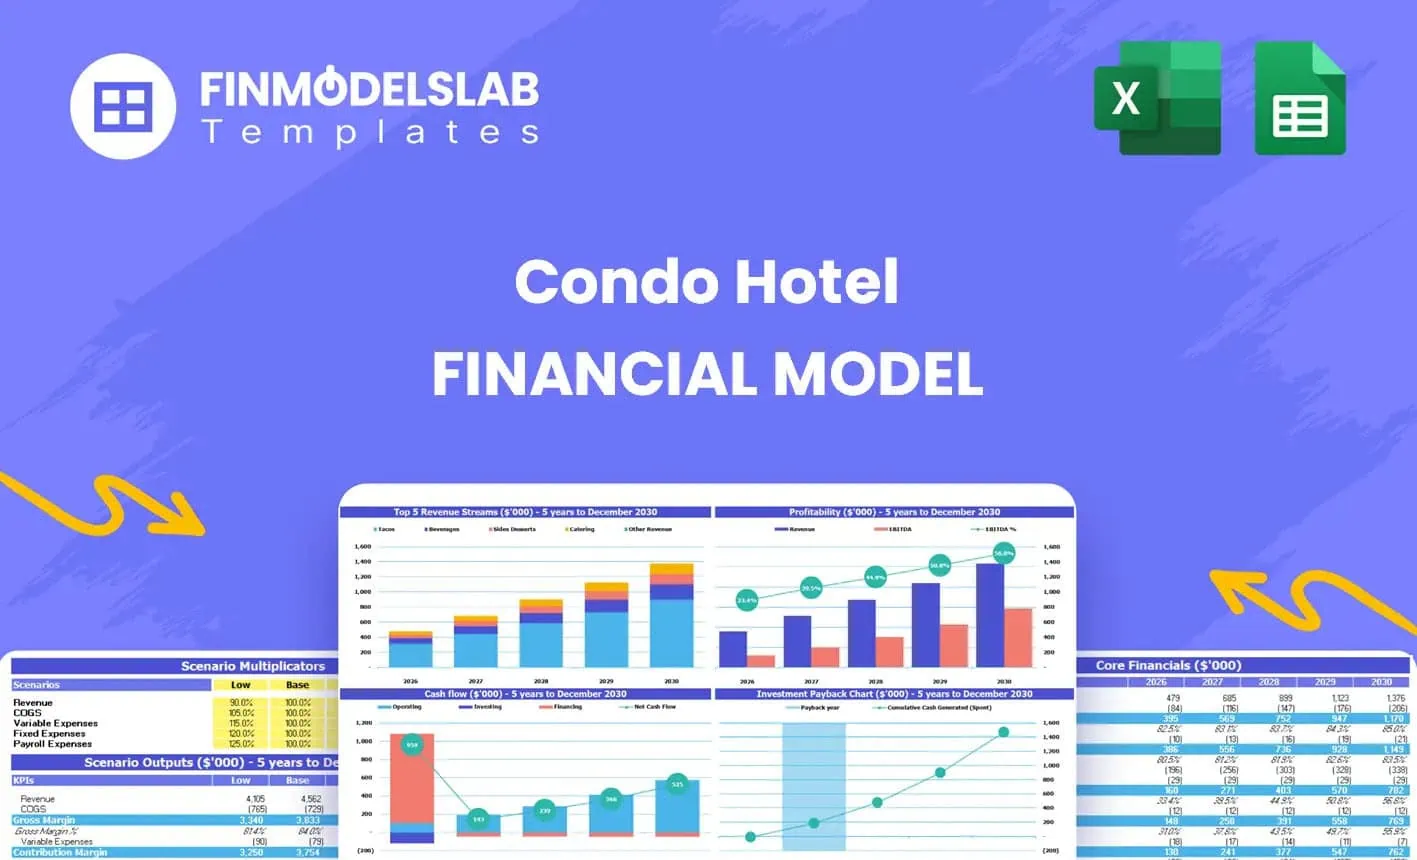
Condo Hotel Financial Model Excel Template
The Condo Hotel Financial Model helps users turn a condo hotel concept, launch plan, or investment o... Read more
 JILL LIU
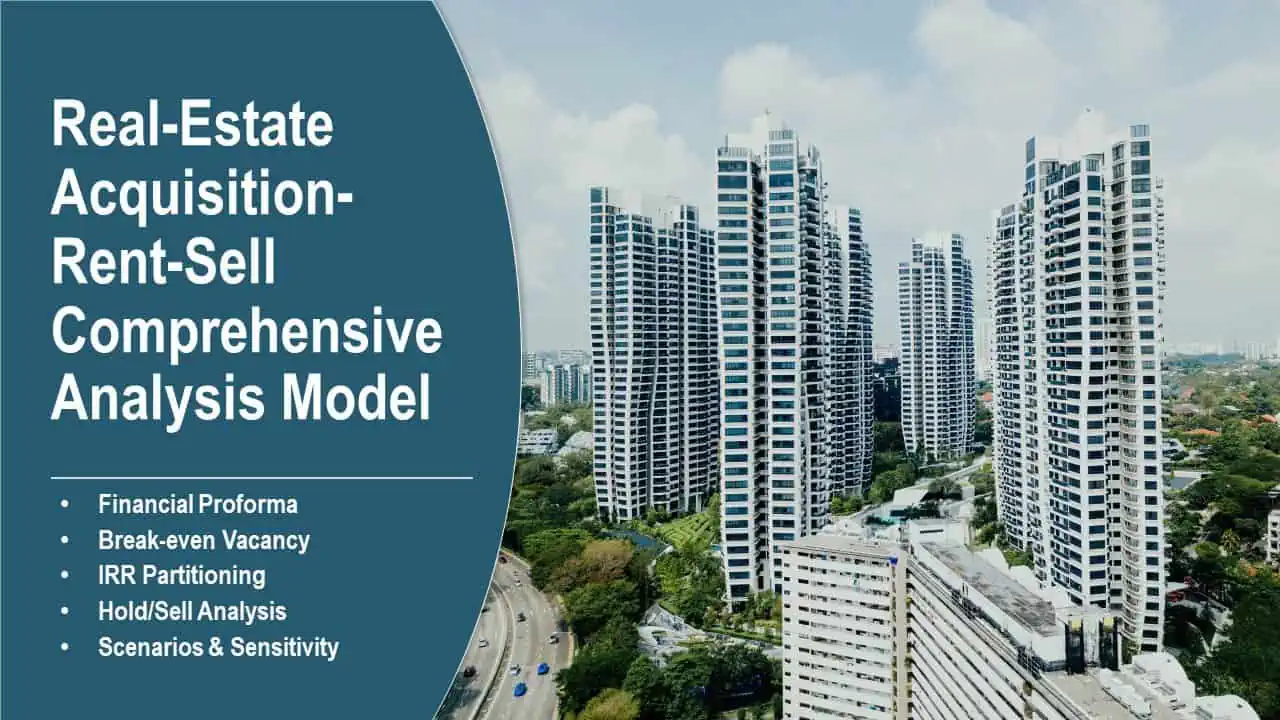
Real Estate Acquisition-Rent-Sell Comprehensive An...
An integrated, dynamic and ready-to-use Real Estate Acquisition-Rent-Sell Comprehensive Analysis Mod... Read more

 Eastwich Advisors
Multifamily Rehab Model (Includes Investor Returns...
Introducing the Multifamily Rehab Flip Model with Investor Returns Waterfall - a comprehensive tool ... Read more
 Giorgos
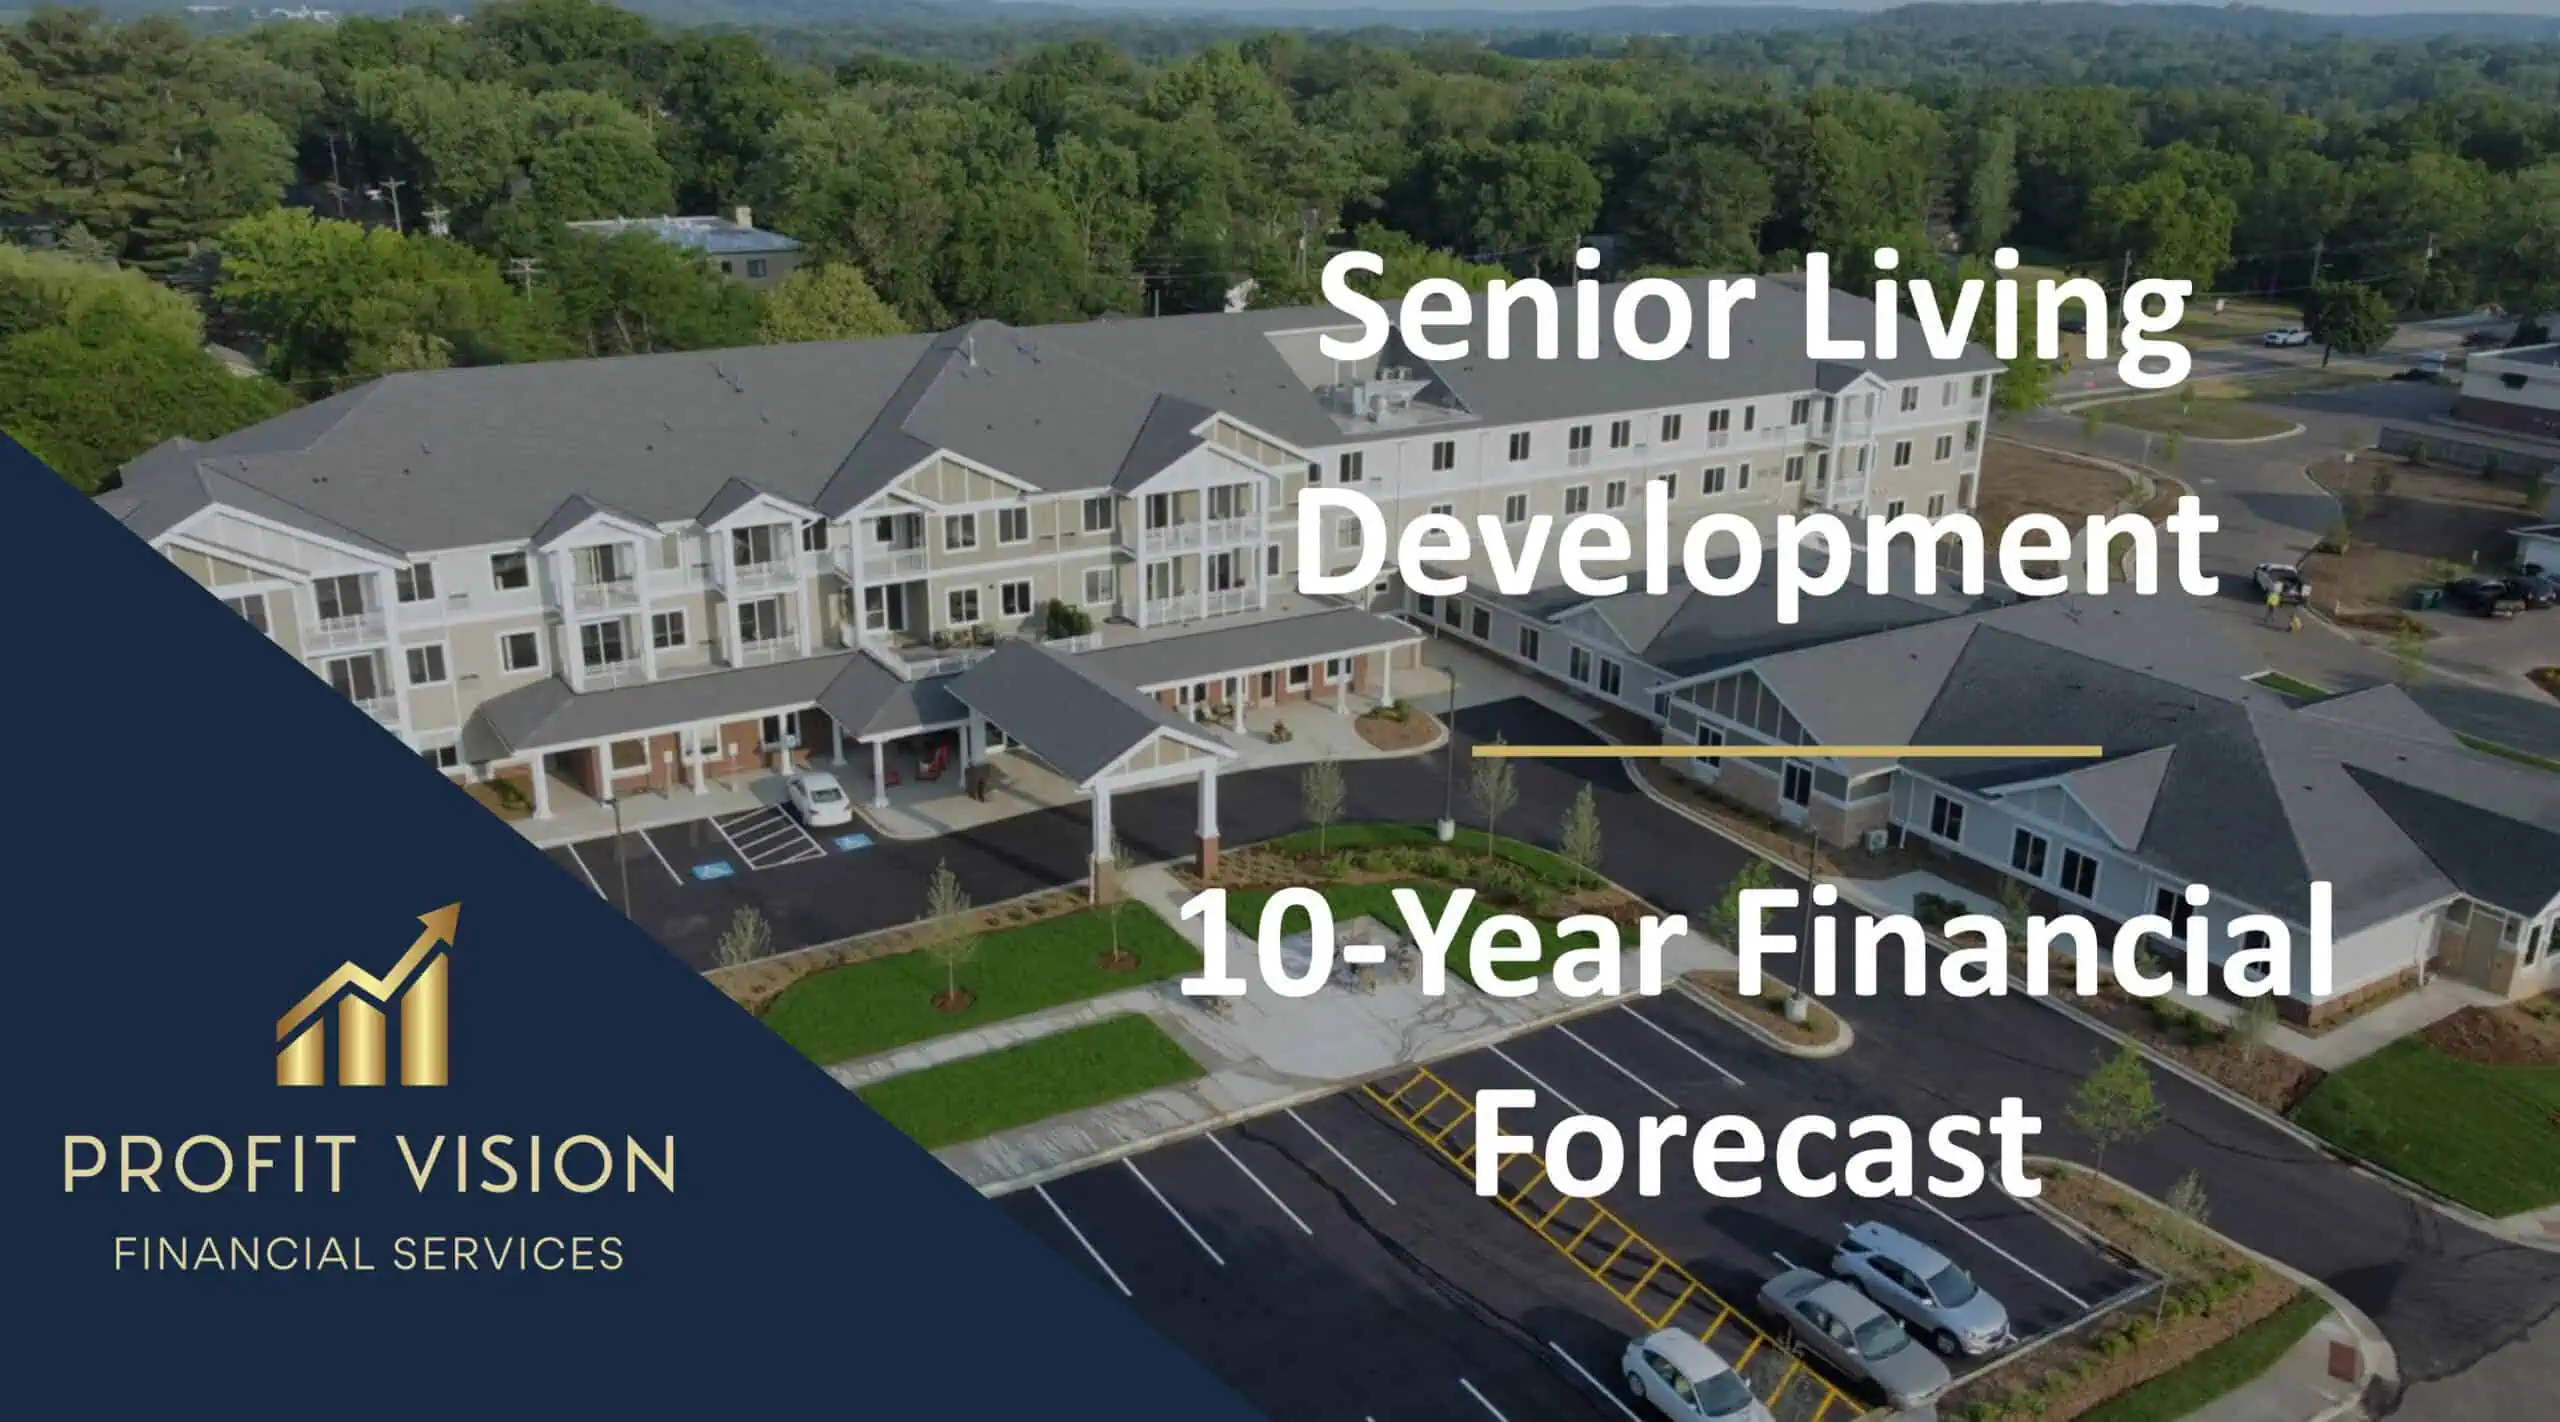
Senior Living Development – 10 Year Financial Mo...
Senior living apartments are just that – apartments (townhouses and condos may also fall in this c... Read more
You must log in to submit a review.