
0 ITEMS

Residential Development REIT Financial Model Excel Template
The Residential Development Financial Model helps users evaluate the financial feasibility of a residential real estate development project before committing capital, approaching lenders, or presenting to investors. Built around the realities of land acquisition, construction spending, project sales, financing needs, and long development timelines, this financial model template gives developers and planners a structured way to forecast revenue assumptions, startup costs, operating expenses, payroll, cash flow, profitability, and returns over a multi-year period. This template is designed for entrepreneurs, property developers, real estate investors, consultants, analysts, business owners, and founders preparing business plans, feasibility studies, lender submissions, or funding documents. Instead of building a residential development proforma from scratch, users can start with an editable model that organizes the major assumptions lenders and stakeholders expect to review, including sales timing, development costs, construction budgets, overhead, staffing, cash flow gaps, and investor return metrics. It supports practical financial planning by connecting project-level assumptions with business-level financial statements and decision-making outputs. The model is especially useful for understanding how residential development projects may perform under different market and execution conditions. Users can adjust property sale values, acquisition costs, construction timelines, sales velocity, financing assumptions, operating expenses, payroll, and other drivers to see how the plan affects cash needs, profitability, break-even analysis, and overall return potential. This helps identify funding gaps, evaluate whether project margins are strong enough, and test whether the business can remain solvent through the early cash burn period before property sales generate meaningful revenue. With its ready-to-use structure, customizable inputs, professional formatting, and presentation-friendly outputs, the Residential Development Financial Model Financial Model Template is built to support both internal planning and external communication. It helps users move beyond rough estimates by turning assumptions into organized projections, charts, reports, and performance metrics. Whether used for a single residential project, a portfolio of developments, a funding pitch, or ongoing budget review, the template provides a clearer financial roadmap for making informed real estate development decisions.


Financial Model Overview
The Residential Development Financial Model is a ready-to-use financial model template built for planning, evaluating, and presenting residential real estate development projects. It helps developers, founders, real estate investors, consultants, analysts, and business owners organize the financial logic behind a project, including acquisition costs, construction budgets, sale timing, operating expenses, payroll, cash flow, profitability, and investor returns.
Residential development is capital intensive, and many projects experience large cash outflows before the first property sales are completed. This model gives users a structured way to understand that timing, estimate funding needs, and present the economics of the project in a format that is easier for lenders, partners, and stakeholders to review. The template is fully editable, compatible with Excel and Google Sheets, and designed to save time by replacing blank-sheet modeling with a practical framework for project assumptions, projections, reports, and decision-making.
All-in-One Dashboard
The all-in-one dashboard brings the core inputs and core outputs of the Residential Development Financial Model into one organized view. This section is useful because residential development decisions depend on many connected assumptions, including property acquisition dates, construction budgets, sale dates, sales values, financing terms, operating expenses, and project timelines. Instead of searching through multiple sheets to understand the plan, users can review the most important project drivers and financial results in one place.
The dashboard may summarize revenue, total development costs, cash flow, EBITDA, profitability, funding gaps, return metrics, and key project milestones. For business planning and funding preparation, this gives users a quick way to explain the model’s logic and understand whether the project is financially viable. For ongoing decision-making, it also helps compare actual expectations against the forecast and identify which assumptions need closer review, such as a delayed sale date, higher construction spending, or a lower exit value.
Low Base High Scenario Analysis
The Low Base High scenario analysis section helps users test how the project performs under different market and execution conditions. Residential development projects are exposed to uncertainty from construction cost overruns, slower absorption, changing buyer demand, interest rate movements, permitting delays, and shifts in property sale values. This component allows users to compare a conservative case, expected case, and upside case by adjusting the assumptions that have the greatest impact on performance.
Inputs may include sales prices, construction costs, project durations, financing rates, sales commissions, operating overhead, and timing of cash inflows. The outputs help show how each scenario affects profitability, cash flow, funding needs, payback period, and investor returns. This is especially useful for lenders and investors because it demonstrates that the developer has considered downside risk rather than relying only on an optimistic forecast. It also supports better decision-making by showing which variables create the largest exposure and where contingency planning may be needed before capital is committed.
Professional Charts
The professional charts section converts the model’s financial projections into clear visual outputs that are useful for presentations, investment memos, lender discussions, and internal planning meetings. Residential development financials can be difficult to communicate when they are shown only as rows of numbers, especially because costs often occur long before revenue is realized. Charts help users explain the timing of construction spending, property sales, cash flow troughs, EBITDA movement, cumulative profit, funding requirements, and project milestones.
Inputs flow from the model’s assumptions and calculations, while the outputs are visual summaries that make the financial story easier to understand. This section can be used to show when cash burn is expected to peak, when sales begin to offset development costs, and how profitability develops over the forecast period. For investor-ready communication, professional charts make the model more polished and accessible, helping stakeholders quickly identify whether the project’s risk, timing, and return profile match their expectations.
ROE Components and DuPont Analysis
The ROE components and DuPont analysis section helps users understand what is driving return on equity rather than simply reporting a final return figure. In a residential development project, return on equity can be affected by project margins, asset utilization, leverage, timing of sales, cost control, and the amount of equity invested. This component breaks the return profile into more useful drivers so users can see whether performance is being created by strong project profitability, efficient use of capital, financing structure, or other factors.
Inputs may include net profit, revenue, total assets, equity investment, debt financing, construction costs, and sales proceeds. Outputs may include return on equity, margin indicators, leverage effects, and related performance ratios. This is valuable for investors and owners because it helps explain why the business generates a certain return and what can be improved. For example, if ROE is weak, the model can help identify whether the issue is low sales value, excessive construction cost, delayed exits, or inefficient capital structure.
Revenue Inputs
The revenue inputs section is where users define the main sales assumptions that drive the financial forecast. For residential development, revenue is typically generated from the sale of developed properties, such as single-family homes, townhomes, condominiums, multi-family buildings, or land parcels after entitlement. This component may allow users to enter multiple projects, each with its own acquisition timing, construction budget, development period, expected sale date, projected sale value, and optional revenue stream assumptions. These inputs are important because small changes in sale price, timing, or absorption can materially change profitability and cash flow.
The section helps users document the commercial logic behind the forecast and make the revenue assumptions transparent for lenders, investors, and internal reviewers. Outputs from this section feed into projected revenue, gross development value, monthly cash receipts, profit margins, and return metrics. It is useful for planning because it connects the project pipeline with the financial statements and helps users evaluate whether expected property sales are sufficient to cover development costs, overhead, financing, and equity return targets.
Bank-Ready Reports
The bank-ready reports section organizes the model’s financial outputs into a lender-friendly format that supports financing discussions and credit review. Lenders typically want to see build costs, sales timing, cash flow, funding gaps, debt requirements, repayment capacity, and the overall return profile of the development.
This component helps present those items in a structured way, reducing the need to manually rebuild financial statements or create separate summaries for every financing conversation. Inputs are pulled from the assumptions, revenue forecast, cost schedules, financing terms, and cash flow model. Outputs may include projected income statements, cash flow forecasts, balance sheet summaries, funding requirements, debt drawdowns, repayment schedules, and key ratios relevant to lenders.
For residential development businesses, this section is useful because it can show when capital is needed, how construction draws may align with spending, when sales proceeds are expected, and whether the project has enough liquidity to remain solvent. A clear reporting structure can improve communication with banks, private lenders, equity partners, and internal stakeholders.
Revenue Breakdown
The revenue breakdown section gives users a more detailed view of how total revenue is generated across the project or portfolio. While the revenue inputs section captures the assumptions, the revenue breakdown helps analyze the output by property type, project, unit category, development phase, or sales stream. This is useful when a residential developer is managing multiple projects at different scales, such as a smaller home development alongside a larger multi-family building, or when sales occur across several months rather than as one single exit.
Inputs may include unit counts, average sale prices, sale dates, project names, property categories, and expected closing schedules. Outputs may show revenue by stream, monthly revenue timing, annual revenue totals, and contribution from each development project. This component is helpful for decision-making because it shows which projects generate the most revenue, which sales are delayed, and how dependent the forecast is on a small number of exits. It also supports clearer investor presentations by explaining the composition of revenue rather than presenting only one total sales figure.
KPI Dashboard
The KPI dashboard focuses on performance metrics and benchmarks that help users assess the quality of the residential development plan. Unlike the all-in-one dashboard, which summarizes broad inputs and outputs, this section emphasizes measurable indicators that show whether the project is performing within an acceptable financial range. Key performance indicators may include gross development value, profit on cost, return on equity, equity multiple, project IRR, payback period, cash balance, EBITDA, debt service coverage, cost-to-complete, and margin metrics.
Inputs flow from the revenue forecast, development costs, financing assumptions, operating expenses, and financial statements. Outputs give users a concise set of metrics that can be monitored throughout planning, fundraising, and execution. This is useful for comparing the project against internal targets, investor hurdle rates, lender expectations, or industry benchmarks. For decision-making, the KPI dashboard helps users quickly see whether the project needs stronger pricing, lower costs, improved financing terms, a revised construction schedule, or a different exit strategy.
Development Cost and Startup Budget
The development cost and startup budget section helps users estimate the initial and ongoing investment required to launch the residential development business and execute the project pipeline. Residential development costs can include land acquisition, entitlement expenses, design and architectural fees, engineering, permits, legal work, insurance, contractor costs, general conditions, construction materials, sales and marketing costs, office setup, technology, company vehicles, and working capital. This component separates corporate startup needs from project-specific costs, which is important because a development company may need operating infrastructure before individual projects are fully financed.
Inputs may include acquisition prices, hard costs, soft costs, contingency percentages, payroll, overhead, deposits, equipment, and pre-opening expenses. Outputs help calculate total capital required, monthly spending, cost allocation by project, and the funding needed before property sales begin. This section is valuable for budgeting and funding because cost underestimation is one of the biggest risks in development. By organizing costs clearly, the model helps users plan capital calls, negotiate financing, manage cash burn, and understand whether the project has enough contingency to absorb overruns.
Break-Even Analysis
The break-even analysis section helps users identify when cumulative revenue is expected to cover accumulated development costs, operating expenses, financing costs, and other cash outflows. In residential development, break-even often occurs well after the project begins because land acquisition, design, permitting, payroll, overhead, and construction spending may happen months or years before the first meaningful sales proceeds arrive. This component uses the model’s revenue timing, cost schedules, and expense assumptions to estimate the point at which the project or business stops operating at a cumulative loss and begins generating positive economic value.
Inputs may include sale prices, closing dates, construction spending, operating expenses, payroll, commissions, financing costs, and overhead. Outputs may include break-even month, cumulative cash flow, required sales volume, margin threshold, and the impact of delays or cost overruns on break-even timing. This is useful for investors, lenders, and business owners because it provides a practical milestone for evaluating project viability. It also supports decision-making by showing whether faster sales, lower costs, phased construction, pre-sales, or revised pricing could improve the path to profitability.
File types:
Excel – Single-User: .xlsx
Excel – Multi-User: .xlsx
Similar ProductsOther customers were also interested in...


 HenrySheykin
Multi Family Development REIT Financial Model Exce...
The Multi-Family Development Financial Model helps developers, real estate entrepreneurs, consultant... Read more
Condominium Development REFM Financial Model Excel...
The Condo Development Financial Model helps developers, investors, analysts, consultants, and busine... Read more
Townhomes Development Real Estate Financial Model ...
The Townhome Development Financial Model Template helps developers, founders, consultants, analysts,... Read more
Single Family Development REFM Financial Model Exc...
The Residential Development Financial Model helps users evaluate the financial feasibility of a resi... Read more

Apartments Development REFM Financial Model Excel ...
The Apartment Development Financial Model Template helps real estate developers, entrepreneurs, busi... Read more
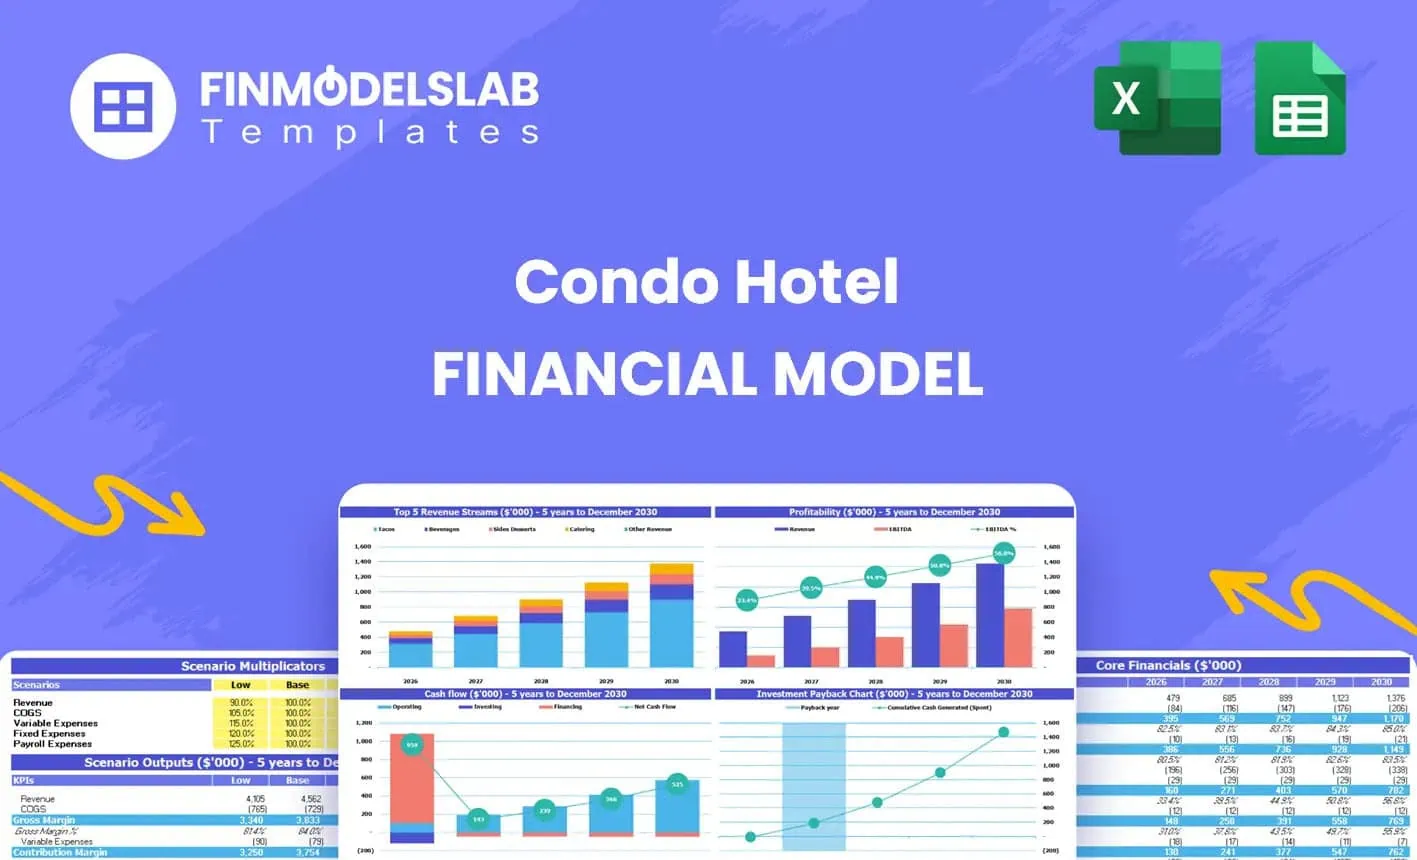
Condo Hotel Financial Model Excel Template
The Condo Hotel Financial Model helps users turn a condo hotel concept, launch plan, or investment o... Read more
 anthony
The Realtors Quintessential ALL-IN-ONE Toolkit
Professional Realtors need a professional Toolkit which allows them to operate at a higher level. Th... Read more

 Jason Varner
Mixed-Use Real Estate Model: Leverage / JV Options
A general real estate model to plan all assumptions for up to 7 'uses' for a given property. Include... Read more

 Giorgos
Residential Building Development Model (Sale, Rent...
Financial model presenting a development scenario for a Residential Building with units available fo... Read more
 JILL LIU
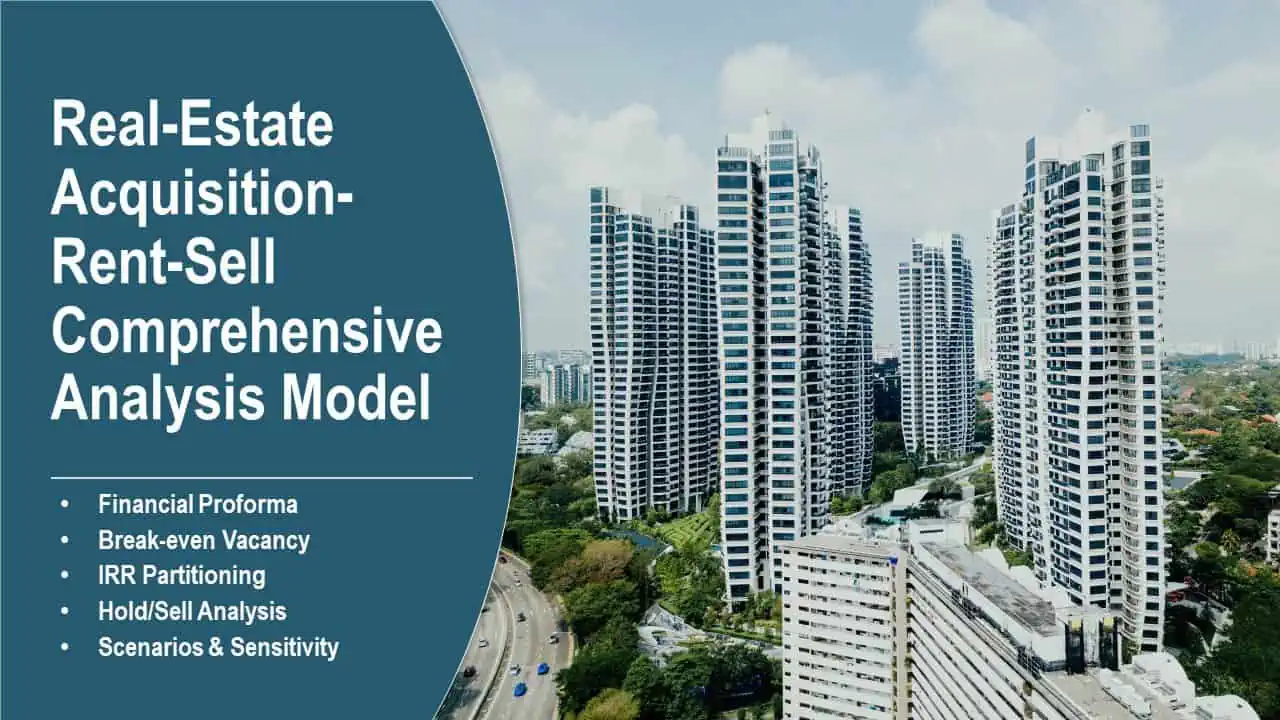
Real Estate Acquisition-Rent-Sell Comprehensive An...
An integrated, dynamic and ready-to-use Real Estate Acquisition-Rent-Sell Comprehensive Analysis Mod... Read more
You must log in to submit a review.