
0 ITEMS

Plant Nursery Financial Model Template
The Plant Nursery Financial Model helps entrepreneurs, nursery owners, consultants, analysts, and business planners turn a horticultural business idea into a structured financial forecast. Instead of trying to build a complex spreadsheet from scratch, users can work from a ready-to-use model designed around the real operating drivers of a plant nursery, including cultivated land area, crop categories, yield assumptions, plant pricing, yield losses, direct production costs, payroll, facilities, capital investment, and cash flow. It gives buyers a practical way to estimate how a nursery may perform before launch, during expansion, or when preparing funding documents. This template is especially useful for founders opening a greenhouse, plant nursery, garden center, wholesale growing operation, or plant farm that needs clear financial planning. Users can customize assumptions for revenue, startup costs, operating expenses, cost of goods sold, staffing levels, land acquisition, equipment, and growth over time. The model helps connect operational decisions, such as how much land to cultivate or which plant categories to prioritize, with financial outcomes like gross profit, EBITDA, cash balance, and return on investment. This makes it easier to test whether the business can support its cost structure and reach sustainable profitability. The Plant Nursery Financial Model also supports investor and lender communication by organizing the forecast into professional outputs. It includes structured views for assumptions, scenario planning, reports, charts, revenue detail, performance metrics, profitability, and break-even analysis. Buyers can use it to understand funding needs, review payroll and overhead requirements, evaluate capital expenditures, and prepare clearer business plans or pitch materials. The template is editable in Excel and Google Sheets, making it flexible for both early-stage planning and ongoing updates as the nursery grows. By using a purpose-built financial model template, users can make better decisions about pricing, crop mix, land use, hiring, investment timing, and growth strategy. The template helps reduce guesswork and gives business owners a clearer view of how revenue assumptions, operating expenses, cash flow, and profitability interact. Whether the goal is to secure financing, compare growth scenarios, manage internal budgets, or assess the viability of a plant nursery concept, this model provides a structured financial planning framework that saves time and supports more confident decision-making.


![Cash Flow Statement for ABC Company Inc. in Excel, showing 2026–2027 columns and highlighted net cash flow lines.]','Excel cash flow statement for ABC Company Inc., detailing operating, investing, and financing activities with blue highlights.'],](https://www.efinancialmodels.com/wp-content/uploads/edd/2026/06/plant-nursery-financial-model-cash-flow-financialmodelslab_130a5e03-3c8c-4bfe-ba07-4744d7836337-scaled.jpg "plant-nursery-financial-model-cash-flow-financialmodelslab_130a5e03-3c8c-4bfe-ba07-4744d7836337 | eFinancialModels")


Plant Nursery Financial Model Overview
The Plant Nursery Financial Model is a ready-to-use financial model template built for entrepreneurs, plant nursery owners, greenhouse operators, garden center founders, consultants, analysts, and business planners who need to forecast the financial performance of a nursery business. It brings together the core operating assumptions that drive this type of business, including cultivated land area, crop mix, yield per hectare, annual harvest cycles, yield loss, plant pricing, cost of goods sold, payroll, fixed overhead, capital expenditures, financing needs, cash flow, profitability, and investment returns. Instead of relying on disconnected estimates or building a spreadsheet from scratch, users can work from a structured model that translates nursery operations into investor-ready financial projections. The template is designed to support startup planning, expansion analysis, lender presentations, investor discussions, internal budgeting, and strategic decision-making. It is fully customizable, works in Excel and Google Sheets, and gives users a practical framework for testing assumptions, reviewing outputs, and understanding whether a plant nursery can reach sustainable profitability over time.
All-in-One Dashboard
The all-in-one dashboard gives users a central view of the most important inputs and outputs in the Plant Nursery Financial Model. This section is useful because plant nursery planning involves many connected assumptions, from land utilization and crop allocation to revenue, payroll, capital spending, margins, and cash flow. The dashboard helps users see the big picture without jumping between multiple worksheets or reports. Key assumptions can be summarized in one place, while major financial outputs such as total revenue, gross profit, EBITDA, net income, cash balance, and investment returns can be reviewed in a clear format. For a plant nursery, this matters because small operational changes can have a major financial impact. Adjusting yield assumptions, changing the mix of ornamental shrubs, trees, perennials, herbs, or bedding plants, increasing cultivated hectares, or modifying direct cultivation costs can quickly affect profit and cash flow. The dashboard helps founders, owners, and advisors understand the relationship between inputs and results, making it easier to review the plan, explain the model to stakeholders, and identify whether the business assumptions are realistic. It also supports fast decision-making by giving users a concise summary of the financial plan before they dive into the detailed schedules behind it.
Low, Base, and High Scenario Analysis
The low, base, and high scenario analysis component allows users to test how the plant nursery may perform under different planning conditions. A nursery business can be affected by many variables, including plant survival rates, weather conditions, growing cycle timing, wholesale demand, retail traffic, pricing pressure, labor availability, land costs, and input costs such as soil, containers, fertilizer, irrigation, and growing materials. This section helps users avoid relying on a single forecast by comparing conservative, expected, and optimistic outcomes. The low case may reflect slower sales growth, lower yields, higher yield loss, tighter margins, or delayed expansion. The base case can represent the most realistic business plan based on current assumptions. The high case can show the upside potential if sales ramp faster, pricing improves, land utilization increases, or operational efficiencies reduce production costs. Outputs may include revenue, gross profit, EBITDA, net income, cash flow, funding requirements, and return metrics across each scenario. This is especially useful for funding discussions because investors and lenders often want to know how resilient the business is if assumptions change. For internal decision-making, scenario analysis helps users evaluate whether the nursery can survive a weaker market, whether the growth plan is too aggressive, and what operational levers have the greatest impact on profitability.
Professional Charts
The professional charts component turns the financial forecast into visual outputs that are easier to interpret and present. Plant nursery financial planning can include detailed calculations across revenue streams, crop categories, expenses, cash flow, balance sheet items, investment returns, and key performance indicators. While the underlying numbers are important, stakeholders often need a clear visual summary to understand trends and make decisions quickly. The charts in the Plant Nursery Financial Model can be used to show revenue growth, profitability trends, cash flow movement, expense composition, gross margin development, EBITDA improvement, investment payback, or long-term growth in cultivated capacity. For example, a chart showing revenue growth by year can help demonstrate how the business scales as more land is cultivated or as additional plant categories are introduced. A profitability chart can show the transition from startup losses to positive EBITDA as fixed costs are absorbed by a larger revenue base. Cash flow visuals can help identify periods when the business may need financing, working capital, or more disciplined expense control. These presentation-ready charts are helpful for business plans, investor decks, loan applications, board reviews, and internal management meetings. They make the forecast more accessible, more professional, and easier to communicate to people who may not want to study every line of the spreadsheet.
ROE Components and DuPont Analysis
The ROE components and DuPont analysis section helps users evaluate how effectively the plant nursery generates returns on shareholder equity. Return on equity is especially important for investors, owners, and partners because it shows whether the capital committed to the business is producing attractive financial results. DuPont analysis breaks ROE into underlying drivers, typically connecting profitability, asset efficiency, and financial leverage. For a plant nursery, this can reveal whether returns are being driven by strong operating margins, efficient use of land and assets, or the structure of financing. The section may use inputs and outputs from the income statement, balance sheet, and debt schedule, including net profit, sales, total assets, equity, and leverage assumptions. This matters because nursery businesses often require meaningful upfront investment in land, greenhouse structures, irrigation systems, equipment, inventory, and working capital. A business may show strong revenue growth but still produce weak equity returns if assets are underutilized or margins are too low. Conversely, improving crop yields, reducing cost of goods sold, raising prices, or using land more efficiently can strengthen ROE over time. This component gives users a deeper investment appraisal view beyond basic profit and loss reporting. It helps founders and stakeholders understand the quality of the business model, the efficiency of capital use, and the factors that can improve long-term financial performance.
Revenue Inputs
The revenue inputs section is where users define the commercial assumptions that drive the plant nursery forecast. This component is central to the Plant Nursery Financial Model because revenue in a nursery is not just a simple sales estimate. It is shaped by cultivated land area, allocation by crop or plant category, yield per hectare, number of annual harvests or sales cycles, expected yield loss, available units for sale, and average selling price per unit. Users can adjust assumptions for categories such as ornamental shrubs, trees, perennials, flowers, herbs, or other nursery products depending on their business plan. The section may also include researched revenue assumptions as a starting point, giving users a practical baseline that can be edited to reflect local market conditions, growing methods, customer segments, wholesale versus retail pricing, and expected production capacity. The outputs from this section help generate revenue by crop category, total plant units available for sale, and annual sales projections. This is useful because it connects operational planning with financial results. A founder can see how changing land allocation from one plant category to another affects revenue potential, how yield loss reduces sellable units, and how pricing decisions impact total sales. For lenders and investors, detailed revenue inputs make the forecast more credible because they show the logic behind the sales projection rather than presenting a single unsupported revenue number.
Bank-Ready Reports
The bank-ready reports component organizes the model’s outputs into lender-friendly financial statements and summaries. When applying for financing, plant nursery owners often need to show more than a business idea. They need clear financial projections, startup cost details, cash flow forecasts, profitability expectations, loan repayment capacity, and assumptions that support the request. This section helps users prepare reports that are easier for banks, credit analysts, lenders, and funding partners to review. Outputs may include projected income statements, cash flow statements, balance sheets, debt repayment schedules, financing requirements, capital expenditure summaries, and key financial metrics. For a nursery business, these reports can be especially important because the upfront investment can be significant. Greenhouse construction, irrigation infrastructure, tractors, potting equipment, storage, land deposits, initial inventory, and working capital may all need to be funded before revenue reaches full capacity. The bank-ready format helps present these needs professionally and shows how the business is expected to generate enough cash to cover expenses and obligations. It also supports funding conversations by clearly separating assumptions, operating performance, and financing outcomes. Instead of giving lenders an unstructured spreadsheet, users can present a more polished financial package that demonstrates planning discipline, repayment logic, and a clearer path toward profitability.
Revenue Breakdown
The revenue breakdown section provides a detailed view of revenue streams so users can understand where nursery sales are coming from and which categories contribute most to growth. A plant nursery may generate income from multiple plant groups, sales channels, or customer types, such as wholesale buyers, landscapers, garden centers, retail consumers, contractors, or online plant sales. This component helps users break total revenue into a more useful structure instead of treating the business as one blended sales line. Inputs may include plant category allocation, units sold, price per unit, yield assumptions, product mix, harvest timing, seasonal demand, or sales channel percentages. Outputs can show revenue by crop, by category, by year, and potentially by sales channel, helping users identify the strongest and weakest parts of the plan. This is valuable for pricing strategy, inventory planning, capacity management, and marketing decisions. If ornamental shrubs generate high revenue but require more land or longer growing periods, the owner can compare that opportunity against faster-turning products. If trees produce strong margins but tie up working capital for longer periods, the model can help highlight that tradeoff. The revenue breakdown also improves investor and lender communication because it shows the building blocks of the forecast. Users can explain not just how much revenue the nursery expects to generate, but what drives that revenue and how the sales mix may evolve over time.
KPI Dashboard
The KPI dashboard tracks key performance indicators that help users evaluate whether the plant nursery is operating according to plan. Financial statements show results, but KPIs help explain performance and reveal whether the business model is healthy. For a plant nursery, important KPIs may include revenue growth, gross margin, EBITDA margin, net margin, cash balance, cultivated hectares, yield per hectare, yield loss percentage, revenue per hectare, payroll as a percentage of revenue, cost of goods sold as a percentage of revenue, return on equity, payback period, and other benchmark metrics. This section may compare projected performance against expected targets or industry-style benchmarks, giving users a clearer view of whether assumptions are realistic and whether the business is improving over time. The KPI dashboard is useful for founders and managers because it turns the model into an ongoing decision-making tool rather than a one-time funding document. If margins decline, users can look at pricing, material costs, labor efficiency, or product mix. If revenue per hectare is below target, they can review land allocation, yield assumptions, or sales strategy. If payroll grows faster than revenue, they can revisit hiring plans. For consultants and analysts, the KPI dashboard provides a concise way to evaluate performance drivers and communicate findings to clients or stakeholders. It helps users monitor the nursery’s financial health and make practical adjustments before small issues become larger financial problems.
Startup Cost and Capital Expenditure Planning
The startup cost and capital expenditure planning section helps users estimate the investment required to launch or expand a plant nursery. This component is essential because nursery businesses often require significant cash outlays before sales reach their full potential. Inputs may include greenhouse construction, shade structures, irrigation systems, nursery benches, tractors, carts, potting machines, storage areas, land purchases, lease deposits, site preparation, licenses, initial marketing, inventory, growing materials, technology, and working capital reserves. The section can separate one-time startup costs from recurring operating expenses, allowing users to understand how much capital is needed before the nursery can operate effectively. It can also support phased growth planning by showing when additional equipment, land, or infrastructure may be required as cultivated hectares increase. Outputs may include total startup investment, capital expenditure by category, timing of cash outflows, depreciation assumptions, and the impact of these investments on the balance sheet and cash flow forecast. This is useful for business planning and funding because it helps users avoid underestimating the true cost of getting started. It also allows entrepreneurs to compare different launch strategies, such as leasing land at first, purchasing land gradually, delaying certain equipment purchases, or scaling greenhouse capacity in phases.
File types:
Excel – Single-User: .xlsx
Excel – Multi-User: .xlsx
Similar ProductsOther customers were also interested in...


 HenrySheykin
Cattle Farming Financial Model Excel Template
The Cattle Farming Financial Model helps users turn a cattle farm concept, expansion plan, or fundin... Read more
Hydroponics Financial Model Excel Template
The Hydroponic Farming Financial Model helps entrepreneurs, growers, consultants, analysts, and busi... Read more
Hemp Farming Financial Model Excel Template
The Hemp Farming Financial Model Template helps entrepreneurs, farm owners, consultants, analysts, a... Read more

Dairy Farming Financial Model Excel Template
Purchase Dairy Farming Financial Projection. Sources & Uses, Profit & Loss, Cash Flow statem... Read more
Aquaponics Financial Model Excel Template
The Commercial Aquaponics Financial Model helps users turn a capital-intensive aquaponics concept in... Read more
Sheep Farming Financial Model Excel Template
The Sheep Farming Financial Model helps entrepreneurs, farm owners, consultants, analysts, and busin... Read more
Garden Nursery Financial Model Excel Template
The Garden Nursery Financial Model helps entrepreneurs, nursery owners, consultants, analysts, and b... Read more
Horse Boarding Financial Model Excel Template
The Horse Boarding Financial Model helps turn a stable, equestrian center, or horse boarding concept... Read more
Garlic Farming Financial Model Excel Template
The Garlic Farming Financial Model helps entrepreneurs, growers, consultants, analysts, and business... Read more
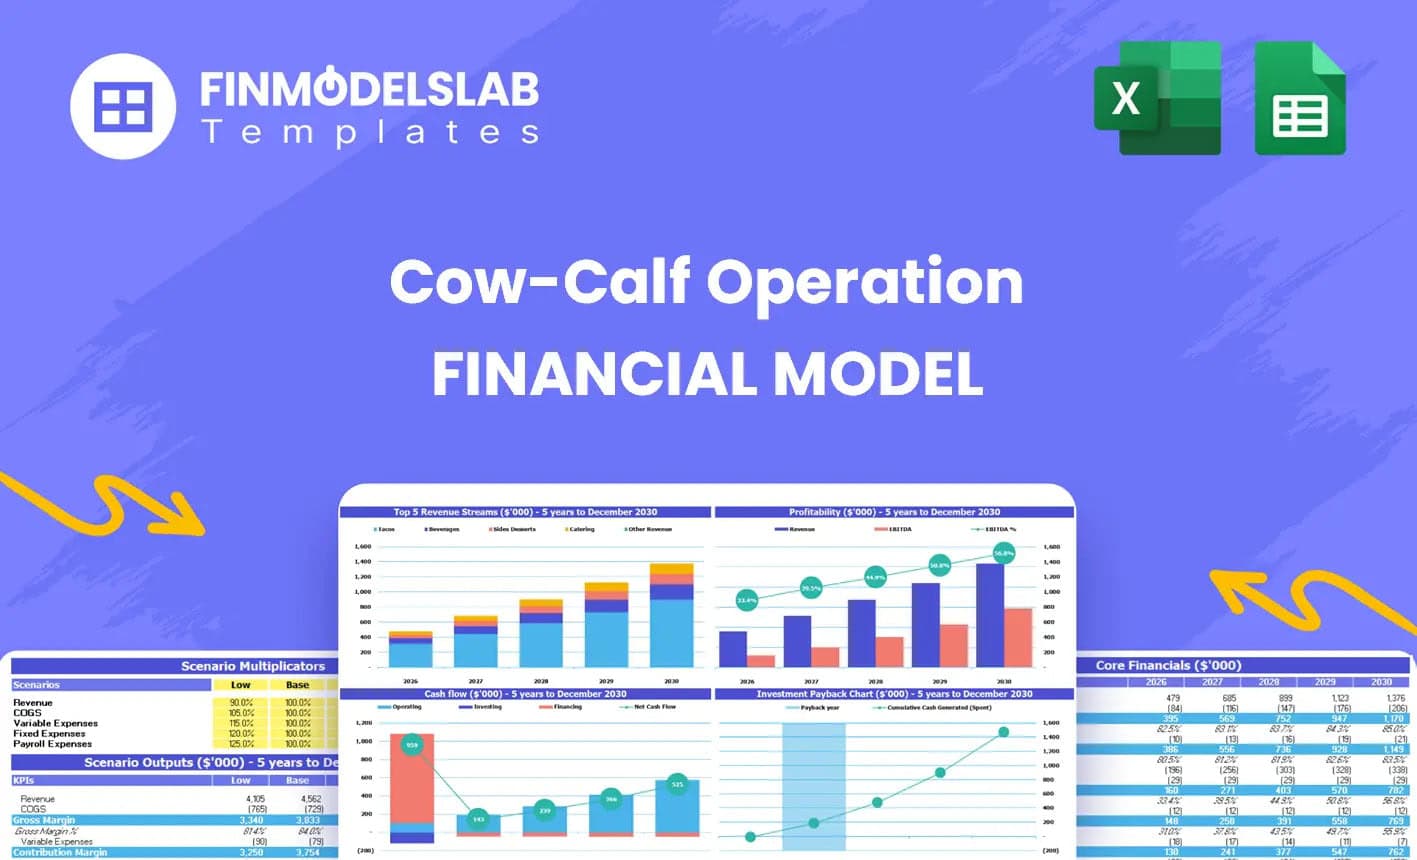
Cow-Calf Operation Financial Model Excel Template
The Cow-Calf Operation Financial Model helps ranch owners, agricultural entrepreneurs, consultants, ... Read more
You must log in to submit a review.