
0 ITEMS

Sheep Farming Financial Model Excel Template
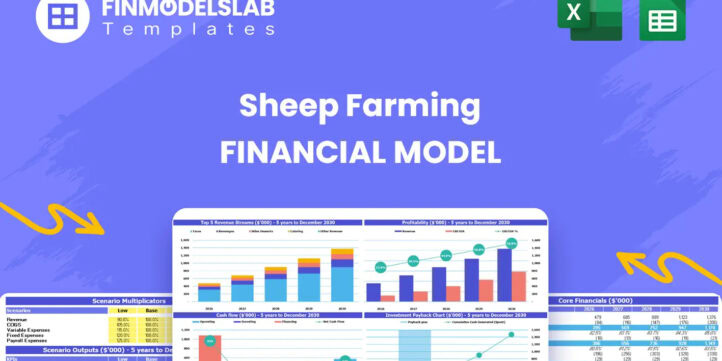
The Sheep Farming Financial Model helps entrepreneurs, farm owners, consultants, analysts, and business plan writers turn a sheep farming concept into a structured, editable financial forecast. Instead of building a complex spreadsheet from scratch, users can start with a ready-to-use model designed around the real economics of a sheep operation, including flock growth, production yield, meat, milk, wool, breeding stock, operating costs, payroll, capital investment, cash flow, and profitability. It gives users a practical way to understand whether their sheep farm plan can support the required startup costs and long-term operating commitments. This financial model template is especially useful for people preparing business plans, investor materials, bank loan applications, grant submissions, or internal expansion plans. Sheep farming can be capital-intensive, with major upfront requirements for fencing, barns, livestock, milking equipment, processing infrastructure, vehicles, and working capital. The template helps organize those assumptions in one place, connect them to revenue assumptions, and evaluate how the business may perform over time. Users can adjust the inputs to reflect their own flock size, production mix, pricing, feed costs, veterinary expenses, land lease, staffing plan, and growth strategy. The model supports more informed decision-making by showing how revenue, operating expenses, payroll, cost of goods sold, cash flow, and profitability interact across the forecast period. It can help users test whether the farm has enough liquidity during the early years, when breakeven may take time, and whether changes in pricing, yield, product mix, or cost structure materially improve financial performance. This is valuable for assessing risk before committing capital, approaching lenders, or scaling an existing livestock operation. Built with editable assumptions, professional formatting, scenario analysis, dashboard views, financial reports, and visual outputs, the Sheep Farming Financial Model is designed to be both practical and presentation-ready. It helps users explain the economics of their farm clearly, compare planning cases, review break-even timing, and communicate key financial metrics to partners, lenders, investors, advisors, or internal stakeholders. Whether you are launching a new sheep farm, adding dairy or wool production, expanding a flock, or preparing a more credible agricultural business plan, this template gives you a structured financial planning tool to support your next decision.


Financial Model Overview
The Sheep Farming Financial Model is a ready-to-use financial model template built to help users plan, evaluate, and present the economics of a sheep farming business. It is designed for entrepreneurs, livestock operators, agricultural consultants, analysts, founders, and business owners who need a structured forecast rather than a blank spreadsheet. Sheep farming often requires significant upfront investment in livestock, fencing, barns, pasture infrastructure, vehicles, milking systems, wool handling equipment, and working capital, while revenue may depend on flock growth, production yield, pricing, product mix, and market access. This template brings those assumptions together in one connected model so users can forecast revenue, costs, payroll, cash flow, profitability, funding needs, and long-term performance. It is fully editable, compatible with Microsoft Excel and Google Sheets, and suitable for business planning, funding discussions, lender submissions, investor presentations, and internal decision-making.
All-in-One Dashboard
The all-in-one dashboard provides a central view of the model’s most important inputs and outputs, allowing users to understand the financial position of the sheep farm without moving through every worksheet individually. This component is useful because sheep farming has many interdependent drivers, including active flock size, production per head, pricing by revenue stream, startup capital, operating expenses, payroll, cash reserves, profitability, and financing assumptions. The dashboard helps users see how these assumptions translate into projected revenue, gross margin, EBITDA, net profit, cash balance, payback timing, and other core outputs. For planning purposes, it acts as a control center where the user can review whether the farm is financially viable under the current assumptions and identify areas that need further adjustment. For funding or stakeholder conversations, it gives a concise overview of the business case, making it easier to explain the scale of the operation, the required investment, and the expected path toward sustainable performance.
Low/Base/High Scenario Analysis
The low, base, and high scenario analysis section allows users to compare different operating outcomes in a structured way. A sheep farming forecast is highly sensitive to assumptions such as flock growth, lambing success, meat yield, milk production, wool pricing, feed costs, processing costs, veterinary expenses, labor requirements, and selling prices. This component helps users build a realistic base case while also testing downside and upside cases. The low case may reflect slower flock expansion, lower production yields, weaker pricing, or higher costs, while the high case may reflect stronger productivity, better direct-to-consumer pricing, improved product mix, or tighter cost controls. The output helps users understand how changes in assumptions affect cash flow, profitability, break-even timing, investment returns, and financing needs. This is especially valuable for lenders, investors, and owners because it shows that the plan has been tested beyond a single optimistic forecast. It also supports better decision-making by highlighting which variables have the greatest impact on farm performance and where management attention should be focused.
Professional Charts
The professional charts component turns the financial model’s calculations into clear visual reports that can be used for presentations, business plans, funding meetings, and internal reviews. Agricultural financial models can contain a large amount of detail, and charts make it easier to communicate trends in revenue, EBITDA, net profit, cash balance, cost structure, and growth over time. For a sheep farming business, visual outputs can help illustrate how revenue scales as the flock expands, how profitability improves after the initial investment period, how operating expenses develop, and how cash reserves move across the forecast horizon. These charts are useful for users who need to explain the financial story to people who may not want to review every spreadsheet tab. They support a more professional presentation by showing the relationship between growth, costs, and profit in a simple format. The component is also helpful for management because it can reveal trends and pressure points quickly, such as negative cash periods, delayed profitability, rising expenses, or the benefits of improving yield and pricing.
ROE Components and DuPont Analysis
The ROE components and DuPont analysis section helps users evaluate the quality of returns generated by the sheep farming business. Return on equity can be difficult to interpret on its own, especially in a capital-intensive farm where large investments may be required long before the operation reaches stable profitability. DuPont analysis breaks return on equity into underlying performance drivers, helping users understand whether returns are being influenced by profit margin, asset efficiency, or financial leverage. In a sheep farming context, this can help reveal whether weak returns are caused by insufficient margins, underutilized assets, slow flock scaling, high operating costs, or an inefficient capital structure. The section may use inputs from the income statement, balance sheet, equity funding, debt assumptions, and operating forecasts to show how the business converts invested capital into returns. This is useful for investors and owners because it goes beyond simple revenue growth and shows whether the farm is using capital efficiently. It also supports strategic planning by identifying whether the business should focus on pricing, cost control, asset productivity, or financing structure to improve shareholder returns.
Revenue Inputs
The revenue inputs section is where users define the key assumptions that drive sales in the Sheep Farming Financial Model. Sheep farm revenue is typically based on the size and productivity of the flock, the quantity of output produced per head, the allocation of production across different product categories, and the pricing of those categories. The model can reflect multiple income streams such as pasture-raised lamb meat, raw sheep milk, raw fleece, processed wool, breeding stock, and culls. Users can adjust assumptions for active heads, annual production per head, pricing, product mix, and growth over time to match their own business plan. This section is important because revenue forecasting is not just a top-line estimate; it is built from operational drivers that can be explained, tested, and defended. For a sheep farm seeking financing, well-documented revenue assumptions help demonstrate how sales are expected to develop as the flock grows and production capacity improves. For internal planning, this component helps users evaluate whether target revenue levels are realistic and whether changes in product strategy could improve margins and cash flow.
Bank-Ready Reports
The bank-ready reports component organizes the financial outputs into lender-friendly summaries that can support loan applications, grant submissions, and funding conversations. Banks and agricultural lenders typically want to understand how much capital is required, how funds will be used, whether the borrower can service debt, when the business becomes cash-flow positive, and what financial risks exist during the early years. This section helps present the model’s outputs in a professional format, including projected income, expenses, profit, cash flow, balance sheet movement, repayment capacity, and key financial metrics. For a sheep farming business, this can be especially important because the operation may have a long payback period and may require careful cash management before reaching break-even. The reports help users communicate the investment case in a structured way rather than relying on scattered assumptions or informal estimates. They are also useful for business advisors, accountants, and consultants who need to review the numbers quickly and understand whether the plan is aligned with lender expectations.
Revenue Breakdown
The revenue breakdown component provides a detailed view of how total revenue is generated across the farm’s different income streams. A sheep farming business may earn income from several sources, and each one can have different production assumptions, pricing, margins, seasonality, and growth potential. For example, lamb meat may be driven by processing volume and price per pound, sheep milk may depend on milking capacity and sales channels, wool may depend on fleece quality and processing decisions, and breeding stock or cull sales may depend on flock management strategy. This section helps users separate those revenue lines so they can see which products contribute the most to total sales and which may deserve more attention. It also supports decision-making around product mix, pricing strategy, and operational focus. If one revenue stream has higher margins or faster growth potential, the user can adjust assumptions and immediately see the impact on the broader forecast. This is useful for both startup planning and expansion planning because it allows the business owner to evaluate whether to focus on meat, milk, wool, breeding, or a diversified revenue approach.
KPI Dashboard
The KPI dashboard tracks the performance metrics that matter most for evaluating the sheep farm’s financial and operational health. Key performance indicators may include revenue growth, gross margin, EBITDA, net income, cash balance, break-even timing, payback period, return on equity, internal rate of return, cost ratios, production assumptions, and other benchmarks. This component is valuable because it converts detailed forecast data into a concise set of metrics that users can monitor over time. For a sheep farming operation, KPI tracking can help identify whether the farm is scaling efficiently, whether margins are improving, whether payroll and operating expenses remain manageable, and whether cash reserves are sufficient during the growth phase. It also supports benchmarking and performance review, helping users compare their plan against target levels or industry expectations. For presentations, the KPI dashboard gives stakeholders a quick way to assess the strength of the business plan. For management, it provides an early warning system for potential issues and a practical tool for ongoing financial discipline.
Startup Capital and CapEx Planning
The startup capital and CapEx planning section helps users estimate the upfront investment required to launch or expand the sheep farming operation. This may include livestock purchases, barn renovation, stalls, fencing, pasture infrastructure, delivery and transport vehicles, milking equipment, wool processing tools, water systems, storage facilities, licenses, deposits, and initial working capital. In the model, these inputs can be entered as itemized capital expenditures so users can understand how much money is needed before the farm begins generating meaningful revenue. The output can feed into depreciation schedules, funding requirements, balance sheet projections, cash flow planning, and payback analysis. This component is particularly useful because underestimating startup capital is one of the biggest risks in a livestock business. Sheep farming often requires infrastructure before the flock can scale, and the timing of these investments can affect liquidity for years. By organizing capital needs clearly, the template helps users build a more realistic funding plan, explain the use of funds to lenders or investors, and make better decisions about which investments are essential at launch versus which can be phased in over time.
Break-Even and Cash Flow Planning
The break-even and cash flow planning section helps users understand when the sheep farming business may become profitable and whether it has enough liquidity to survive the early operating period. This component uses revenue forecasts, cost of goods sold, fixed expenses, payroll, startup costs, capital expenditures, debt assumptions, taxes, and working capital requirements to calculate projected cash movement over time. It can help identify the month or year when the farm reaches break-even, the lowest projected cash balance, the amount of funding required to avoid shortfalls, and the relationship between profitability and actual cash availability. This is critical for sheep farming because the business may require several years of flock growth before revenue fully supports overhead and capital investment. Positive accounting profit does not always mean the farm has enough cash to cover feed, payroll, maintenance, loan payments, or expansion costs. By showing cash flow clearly, the model helps users plan financing needs, control spending, test cost reductions, evaluate pricing changes, and make more confident decisions before committing additional capital.
File types:
Excel – Single-User: .xlsx
Excel – Multi-User: .xlsx
Similar ProductsOther customers were also interested in...


 HenrySheykin
Cattle Farming Financial Model Excel Template
The Cattle Farming Financial Model helps users turn a cattle farm concept, expansion plan, or fundin... Read more
Poultry Farm Financial Model Excel Template
The Poultry Farming Financial Model helps users turn a poultry farm concept into a structured, lende... Read more
Cannabis Financial Model Excel Template
The Cannabis Business Financial Model is a ready-to-use financial model template designed to help en... Read more
Greenhouse Farming Financial Model Excel Template
The Greenhouse Farming Financial Model helps users evaluate the economics of a controlled environmen... Read more
Fish Farm Financial Model Excel Template
The Fish Farming Financial Model template helps entrepreneurs, aquaculture founders, business owners... Read more
Hydroponics Financial Model Excel Template
The Hydroponic Farming Financial Model helps entrepreneurs, growers, consultants, analysts, and busi... Read more
Shrimp Farm Financial Model Excel Template
The Shrimp Farming Financial Model helps entrepreneurs, aquaculture operators, consultants, analysts... Read more
Hemp Farming Financial Model Excel Template
The Hemp Farming Financial Model Template helps entrepreneurs, farm owners, consultants, analysts, a... Read more
Dairy Farming Financial Model Excel Template
Purchase Dairy Farming Financial Projection. Sources & Uses, Profit & Loss, Cash Flow statem... Read more
Aquaponics Financial Model Excel Template
The Commercial Aquaponics Financial Model helps users turn a capital-intensive aquaponics concept in... Read more
You must log in to submit a review.