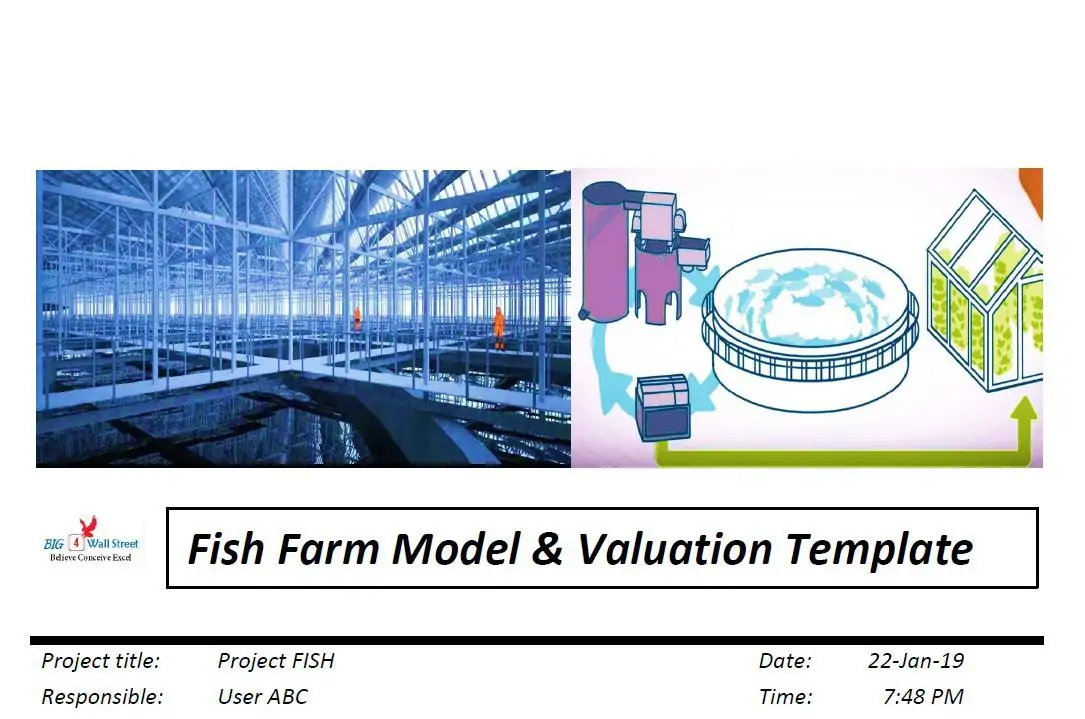
Fish Farm Financial Model Excel Template
Get the Best Fish Farm Pro Forma Projection. This well-tested, robust, and powerful template is your solid foundation to plan a success. Highly versatile and user-friendly Fish Farm 3 Way Forecast for the preparation of a Pro Forma Income Statement, Startup Cash Flow Projection, and Balance Sheet with a monthly and annual timeline. Works for a startup or existing fish farm business Fish Farm Financial Projection Model used to evaluate startup ideas, plan startup pre-launch expenses, and get funded by banks, angels, grants, and VC funds. Unlocked – edit all – last updated in Sep 2020. All in one package of print-ready reports, including a fish farm pro forma income statement for startup, cash flow projection, a break-even analysis, and a complete set of financial metrics.

NOTE: Single-User pertains to a limited Single User License where the template can only be used by one single user; while Multi-User is a license for users sharing the template with up to 20 members. Please refer to Terms of Use and License and Permitted Use for clarification.
FISH FARM CASH FLOW FORMAT IN EXCEL KEY FEATURES
Video tutorial:
Simple-to-use
A very sophisticated Fish Farm Financial Model Excel Spreadsheet, whatever size and stage of development your business is. Minimal previous planning experience and very basic knowledge of Excel is required: however, fully sufficient to get quick and reliable results.
Get it Right the First Time
Funding is a binary event: either you succeed or you fail. If you fail, most investors won’t give you a second chance. Learn about the pros and cons with Fish Farm Pro Forma Budget.
Track your spending and staying within budget
Have you written a vague idea of cash inflows and cash outflows on the back of a napkin? All is well and good. Looking at the profit and loss statement proforma will give you a snapshot of the past business performance, but it won’t show the future in terms of the Cashflow Forecast. With a cash flow pro forma, you can plan future cash inflows and cash outflows and compare it to the budget, which can be invaluable information.
Saves you time
Allows you to spend less time on Startup Cash Flow Statement and more time on your products, customers and business development
Identify cash gaps and surpluses before they happen.
Forecasting your future cash balance helps you see well in advance when you may have a cash deficit that could hurt your business. Cash Flow Statement Proforma will give you enough time to take action to prevent a crisis. It will enable you to access better loan rates or speed up incoming payment to bridge the gap. On the other side, if you know ahead of time that the large lump of cash will lay in your bank account within the next three months. In this case, you might need to explore options to reinvest it in your business to drive growth.
Graphical visualization in a convenient dashboard all in one
All necessary reports and calculations, including variable data for your easement, are displayed on a convenient Cashflow Projection dashboard tab. You do not need to move between sheets to compare important data – everything is visible immediately.
REPORTS and INPUTS
Performance KPIs
Return on capital. The return on capital reflects the correspondence of the Balance Sheet and Income Statement. Return on capital measures the accomplishment of earnings to the capital employed.
Companies with good financial management have good returns.
Operational KPIs
Our Fish Farm Budget Financial Model has various operational performance graphs that will help business owners manage their business’ finances and measure their overall performance. These operational performance graphs also help in making wise business decisions that consider the company’s financial capability.
The financial graphs in this Fish Farm Pro Forma help measure the company’s financial health showing the operating cash flows’ analysis, return on investment, debt to equity ratio, liquidity ratios, and other relevant financial information. Business owners can use these operational performance graphs both for internal and external purposes.
In particular, they can use these graphs to assess the company’s overall financial performance or for the assessment of the project’s financial feasibility. Such an approach will improve the financial management efficiency of the company. Business owners can also use these charts and graphs for the presentations for potential investors and bankers. The operational performance graphs have all the necessary pre-built formulas, and they are fully formatted. So, the users can just print out them and bring for the meeting with investors.
Financial KPIs
In the 3 Way Forecast you can visually track your key financial indicators (KPIs) for 24 months and up to five years.
The model all KPIs you might need for your company:
– EBITDA/EBIT shows your company’s operational performance;
– CASH FLOWS show your company’s inflows and outflows;
– CASH BALANCE this is the forecast of cash in hand you will have.
Loan opt-in
The loan amortization schedule template in this Fish Farm Financial Projection reflects the schedule of repayment of the loan. It shows detailed information about the company’s periodic payments or installments that comprise of principal amount and an interest component.
These elements are shown in the loan amortization schedule template for the period till the end of the loan term or up to which the full amount of the loan is paid off.
Financial Statements
The Fish Farm Excel Financial Model has pre-built proformas for the balance sheet, the profit and loss projection, and the startup cash flow statement. These proformas allow users to create statements both on a monthly and annual basis.
Users can create detailed financial statements using the financial assumptions inputted in the Cash Flow Proforma.
Benchmarks
A benchmarking study as the element of the P&L Projection is usually used to evaluate a business’s performance by focusing on one or more particular indicators and comparing them with similar indicators of other companies in the industry.
In respect of the financial benchmarking study, these indicators could be profit margins, cost margins, cost per unit, productivity margins, or others. Later the company’s performance indicators should be compared to that of other companies within the same industry.
Benchmarking is a useful strategic management tool, which is essential for start-ups. Companies can evaluate any economic, business, or financial metric or process and compare them to the processes of ‘best practice’ companies within the same field or industry.
Liquidity KPIs
Liquidity Position. The liquidity position of a company is an essential indication of the financial health of the enterprise. To assess the liquidity position of the company, it is necessary to calculate the liquidity ratio. Many companies set a target liquidity ratio that reflects the specifics of their business and industry. Such target liquidity ratios ensure that companies have enough cash to meet their obligations. Therefore, we recommend setting a target liquidity ratio for your Pro Forma Template.
File types:
Excel – Single-User: .xlsx
Excel – Multi-User: .xlsx
Free Demo – .xlsx
Similar Products
Other customers were also interested in...
Fish Farm Financial and Valuation Model
Financial Model Templates that generates a three statement financial model and a valuation for a fis... Read more
Agriculture Financial Model Templates Bundle
This is a collection of financial model templates for businesses in the Agriculture Industry and its... Read more
Agricultural Financial Model Bundle
Are you interested in starting a business in the Agriculture Industry? Or are you looking for financ... Read more
Poultry Farm Financial Model Excel Template
Shop Poultry Farm Budget Template. Excel template - robust and powerful. This is your solid foundati... Read more
Cannabis Financial Model Excel Template
Download Cannabis Farming Financial Model. Creates 5-year financial projection and financial ratios ... Read more
Shrimp Farm Financial Model Excel Template
Check Our Shrimp Farm Pro Forma Projection. This well-tested, robust, and powerful template is your ... Read more
Fruits Farming Financial Model Excel Template
Buy Fruits Farming Financial Projection. Use this Excel to plan effectively, manage Cash Flows and f... Read more
Marijuana Financial Model Excel Template
Get Your Marijuana Farming Financial Model Template. Sources & Uses, Profit & Loss, Cash Flo... Read more
Soy Production Financial Model Excel Template
Check Soy Production Financial Projection Template. Fortunately, you can solve Cash Flow shortfalls ... Read more
Vegetable Farming Financial Model Excel Template
Buy Vegetables Farming Pro-forma Template. Solid package of print-ready reports: P&L and Cash Fl... Read more
Reviews
please send me detailed financial analysis of fish farming .It is so important for me
177 of 345 people found this review helpful.
Help other customers find the most helpful reviews
Did you find this review helpful?
You must log in to submit a review.


