
0 ITEMS

Hydroponics Financial Model Excel Template
The Hydroponic Farming Financial Model helps entrepreneurs, growers, consultants, analysts, and business planners turn a hydroponic farm concept into a structured financial forecast. Instead of building complex spreadsheets from scratch, users can work from a ready-to-use financial model template designed around the economics of controlled environment agriculture. The model helps estimate cultivated area, crop mix, yield assumptions, pricing, revenue potential, startup costs, operating expenses, payroll, cash flow, profitability, and investment returns in one organized planning file. This template is built for people preparing a hydroponic farming business plan, investor presentation, lender submission, feasibility study, or internal expansion analysis. It gives users a practical way to connect operational assumptions, such as harvest cycles, crop allocation, yield loss, direct production costs, energy usage, logistics, facility overhead, and staffing, with the financial outputs investors and decision-makers expect to see. By adjusting editable inputs, users can review how changes in production volume, pricing, labor, utilities, and capital expenditure affect gross margin, EBITDA, cash flow, and long-term profitability. The Hydroponic Farming Financial Model is especially useful for evaluating whether a proposed farm can support its cost structure and reach sustainable profitability. It helps users organize startup cost assumptions, estimate ongoing fixed and variable expenses, plan payroll needs, and understand the timing of break-even. The model also supports scenario planning, allowing users to compare conservative, base, and optimistic cases before committing capital or presenting projections to stakeholders. This makes it valuable for founders seeking funding, established operators planning a new facility, and advisors helping clients evaluate indoor farming investments. With automated calculations, professional formatting, linked financial statements, charts, dashboards, and key performance indicators, the template helps simplify financial planning without removing the detail needed for serious decision-making. Users can forecast revenue and expenses, analyze cash flow, review profitability, assess investment returns, and communicate the business case more clearly. The result is a customizable, investor-ready planning tool that helps replace guesswork with structured assumptions and gives buyers a clearer view of the financial potential, risks, and funding needs of a hydroponic farming business.
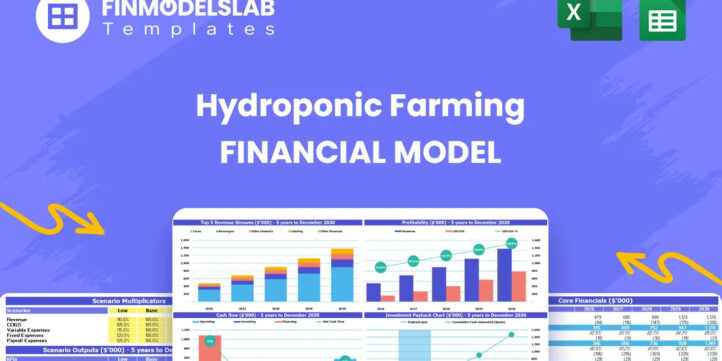


Financial Model Overview
The Hydroponic Farming Financial Model is a ready-to-use financial model template designed to help entrepreneurs, growers, consultants, analysts, and business owners evaluate the financial feasibility of a hydroponic farming business. Hydroponic farms require careful planning because revenue depends on cultivated area, crop mix, yield per cycle, harvest frequency, pricing, and loss assumptions, while costs are driven by direct production inputs, energy, packaging, logistics, labor, facility overhead, and capital investment. This template brings those drivers into one structured model so users can forecast revenue, expenses, cash flow, profitability, funding needs, and investment returns without starting from a blank spreadsheet. It is useful for business planning, fundraising, lender discussions, internal budgeting, and expansion analysis because it turns operational assumptions into financial outputs that are easier to review, refine, and present. The model is fully editable, allowing users to customize assumptions for different crop strategies, farm sizes, production systems, pricing approaches, staffing plans, and cost structures. Whether the goal is to launch a new hydroponic facility, expand an existing controlled environment agriculture operation, or prepare a professional business plan, the Hydroponic Farming Financial Model provides a practical framework for making better financial decisions.
All-in-One Dashboard
The all-in-one dashboard gives users a central view of the most important inputs and outputs in the Hydroponic Farming Financial Model. Instead of searching through multiple sheets to understand the business case, users can review core assumptions and headline results in one place. This component may summarize key inputs such as cultivated area, crop allocation, yield assumptions, price per kilogram, harvest cycles, startup investment, payroll, operating expenses, financing assumptions, and growth expectations. It then connects those inputs to outputs such as total revenue, gross profit, EBITDA, net income, cash balance, funding requirements, and return metrics. For hydroponic farming, this is especially valuable because small changes in yield, crop pricing, energy costs, or labor structure can materially affect the financial outcome. The dashboard helps founders and planners quickly understand whether the model is producing a financially viable result and where the main pressure points are. It is also useful for stakeholder communication because investors, lenders, partners, and management teams often want a clear summary before reviewing detailed assumptions. By combining core inputs and core outputs, this section helps users manage the model more efficiently and focus conversations on the numbers that matter most.
Low, Base, and High Scenario Analysis
The low, base, and high scenario analysis section helps users test how the hydroponic farming business may perform under different operating and market conditions. A hydroponic farm is exposed to variables such as crop yields, selling prices, harvest frequency, production losses, energy costs, labor costs, facility expenses, and speed of customer adoption. This component allows users to compare a conservative case, a realistic base case, and an optimistic growth case within the same financial model. Inputs may include different assumptions for cultivated area expansion, crop pricing, yield efficiency, revenue growth, cost percentages, payroll timing, capital expenditure, and working capital needs. The outputs can show how each case affects revenue, gross margin, EBITDA, net profit, cash flow, payback timing, and funding requirements. This is useful for decision-making because it helps users avoid relying on one fixed forecast and instead understand a range of possible outcomes. For investors and lenders, scenario analysis shows that the business plan has been stress-tested and that management understands both upside potential and downside risk. For operators, it provides a planning tool to evaluate what happens if energy costs rise, yields come in lower than expected, or the business scales faster than planned.
Professional Charts
The professional charts section converts the financial forecast into clear visual summaries that can be used for presentations, business plans, pitch decks, and internal management reviews. Hydroponic farming financial projections can involve many moving parts, including revenue by crop, cost of goods sold, variable expenses, fixed overhead, payroll, capital expenditures, cash flow, and investment returns. Charts help make these relationships easier to understand by showing trends, comparisons, and key milestones in a visual format. This component may include charts for revenue growth, gross profit, EBITDA, net income, cash balance, expense breakdown, capital investment, scenario comparison, and profitability progression over time. These visuals are useful because stakeholders often need to grasp the financial story quickly, especially when evaluating a funding request or strategic expansion. A revenue chart can show how the farm scales as cultivated area increases, while an expense chart can highlight the impact of energy, labor, and facility costs. A cash flow chart can show whether the business has enough liquidity during ramp-up, and a profitability chart can show when operations move from loss-making to self-sustaining. By presenting complex model outputs in a cleaner and more accessible way, the professional charts section helps users communicate the financial plan with greater confidence.
ROE Components and DuPont Analysis
The ROE components and DuPont analysis section helps users understand what is driving return on equity in the hydroponic farming business. Return on equity is an important metric for investors because it shows how effectively the business may generate profit relative to the equity capital invested. DuPont analysis breaks ROE into underlying drivers, typically including profit margin, asset efficiency, and financial leverage, allowing users to see whether returns are coming from operational profitability, asset utilization, or capital structure. In the context of a hydroponic farm, this is useful because the business can be highly capital intensive, with major investments in facility construction, vertical farming systems, lighting, climate control, irrigation, nutrient systems, and other equipment. The model may use inputs from the income statement, balance sheet, and financing assumptions to calculate ROE and its components over time. Outputs can help users evaluate whether improvements in crop pricing, yield performance, cost control, working capital management, or financing structure are improving shareholder returns. This section supports funding discussions by giving investors a more detailed view of how their capital may perform and what operational levers influence that performance. It also helps business owners assess whether the farm is generating adequate returns compared with the level of capital required to build and operate the facility.
Revenue Inputs
The revenue inputs section is one of the most important parts of the Hydroponic Farming Financial Model because it defines how the business generates sales. Hydroponic farm revenue is typically built from operational assumptions such as cultivated area, crop mix, harvest cycles per year, yield per hectare or growing unit, expected yield loss, selling price per kilogram, and production ramp-up. Users can customize assumptions for different crops, such as lettuce, arugula, herbs, microgreens, tomatoes, or other hydroponic produce, depending on the business model. The section may also allow users to reflect changes in cultivated area over time, price increases, productivity improvements, and crop allocation shifts. Outputs from this component feed directly into revenue forecasts and influence nearly every other part of the model, including cost of goods sold, variable expenses, gross profit, cash flow, and investment returns. For planning purposes, this section helps users move beyond simple top-down sales estimates and instead build revenue from the actual drivers of production. It is especially useful when preparing a hydroponic farming business plan because lenders and investors often want to understand how revenue assumptions were calculated. By documenting volume, pricing, harvest frequency, and crop allocation clearly, the model helps create a more credible and transparent forecast.
Bank-Ready Reports
The bank-ready reports section provides lender-friendly financial outputs that can support loan applications, funding discussions, and formal business planning. Hydroponic farming projects often require significant upfront investment, so banks and financing partners need clear evidence that the business can generate enough revenue and cash flow to service debt and sustain operations. This component may include structured financial statements such as profit and loss forecasts, cash flow statements, and balance sheets, along with supporting schedules that show revenue, expenses, capital expenditure, working capital, debt financing, and repayment assumptions. Outputs may highlight EBITDA, net income, operating cash flow, ending cash balance, debt service capacity, and other financial metrics that lenders commonly review. This section is valuable because it organizes the forecast in a professional format that is easier for financial institutions to evaluate. It can help users explain how the farm will use funding, how long the ramp-up period may last, when the business is expected to become profitable, and whether cash flow is sufficient during early operating years. For business owners and consultants, bank-ready reports reduce the time needed to assemble financial documentation and help ensure that the model presents a complete and consistent financial story.
Revenue Breakdown
The revenue breakdown section gives users a detailed view of how different revenue streams, crops, or production categories contribute to total sales. In a hydroponic farming business, not all crops have the same yield profile, selling price, growth cycle, labor requirement, or margin potential. A detailed revenue breakdown helps users evaluate which products drive the most revenue and which assumptions have the biggest impact on the forecast. This component may separate revenue by crop type, cultivated area allocation, harvest cycle, yield after losses, price per kilogram, and annual production volume. Outputs can show total kilograms produced, net saleable yield, revenue per crop, percentage contribution to total sales, and changes over time as the farm scales. This is useful for operational planning because it helps users decide whether to prioritize higher-price crops, faster-turning greens, more stable wholesale products, or a diversified crop mix. It also supports sales strategy and investor communication because stakeholders can see that the revenue forecast is not a single unexplained number but a structured build-up based on production logic. By showing revenue at a more granular level, this section helps users identify opportunities to improve margins, rebalance crop allocation, and test whether the farm’s production plan aligns with market demand.
KPI Dashboard
The KPI dashboard tracks the performance metrics that help users evaluate whether the hydroponic farming business is operating efficiently and moving toward its financial goals. Key performance indicators may include revenue, gross margin, EBITDA margin, net profit margin, cash balance, payback period, return on equity, internal rate of return, yield per cultivated area, revenue per hectare, cost of goods sold as a percentage of revenue, payroll as a percentage of revenue, and operating expense ratios. For a hydroponic farm, KPIs are useful because profitability depends on both biological performance and financial discipline. Strong yields may not be enough if energy costs, logistics, labor, or fixed overhead are too high, while good cost control may not compensate for weak pricing or underutilized growing capacity. This component helps users compare actual or projected performance against targets, benchmarks, and scenario expectations. The outputs can highlight whether the business is improving over time, where margins are being compressed, and which areas may require management attention. For investors and lenders, KPIs provide a concise way to assess financial health and operating performance. For owners and managers, the dashboard supports ongoing decision-making by turning the financial model into a practical monitoring tool rather than a one-time forecast.
Startup Costs and Capital Expenditure Planning
The startup costs and capital expenditure planning section helps users estimate the upfront investment required to launch or expand a hydroponic farming operation. Hydroponic farms can require substantial capital before revenue begins, including facility construction or buildout, growing racks, hydroponic systems, pumps, reservoirs, irrigation equipment, nutrient delivery systems, climate control, lighting, automation, monitoring technology, cold storage, packaging areas, vehicles, permits, deposits, initial inventory, and pre-opening expenses. This component allows users to organize those costs into clear categories and connect them to funding needs, depreciation, and cash flow. Inputs may include purchase costs, timing of expenditures, useful life assumptions, financing sources, and contingency amounts. Outputs can show total startup investment, capital expenditure by category, cash required before launch, depreciation expense, and the impact of capital spending on the balance sheet and cash flow forecast. This section is important for budgeting because underestimating startup costs can lead to funding gaps before the farm reaches stable production. It is also useful for investor and lender discussions because it explains how capital will be used and why the requested funding amount is needed. By separating startup investment from ongoing operating expenses, the model gives users a clearer view of launch requirements and long-term asset planning.
Break-Even Analysis
The break-even analysis section helps users identify the level of revenue or production needed for the hydroponic farm to cover its costs and begin generating profit. This is critical for a business with meaningful fixed expenses such as facility lease, maintenance contracts, management salaries, farm labor, insurance, software, utilities, and professional services, as well as variable costs such as seeds, nutrients, packaging, energy, delivery, and marketing. Inputs may include gross margin, fixed overhead, payroll, cost of goods sold percentages, variable expense ratios, price per kilogram, yield assumptions, and production capacity.
File types:
Excel – Single-User: .xlsx
Excel – Multi-User: .xlsx
Similar ProductsOther customers were also interested in...


 HenrySheykin
Cattle Farming Financial Model Excel Template
The Cattle Farming Financial Model helps users turn a cattle farm concept, expansion plan, or fundin... Read more
Hemp Farming Financial Model Excel Template
The Hemp Farming Financial Model Template helps entrepreneurs, farm owners, consultants, analysts, a... Read more

Dairy Farming Financial Model Excel Template
Purchase Dairy Farming Financial Projection. Sources & Uses, Profit & Loss, Cash Flow statem... Read more
Aquaponics Financial Model Excel Template
The Commercial Aquaponics Financial Model helps users turn a capital-intensive aquaponics concept in... Read more
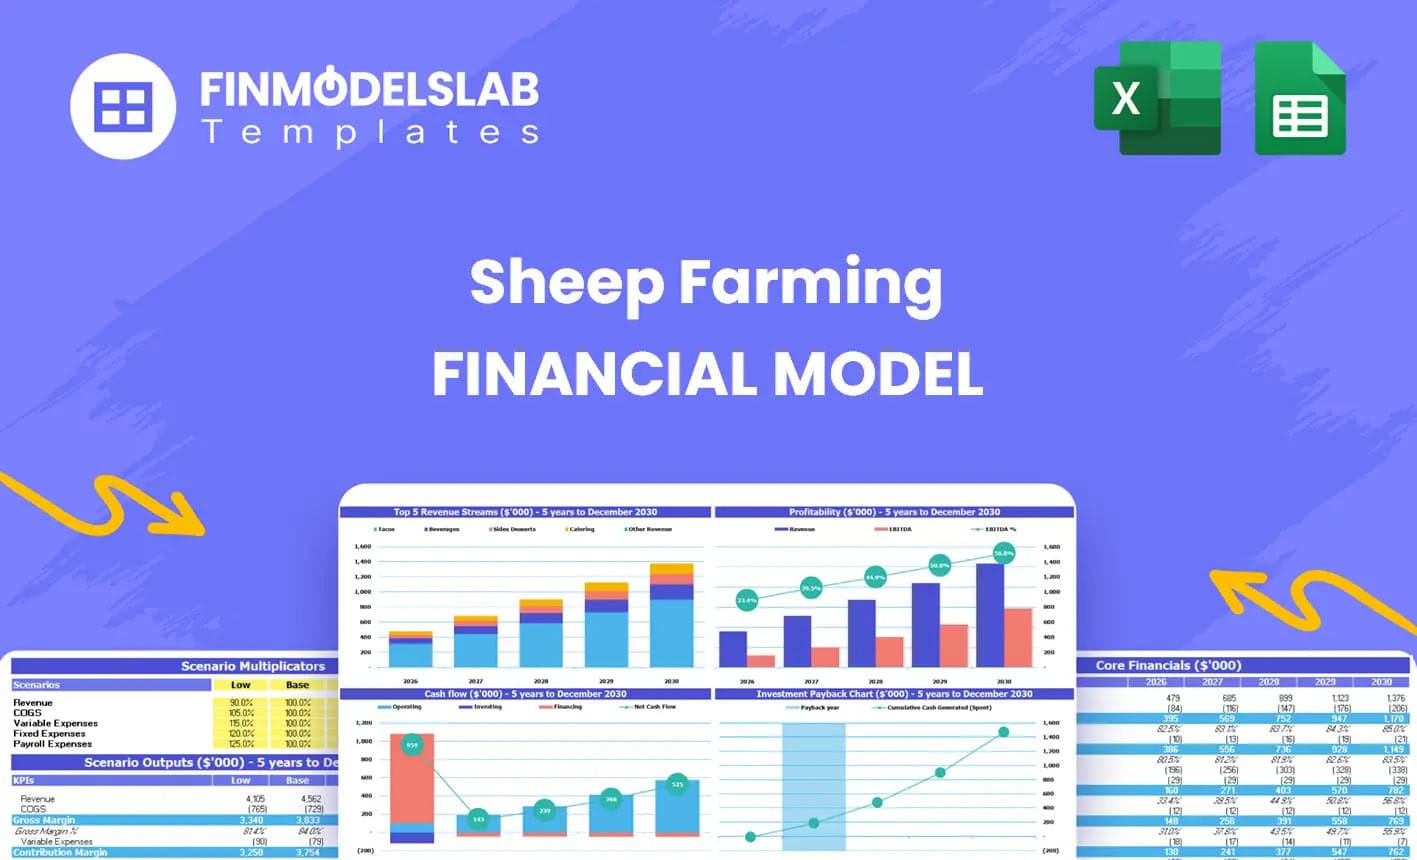
Sheep Farming Financial Model Excel Template
The Sheep Farming Financial Model helps entrepreneurs, farm owners, consultants, analysts, and busin... Read more
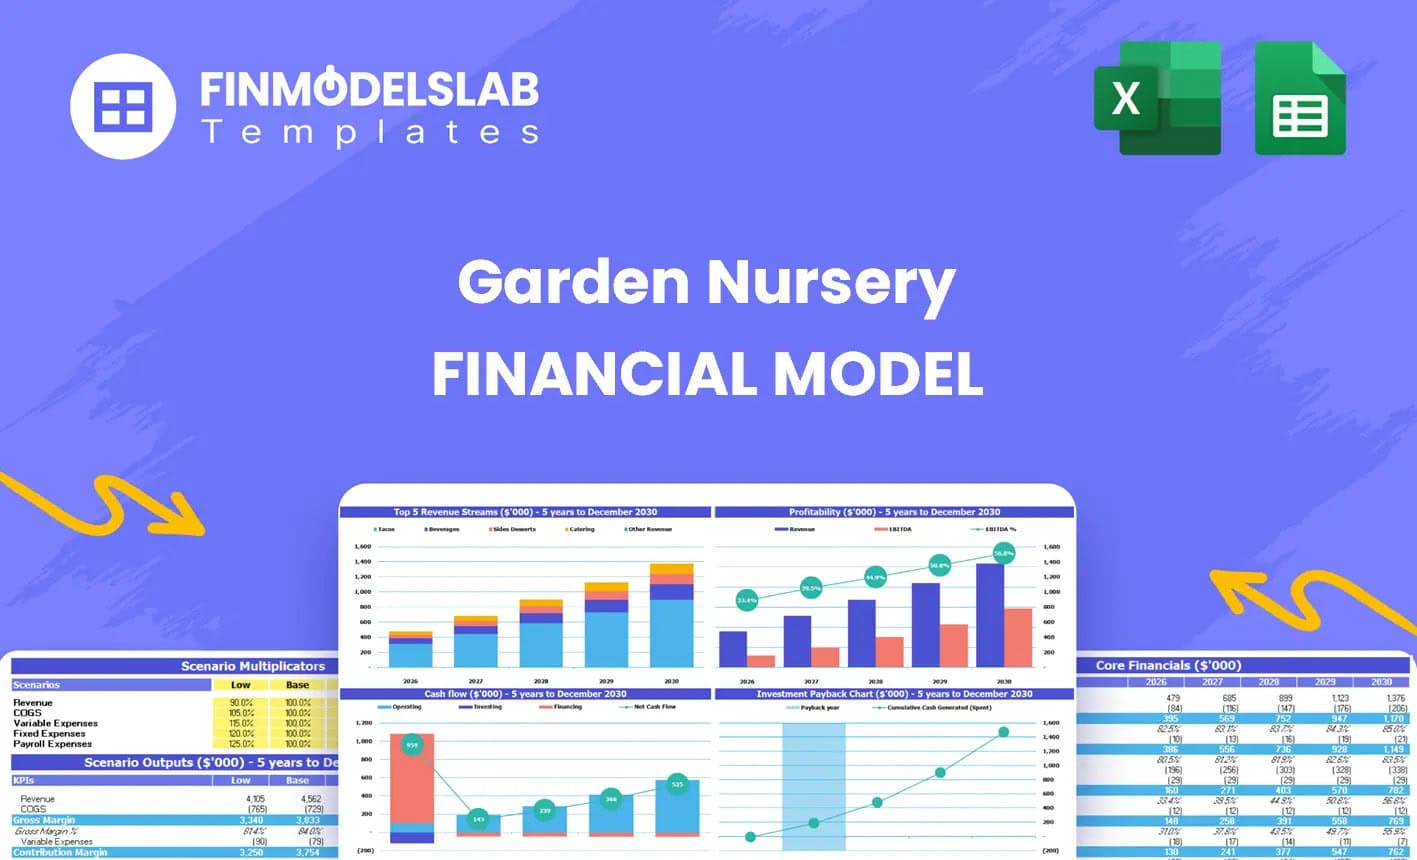
Garden Nursery Financial Model Excel Template
The Garden Nursery Financial Model helps entrepreneurs, nursery owners, consultants, analysts, and b... Read more
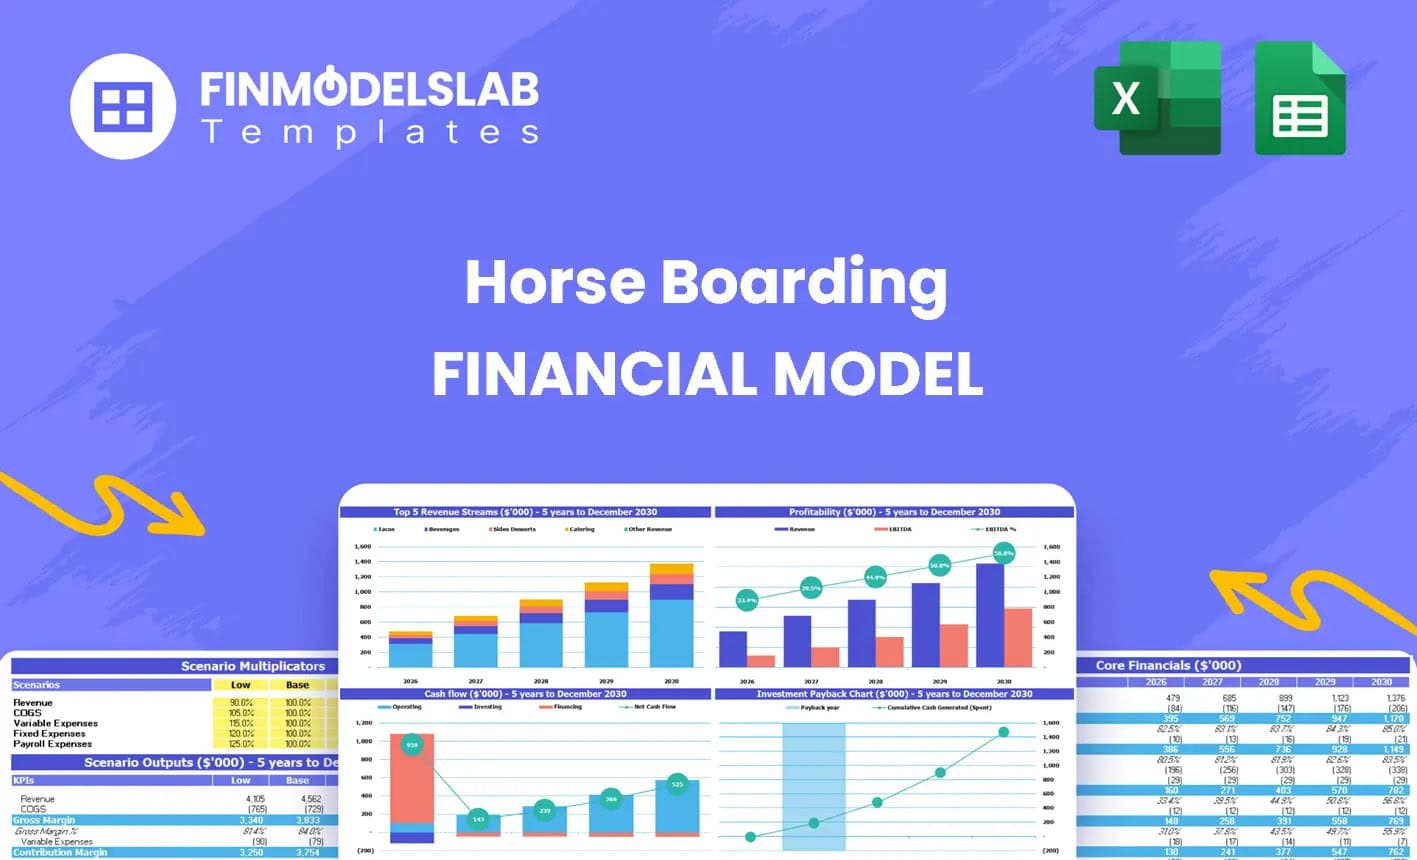
Horse Boarding Financial Model Excel Template
The Horse Boarding Financial Model helps turn a stable, equestrian center, or horse boarding concept... Read more
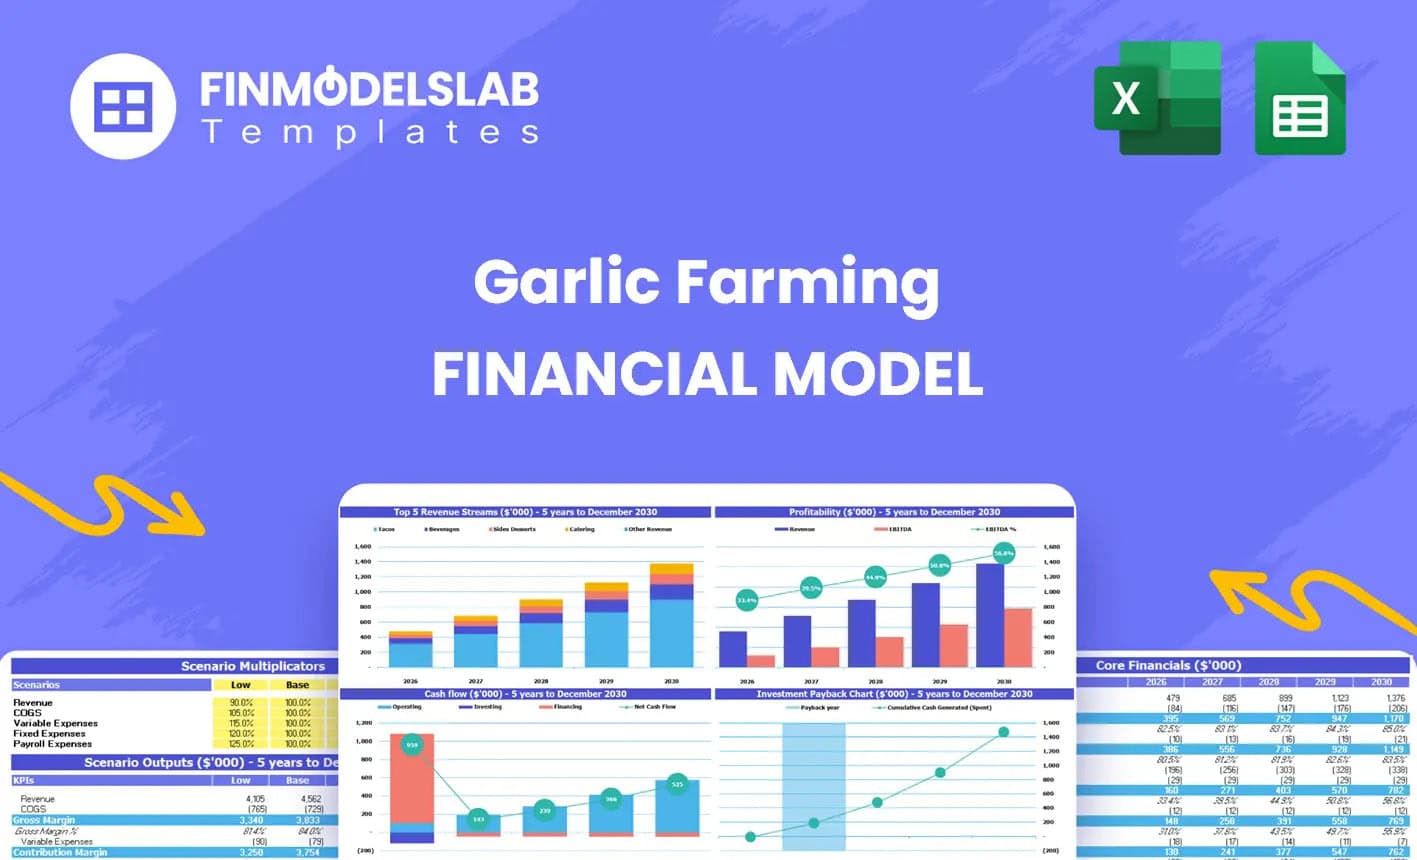
Garlic Farming Financial Model Excel Template
The Garlic Farming Financial Model helps entrepreneurs, growers, consultants, analysts, and business... Read more
Plant Nursery Financial Model Template
The Plant Nursery Financial Model helps entrepreneurs, nursery owners, consultants, analysts, and bu... Read more
Cow-Calf Operation Financial Model Excel Template
The Cow-Calf Operation Financial Model helps ranch owners, agricultural entrepreneurs, consultants, ... Read more
You must log in to submit a review.