
0 ITEMS

Garden Nursery Financial Model Excel Template
The Garden Nursery Financial Model helps entrepreneurs, nursery owners, consultants, analysts, and business plan writers turn a plant nursery concept into a structured financial forecast. Instead of starting from a blank spreadsheet, users can work from a ready-to-use model designed around the economics of a retail garden nursery, including plant sales, houseplants, gardening supplies, workshops, inventory costs, staffing, operating expenses, startup investment, cash flow, and long-term profitability. The template is built to support practical financial planning, whether you are launching a new nursery, expanding an existing garden center, preparing funding documents, or comparing different growth strategies. This Garden Nursery Financial Model gives users a clear way to build assumptions and see how those assumptions affect performance over time. You can adjust revenue assumptions, pricing, sales volumes, direct costs, payroll, rent, utilities, marketing, seasonal operating expenses, and other business drivers to reflect your local market and strategy. The model then connects those inputs to financial outputs such as revenue forecasts, profit projections, cash flow forecasts, balance sheet estimates, and investor-facing metrics. This helps users understand not only whether the nursery can generate sales, but whether those sales can support inventory purchases, staffing, overhead, debt service, reinvestment, and sustainable growth. The template is especially useful for decision-making because it helps test the financial impact of different business choices before money is committed. Users can evaluate the effect of changing product mix, increasing workshop activity, adjusting plant pricing, scaling inventory, hiring employees, or opening with a larger greenhouse and retail footprint. Built-in planning sections support startup costs, operating expenses, profitability analysis, cash flow management, and break-even analysis, helping users identify how much capital may be needed, when the business may become profitable, and which assumptions have the greatest impact on results. Designed for Excel and Google Sheets, the Garden Nursery Financial Model is editable, presentation-ready, and practical for non-financial users as well as experienced planners. It can be used to prepare business plans, investor presentations, lender packages, internal budgets, and expansion forecasts. By organizing the core financial logic of a garden nursery in one connected model, it saves time, reduces guesswork, and gives founders and advisors a stronger foundation for planning, funding conversations, and operational decisions.
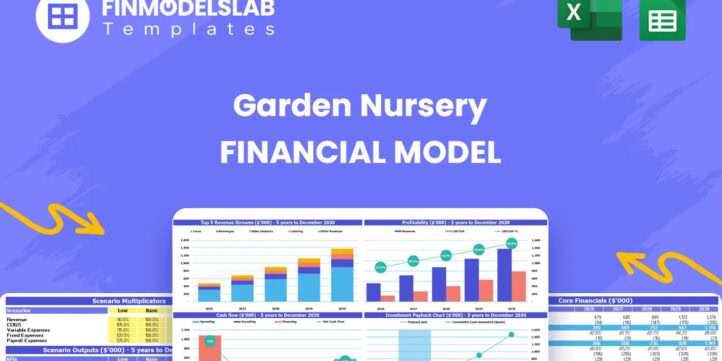


Garden Nursery Financial Model Overview
The Garden Nursery Financial Model is a ready-to-use financial planning template designed for entrepreneurs, business owners, consultants, analysts, and founders who need to forecast the financial performance of a retail plant nursery or garden center. It brings together the assumptions that matter most in this type of business, including plant and houseplant sales, gardening supplies, workshops, direct costs, staffing, overhead, startup investment, cash flow, profitability, investor returns, and break-even timing. Instead of building a complex spreadsheet from scratch, users can enter their own numbers into an organized structure and review projected financial statements, charts, metrics, and planning outputs. This makes the template useful for launching a new garden nursery, preparing a business plan, seeking bank financing, presenting to investors, or evaluating expansion options for an existing horticulture business. Because the model is editable, users can adapt the assumptions to match their location, retail format, product mix, pricing strategy, seasonality, supplier terms, payroll plan, and funding needs.
All-in-one Dashboard
The all-in-one dashboard gives users a central place to review the most important inputs and outputs of the Garden Nursery Financial Model without having to move through every worksheet in detail. It is designed to summarize the business at a glance by connecting key assumptions such as revenue drivers, cost structure, capital investment, staffing, and growth rates with core financial outputs such as revenue, EBITDA, net profit, cash flow, ending cash balance, and break-even month. For a garden nursery, this is especially useful because performance depends on multiple moving parts, including seasonal sales patterns, inventory purchasing, plant margins, retail supply sales, and workshop participation. The dashboard helps users quickly understand whether the plan is financially viable, how much cash may be available at different stages, and which metrics need more attention. It also supports communication with stakeholders because it presents the financial story in a cleaner and more accessible format than raw spreadsheet data. Founders can use it during planning meetings, consultants can use it to review assumptions with clients, and investors or lenders can use it to understand the forecast without having to audit every formula manually.
Low, Base, and High Scenario Analysis
The Low, Base, and High scenario analysis component helps users compare how the garden nursery could perform under different business conditions. The base case can represent the most likely operating plan, while the low case can reflect slower customer traffic, weaker sales volumes, higher plant inventory costs, delayed workshops, or lower average order values. The high case can show the upside from stronger demand, better marketing performance, premium pricing, higher workshop attendance, improved gross margins, or faster expansion. By changing assumptions across these scenarios, users can see how revenue, gross profit, operating expenses, cash flow, EBITDA, net income, and funding needs may shift. This is valuable because garden nursery performance can be affected by weather, local competition, seasonality, supplier pricing, consumer spending, and the timing of spring and summer demand. Scenario analysis gives founders and planners a more realistic range of possible outcomes instead of relying on a single static forecast. It is also useful for funding discussions because investors and lenders often want to see how resilient the business is if sales are lower than expected or costs increase. The component supports better decision-making by showing what must happen for the nursery to remain cash-positive and profitable under different market conditions.
Professional Charts
The professional charts component turns the financial forecast into visual outputs that are easier to interpret, explain, and present. Instead of relying only on rows of numbers, the Garden Nursery Financial Model can display trends in revenue, profitability, cash flow, cost structure, margins, and other key financial indicators over the forecast period. These charts help users identify whether the nursery is growing steadily, whether margins are improving, whether operating expenses are scaling appropriately, and whether cash balances remain strong enough to support inventory purchases and day-to-day operations. For a garden nursery, visual reporting can be especially helpful because the business may include multiple revenue streams and seasonal changes that are easier to understand in chart form. The charts can support investor presentations, lender meetings, internal planning reviews, and business plan exhibits by giving stakeholders a clear visual view of the forecast. They also help users detect problems faster, such as expenses rising faster than sales, cash balances dipping during slower months, or revenue concentration in one category. By making the model presentation-ready, the charts reduce the time needed to convert financial calculations into useful business communication.
ROE Components and DuPont Analysis
The ROE components and DuPont analysis section helps users understand what is driving return on equity in the garden nursery business. Instead of looking only at a single return figure, this component breaks performance into underlying drivers such as profitability, asset efficiency, and financial leverage. This can help users see whether returns are being generated by strong margins, efficient use of assets, or the way the business is financed. For a garden nursery, this matters because the business may require investment in greenhouse structures, retail displays, vehicles, equipment, inventory, and working capital. If those assets are not being used efficiently, revenue growth may not translate into attractive investor returns. The DuPont-style view can help users evaluate whether margins are healthy enough, whether capital investments are producing enough sales, and whether the business is relying too heavily on debt or equity funding. It is particularly useful for investor discussions because it explains the quality of returns rather than simply presenting a headline number. Owners can use this section to improve financial strategy, compare alternative capital structures, and decide whether to lease, buy, expand, or delay certain investments based on their effect on overall return.
Revenue Inputs
The revenue inputs component is where users define the commercial assumptions that drive the top line of the Garden Nursery Financial Model. It can include revenue streams such as Plants and Starts, Houseplants, Gardening Supplies, and Workshops, with assumptions for unit sales, pricing, annual growth, and potential price increases over time. This section is important because revenue forecasting for a garden nursery depends on both product volume and customer purchasing behavior. A nursery may sell high volumes of lower-priced seasonal plants, fewer units of higher-priced houseplants, add-on products such as soil and tools, and event-based revenue from classes or workshops. By separating these assumptions, the model allows users to build a more realistic forecast than a single generic sales line. The inputs can be adjusted to reflect the local market, retail space, inventory capacity, pricing strategy, seasonality, and marketing plan. The output helps generate projected revenue by category and by year, which then flows into profitability, cash flow, and financial statement calculations. This component is useful for planning because it helps users test whether expected customer demand is sufficient to support the nursery’s costs and whether changes in pricing, product mix, or sales volume could improve the business model.
Bank-Ready Reports
The bank-ready reports component organizes the financial outputs in a format that can support lender review, funding applications, and professional stakeholder communication. Banks and lenders typically want to see clear financial statements, reasonable assumptions, cash flow capacity, debt repayment ability, profitability trends, and evidence that the borrower understands the economics of the business. This section helps present those outputs in a structured way by connecting the model’s assumptions to projected income statements, cash flow forecasts, balance sheet estimates, and key performance measures. For a garden nursery seeking startup or expansion funding, this can be helpful when requesting capital for greenhouse construction, retail fixtures, delivery vehicles, initial inventory, working capital, or leasehold improvements. The reports allow users to show how borrowed funds may be used, how the business expects to generate cash, and whether projected cash flow can support repayments. Because the format is designed to be lender-friendly, it reduces the need to manually rework the forecast into separate documents. It also helps users prepare for questions from banks by making the financial logic easier to review, from revenue assumptions and direct costs to operating expenses and available cash.
Revenue Breakdown
The revenue breakdown component provides a more detailed view of how total sales are generated across the nursery’s different income streams. Rather than treating the business as one broad revenue line, it separates the model into categories such as plants, starts, houseplants, gardening supplies, and workshops, allowing users to understand which areas contribute most to total revenue and growth. This is useful because each revenue stream may have different pricing, margins, seasonality, inventory requirements, and growth potential. For example, plants and starts may generate significant seasonal volume, houseplants may offer steady year-round demand, gardening supplies may increase average transaction value, and workshops may create both direct income and customer engagement. The revenue breakdown helps users evaluate whether the business is too dependent on one category or whether a broader mix could improve stability and profitability. It can also support decisions about inventory purchasing, merchandising, marketing campaigns, workshop scheduling, and expansion priorities. By showing the contribution of each revenue stream over time, this component makes the forecast more transparent and gives owners a clearer basis for setting sales targets, measuring performance, and explaining the business model to investors, lenders, partners, or management teams.
KPI Dashboard
The KPI dashboard component focuses on the performance metrics that help users monitor the financial health and operating efficiency of the garden nursery. It can include indicators such as revenue growth, gross margin, EBITDA, net profit margin, cash balance, return metrics, payback period, break-even timing, and other benchmarks that show whether the business is moving in the right direction. For a nursery business, KPIs are valuable because sales alone do not tell the full story. A business may have strong revenue but weak cash flow if inventory purchases are poorly timed, or it may have attractive gross margins but excessive payroll, rent, utilities, or marketing costs. The KPI dashboard helps users identify these issues quickly and compare performance against internal goals or industry expectations. It is also useful for ongoing management after launch, because owners can update assumptions or actual results and use the dashboard to track progress. For consultants and analysts, the KPI view provides a concise way to evaluate the model and explain the main drivers of success. For investors and lenders, it provides a quick reference point for the metrics they care about most, helping make the financial plan easier to understand and evaluate.
Startup Cost Planning
The startup cost planning component helps users estimate the initial capital required to open or prepare the garden nursery for operations. This section may include greenhouse structures, retail fixtures and displays, delivery vehicles, initial plant inventory, gardening supplies inventory, equipment, signage, deposits, licenses, insurance, technology, marketing launch costs, leasehold improvements, and working capital reserves. For a garden nursery, startup costs can be significant because the business often needs physical infrastructure, product inventory, customer-facing retail space, and operational tools before meaningful revenue begins. The model helps users organize these one-time investments and understand how they affect funding needs, cash flow, balance sheet projections, and payback timing. This is especially useful when preparing a business plan or funding request because lenders and investors want to know exactly how much money is needed and how it will be used. By separating startup costs from ongoing operating expenses, the component helps users avoid underestimating launch capital and reduces the risk of early cash shortages. It also allows founders to compare different opening strategies, such as buying versus leasing a vehicle, starting with a smaller greenhouse, delaying certain improvements, or increasing initial inventory to support a larger launch.
Break-Even Analysis
The break-even analysis component helps users identify when the garden nursery is expected to become profitable and what level of sales is needed to cover costs. It connects revenue assumptions, gross margins, direct costs, payroll, rent, utilities, marketing, administrative expenses, and other operating costs to determine the point at which the business can support itself from operations. This is one of the most important planning tools for a nursery because early-stage businesses often face substantial upfront investment and recurring monthly expenses before revenue stabilizes. The break-even view helps users understand how many units must be sold, how much revenue must be generated, or how quickly sales must ramp up to reach profitability. It also shows how changes in pricing, sales volume, cost of goods sold, staffing, or overhead can move the break-even point earlier or later. This information is valuable for founders deciding how aggressively to market, how much inventory to purchase, how many employees to hire, and how much working capital to maintain. It is also useful for investors and lenders because it demonstrates when the business may stop relying on external funding and begin generating sustainable profit. By including break-even analysis, the model supports more disciplined decision-making and helps users plan for both launch risk and long-term viability.
File types:
Excel – Single-User: .xlsx
Excel – Multi-User: .xlsx
Similar ProductsOther customers were also interested in...


 HenrySheykin
Cattle Farming Financial Model Excel Template
The Cattle Farming Financial Model helps users turn a cattle farm concept, expansion plan, or fundin... Read more
Hydroponics Financial Model Excel Template
The Hydroponic Farming Financial Model helps entrepreneurs, growers, consultants, analysts, and busi... Read more
Hemp Farming Financial Model Excel Template
The Hemp Farming Financial Model Template helps entrepreneurs, farm owners, consultants, analysts, a... Read more

Dairy Farming Financial Model Excel Template
Purchase Dairy Farming Financial Projection. Sources & Uses, Profit & Loss, Cash Flow statem... Read more
Aquaponics Financial Model Excel Template
The Commercial Aquaponics Financial Model helps users turn a capital-intensive aquaponics concept in... Read more
Sheep Farming Financial Model Excel Template
The Sheep Farming Financial Model helps entrepreneurs, farm owners, consultants, analysts, and busin... Read more
Horse Boarding Financial Model Excel Template
The Horse Boarding Financial Model helps turn a stable, equestrian center, or horse boarding concept... Read more
Garlic Farming Financial Model Excel Template
The Garlic Farming Financial Model helps entrepreneurs, growers, consultants, analysts, and business... Read more
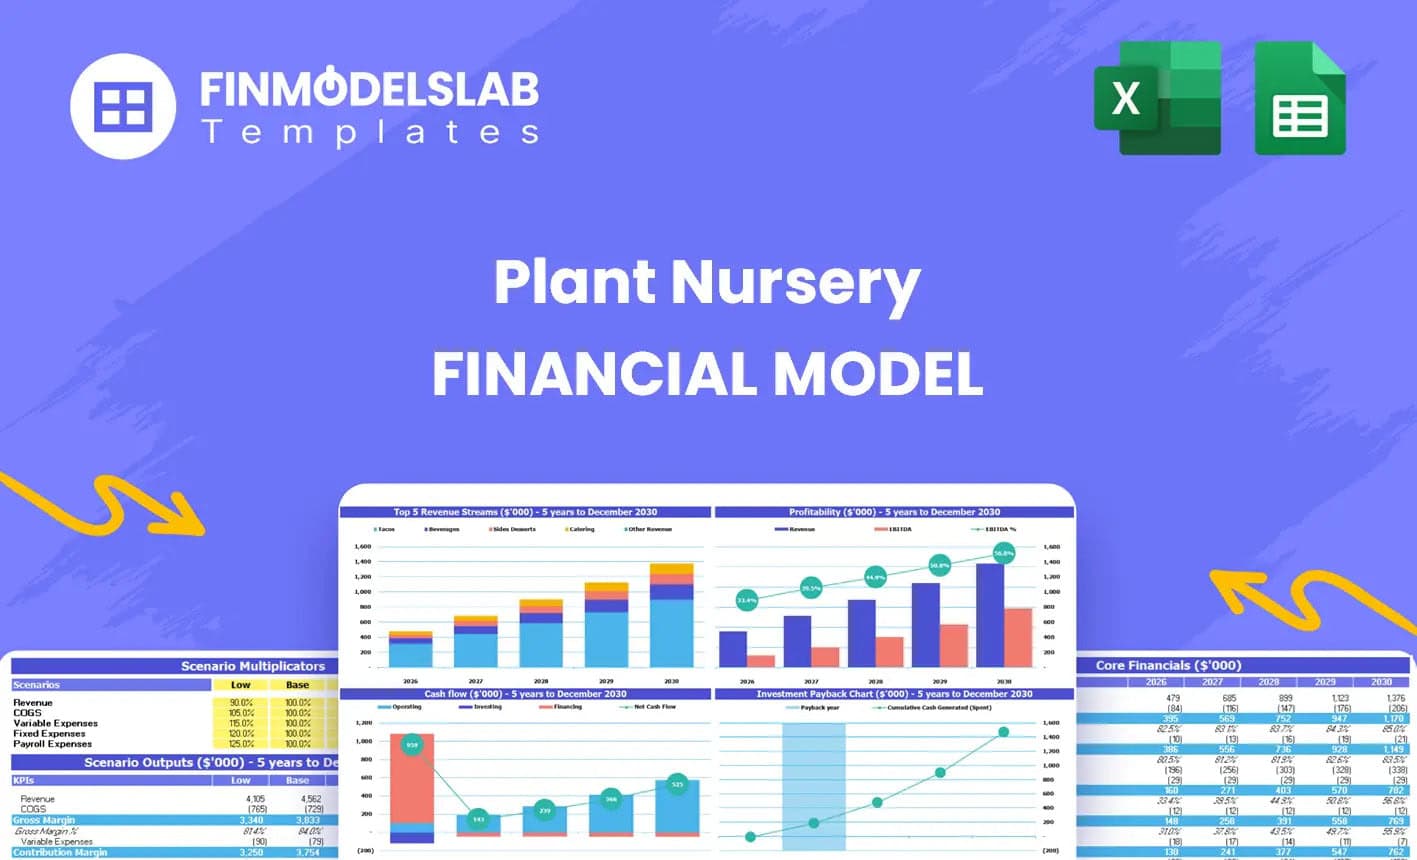
Plant Nursery Financial Model Template
The Plant Nursery Financial Model helps entrepreneurs, nursery owners, consultants, analysts, and bu... Read more
Cow-Calf Operation Financial Model Excel Template
The Cow-Calf Operation Financial Model helps ranch owners, agricultural entrepreneurs, consultants, ... Read more
You must log in to submit a review.