
0 ITEMS

Manufacturing Company Financial Model Excel – 10-Year, BOM, Inventory, Production Capacity, 3 Statements & DCF
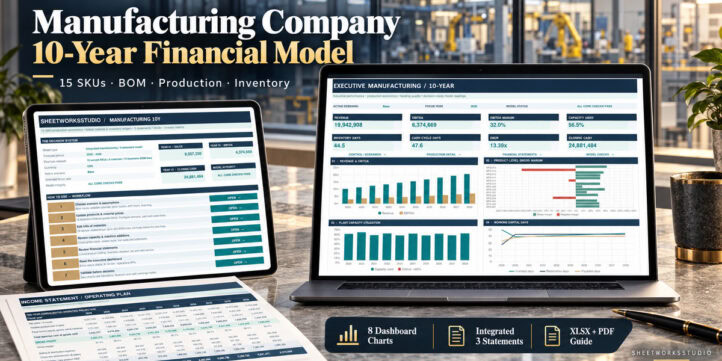
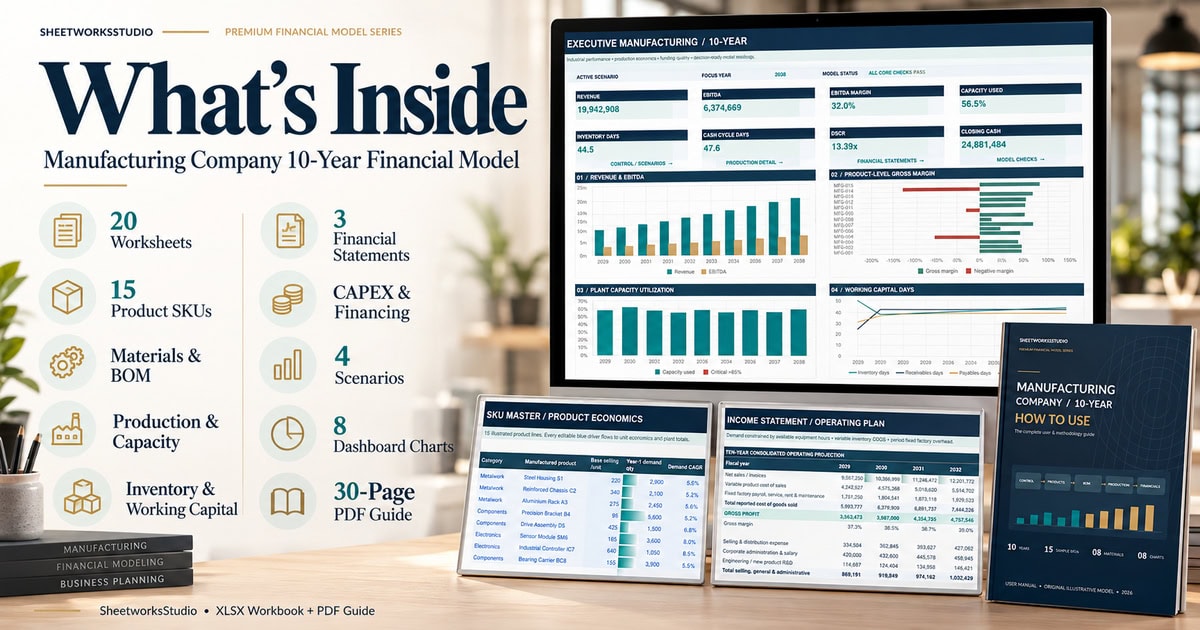
An integrated 10-year manufacturing Excel financial model linking 15 product slots, 8 materials, a 500-line BOM, factory capacity, inventory costing, equipment financing, three financial statements and DCF valuation. Includes 20 worksheets, 8 native charts, Base/Upside/Downside/Disruption scenarios, a 120-month operating presentation and a 30-page PDF user guide.
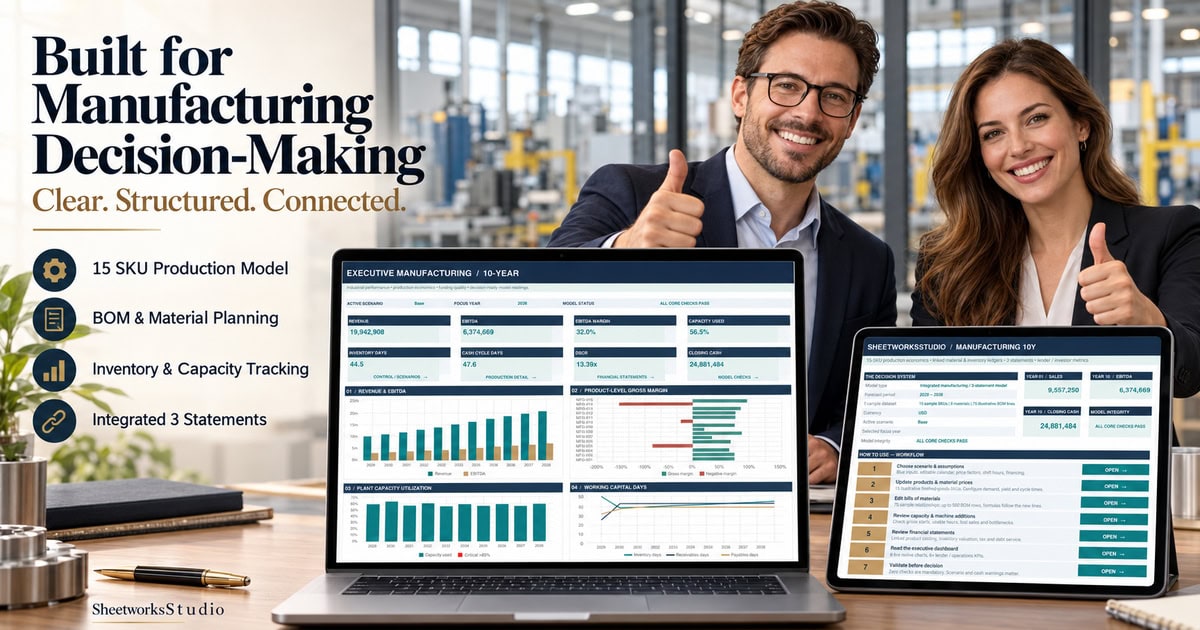
MANUFACTURING COMPANY FINANCIAL MODEL – 10-YEAR SIGNATURE EDITION
From Product Demand and Bill-of-Materials Planning to Factory Capacity, Inventory, Financing and Valuation — One Connected Excel Financial Model.
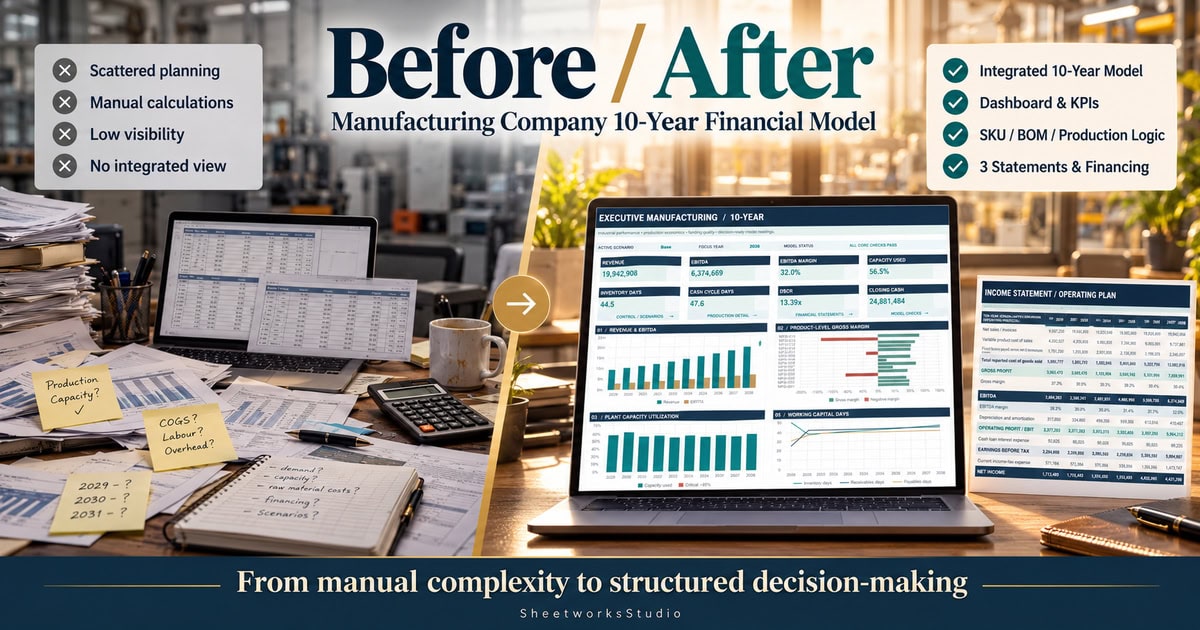
The Manufacturing Company 10-Year Financial Model by SheetworksStudio transforms industrial operating assumptions into a comprehensive, fully editable financial forecast.
Built around a 10-year integrated financial framework, the model connects product demand, raw materials, production capacity, manufacturing costs, inventory movements, equipment investment, debt financing, three financial statements and discounted cash flow valuation.
Designed for manufacturing business owners, CFOs, FP&A professionals, operations managers, industrial consultants and financial analysts, this workbook provides a structured foundation for evaluating long-term manufacturing performance and investment decisions.
The package includes 20 interconnected worksheets, eight native dashboard charts, four operating scenarios and a detailed 30-page English PDF user guide.
🏭 1. MANUFACTURING OPERATIONS & PRODUCT ECONOMICS
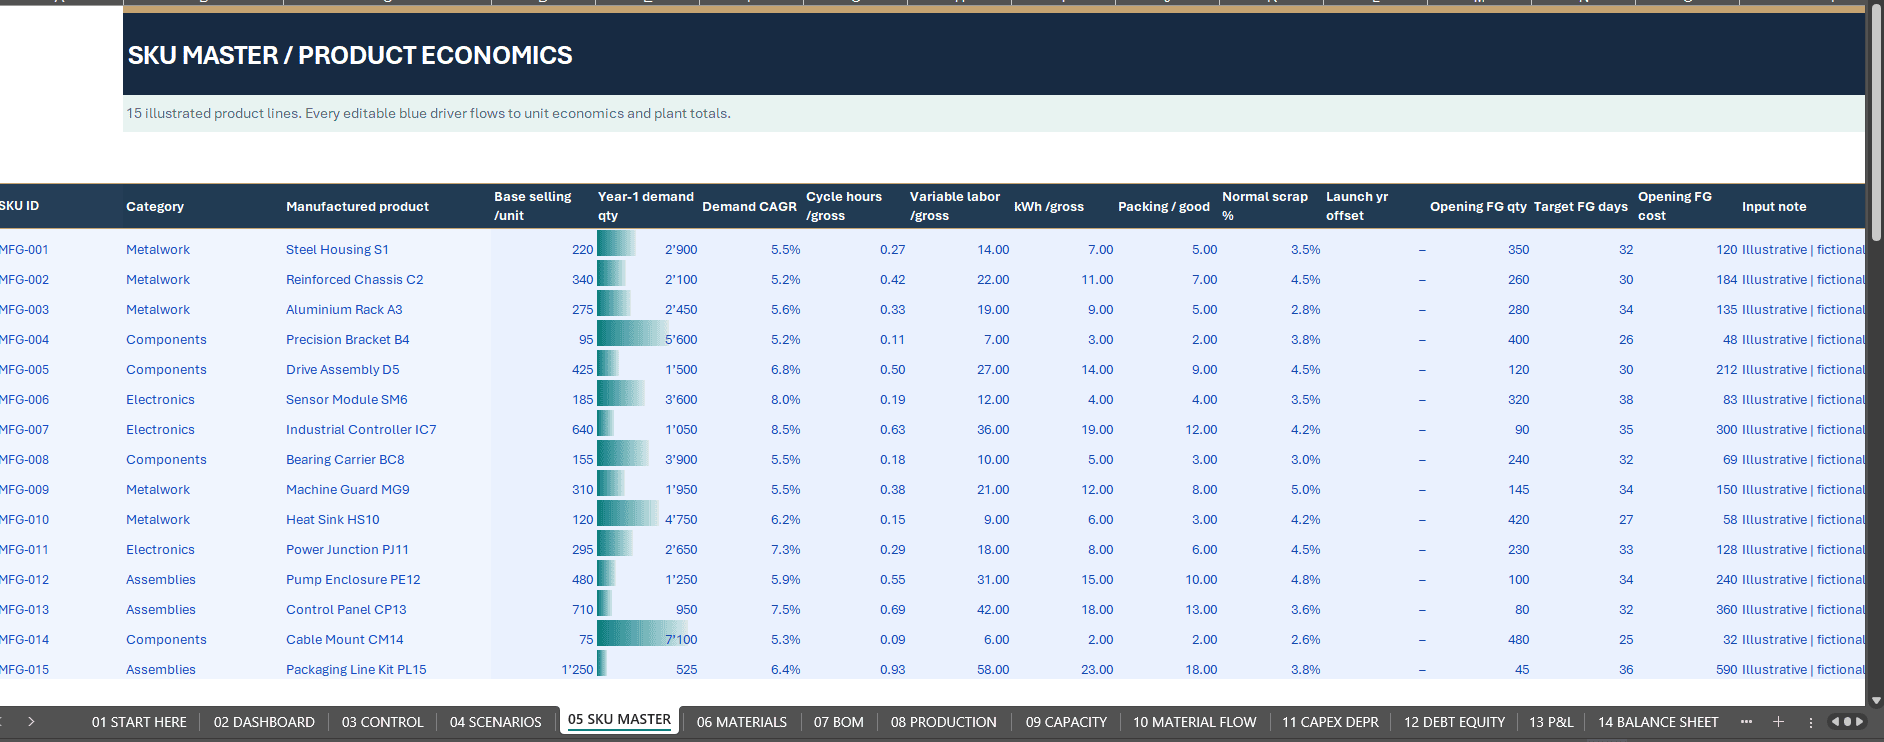
Build a connected production and financial forecast around 15 configurable product slots, prepopulated with fictional manufacturing examples.
Product-Level Modeling Features:
- Selling Prices and Annual Price Escalation
- Product Demand and Demand Growth
- Processing Hours per Unit
- Variable Manufacturing Labor
- Energy Consumption
- Packaging Expenses
- Normal Production Scrap
- Finished-Goods Opening Inventory
- Inventory Target Days
- Product Launch Timing
- Product-Level Revenue and Gross Margin
The integrated production engine calculates planned manufacturing requirements, actual production, good output, customer shipments and closing inventory.
Production requirements connect directly to installed factory capacity, helping users understand how machinery constraints influence deliveries, revenue and profitability.
Evaluate Which Products Generate Attractive Margins, Where Production Bottlenecks Occur and How Changes in Demand Affect the Manufacturing Business.
📦 2. MATERIALS, BILL OF MATERIALS & INVENTORY COSTING
Connect individual products to eight configurable raw-material records using a detailed bill-of-materials framework.
Bill of Materials Features:
- 75 Fictional Illustrative BOM Entries
- Prepared Capacity for 500 Component Lines
- SKU-to-Material Relationships
- Material Consumption per Gross Production Start
- Handling-Loss Assumptions
- Raw-Material Purchase Requirements
- Material Price Escalation
- Production Material Cost Calculations
Inventory Management Features:
- Opening Raw-Material Quantities
- Raw-Material Purchases
- Material Consumption
- Target Closing Inventory
- Raw-Material Weighted-Average Cost
- Finished-Goods Production
- Finished-Goods Inventory Valuation
- Product-Level Cost of Goods Sold
The model applies weighted-average costing conventions to raw materials and finished goods.
Finished-goods inventory carries variable manufacturing costs, while fixed factory overhead is recognized through current-period cost of goods sold.
This creates an integrated relationship between production activity, inventory balances, cost recognition and working capital.
⚙️ 3. FACTORY CAPACITY, PRODUCTIVITY & OPERATING COSTS
Analyze whether the manufacturing operation has sufficient capacity to meet forecast customer demand.
Factory Capacity Drivers Include:
- Installed Manufacturing Lines
- Annual Production Days
- Shifts per Production Day
- Operating Hours per Shift
- Machine Processing Requirements
- Factory Productivity Factors
- Unplanned Downtime
- Production Scrap
- Additional Equipment Capacity
- Effective Machine-Hour Availability
When required production hours exceed available manufacturing capacity, the model constrains actual production and allocates capacity proportionally across planned product requirements.
Operating Expense Planning Includes:
- Factory Workforce Costs
- Manufacturing Labor Inflation
- Electricity and Energy Expenses
- Machinery Maintenance
- Factory Rent
- Factory Services
- Selling and Distribution Costs
- Administration and Corporate Payroll
- Product Engineering and R&D
The integrated operating model helps users evaluate the impact of productivity, staffing, machinery additions and cost inflation on manufacturing margins.
📊 4. PREMIUM EXECUTIVE DASHBOARD & MANUFACTURING KPIs
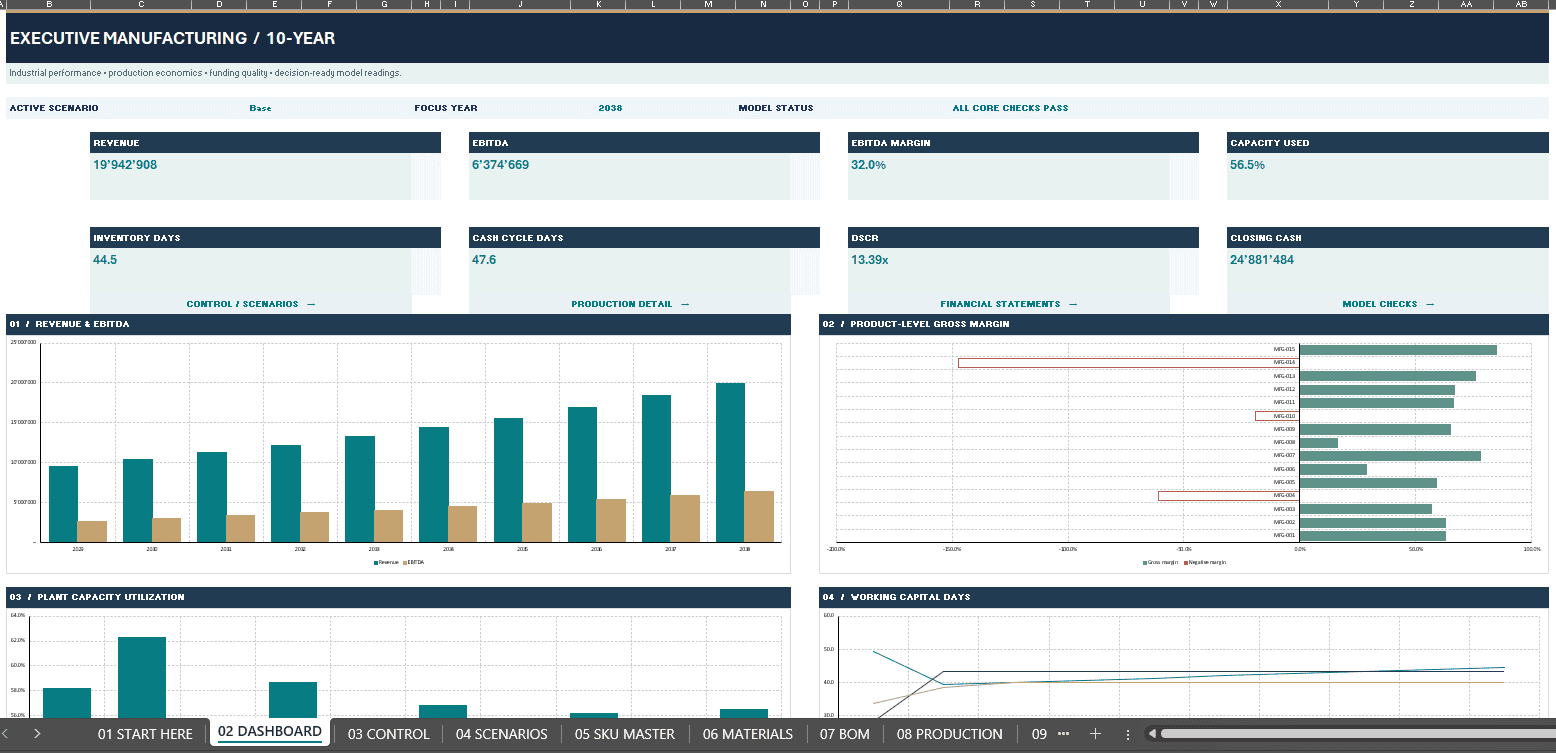
The professional Executive Dashboard presents critical manufacturing and financial indicators within an elegant navy, teal and muted-gold reporting environment.
Key Performance Indicators Include:
- Total Sales Revenue
- EBITDA
- EBITDA Margin
- Factory Capacity Utilization
- Inventory Days
- Cash Conversion Cycle
- Debt Service Coverage Ratio (DSCR)
- Closing Cash Balance
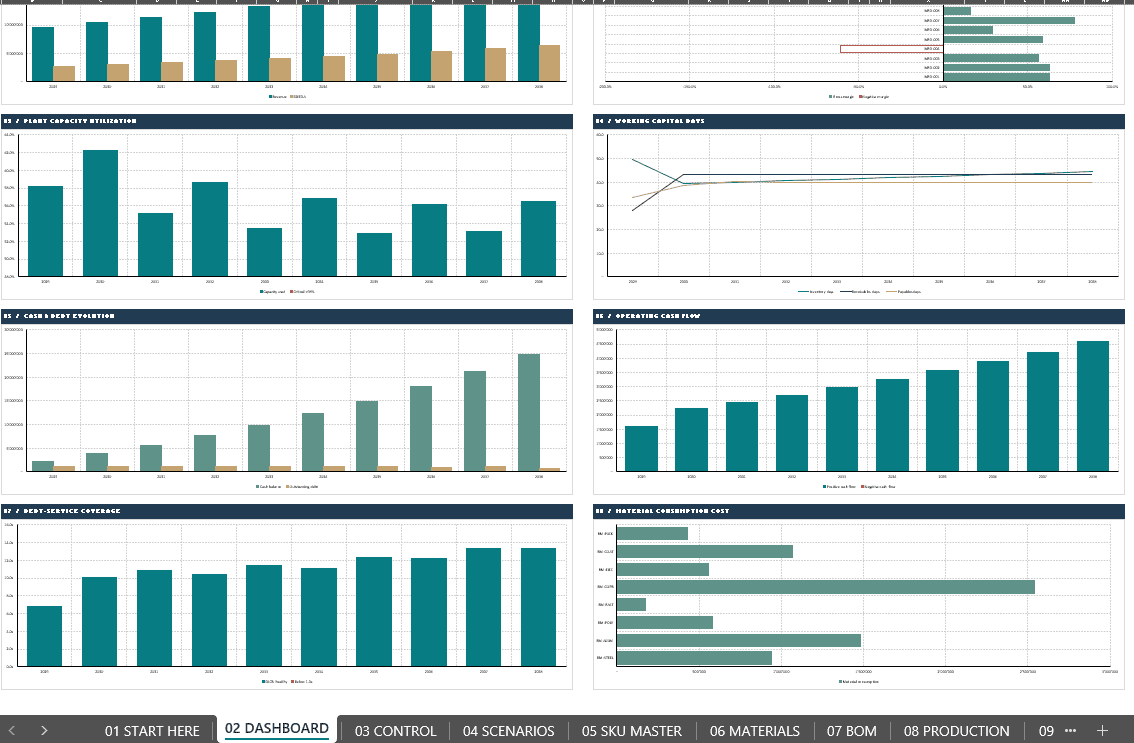
The dashboard includes eight native, data-linked Excel charts:
- Revenue and EBITDA Performance
- Product-Level Gross Margins
- Plant Capacity Utilization
- Working Capital Days
- Cash and Debt Evolution
- Operating Cash Flow
- Debt Service Coverage
- Material Consumption Costs
A selectable forecast year allows users to focus on specific annual results.
Color-coded indicators help identify negative product margins and selected operating or financing risks.
📈 5. INTEGRATED THREE FINANCIAL STATEMENTS
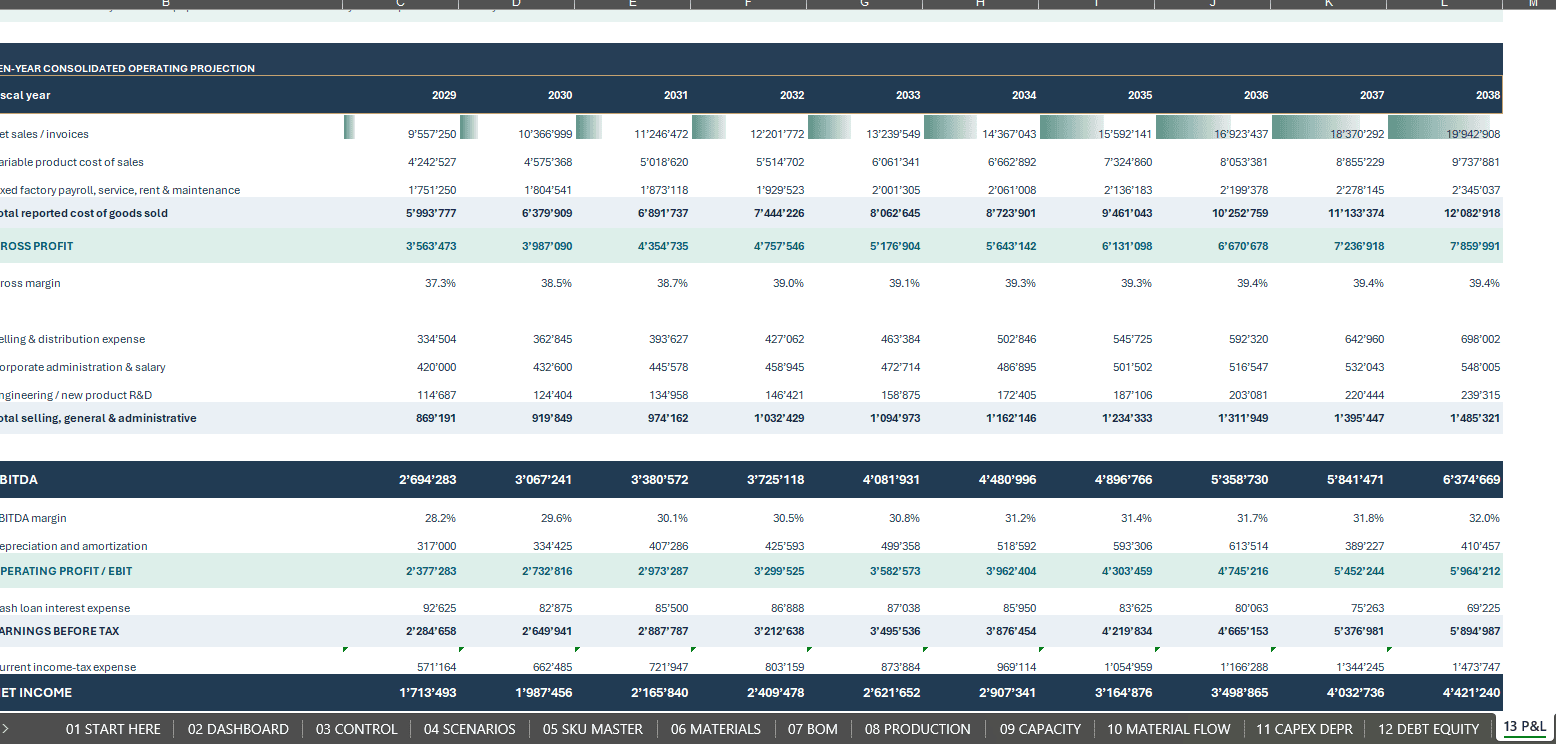
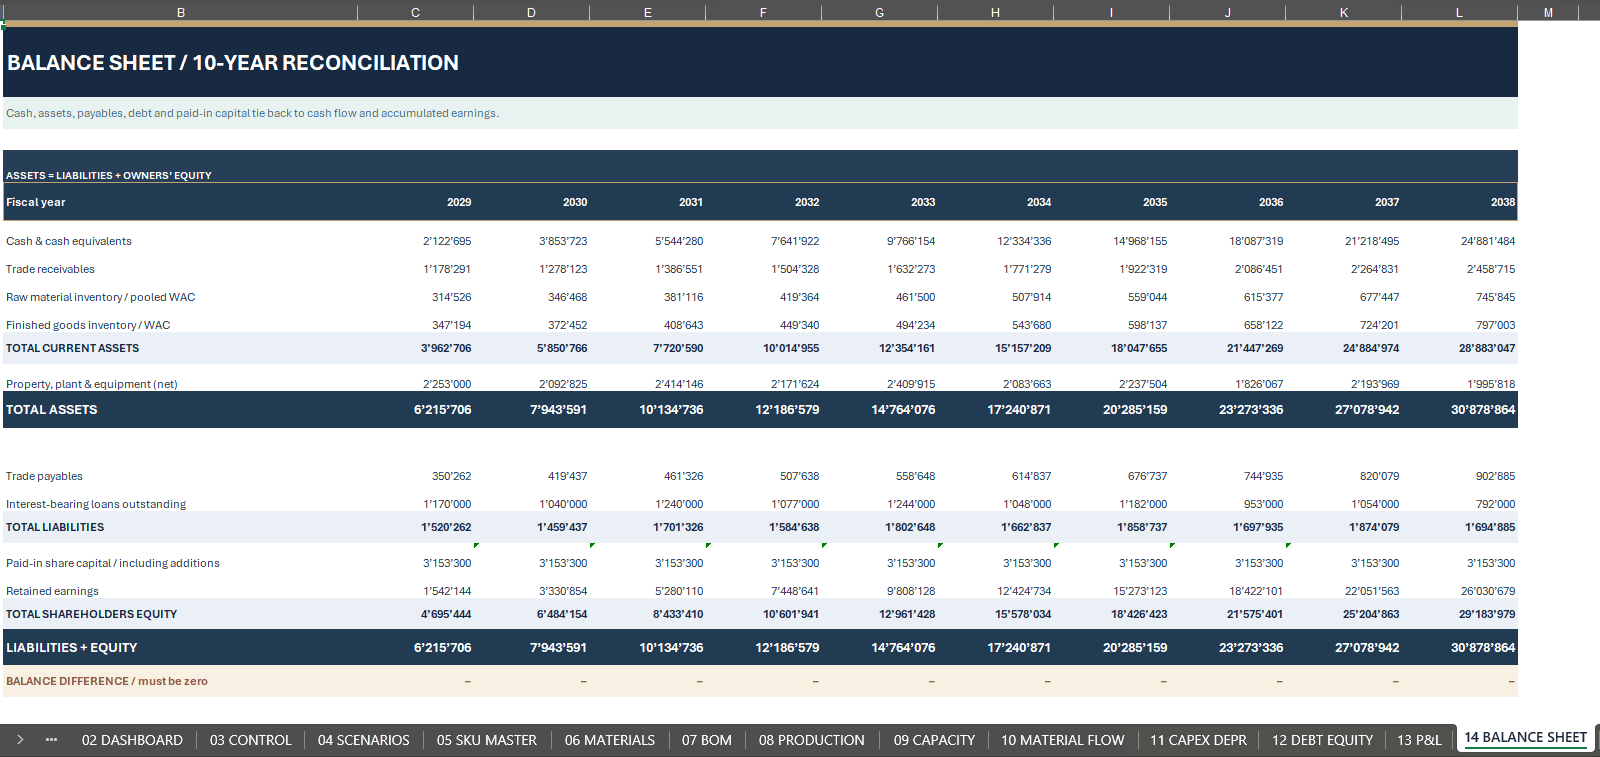
The workbook produces 10 connected annual financial reporting periods, with a default illustrative forecast from 2029 through 2038.
Integrated Financial Statements:
- Income Statement / Profit & Loss
- Balance Sheet
- Cash Flow Statement
These financial statements connect product sales, variable manufacturing costs, fixed factory overhead, operating expenses, working capital, capital expenditures, depreciation, borrowing, taxes and shareholder equity.
Supporting Financial Schedules Include:
- Manufacturing Revenue Forecast
- Cost of Goods Sold
- Inventory and Working Capital
- Machinery CAPEX
- Depreciation
- Debt Financing
- Interest Expense
- Equity Contributions
- Dividends
- Operating and Free Cash Flow
A separate 120-month operating presentation distributes selected annual forecast metrics using editable seasonal weights.
Important: The monthly presentation is derived from the annual forecast and is not a separate, independently integrated monthly three-statement financial model.
💼 6. EQUIPMENT INVESTMENT, FINANCING & DCF VALUATION
Evaluate the financial implications of machinery investment, equipment financing and long-term business value.
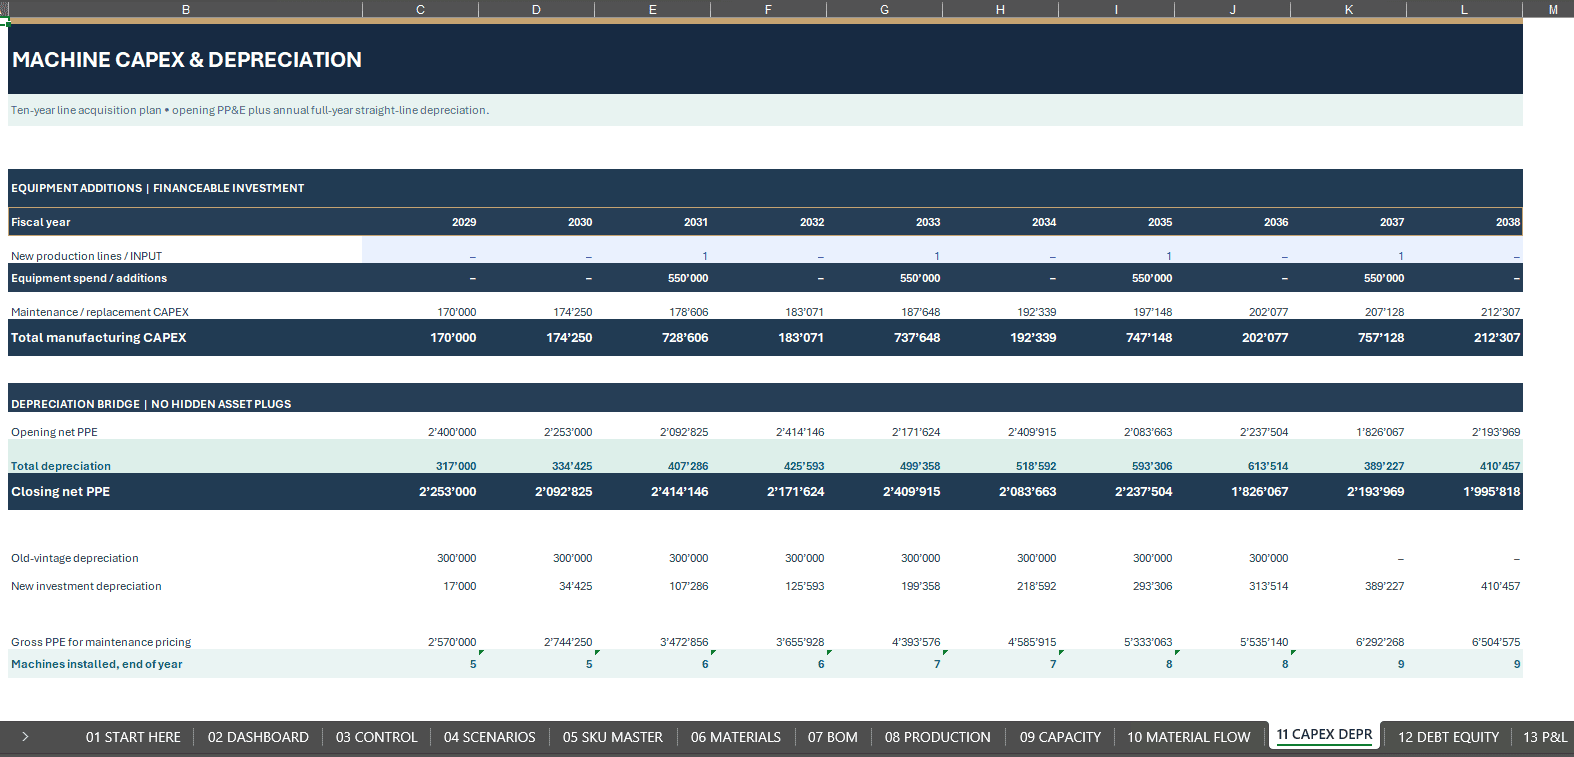
Capital Investment Features:
- Additional Production-Line CAPEX
- Equipment Investment Scheduling
- Routine Maintenance CAPEX
- Machinery Depreciation
- Installed Production-Line Tracking
- Equipment Financing Assumptions
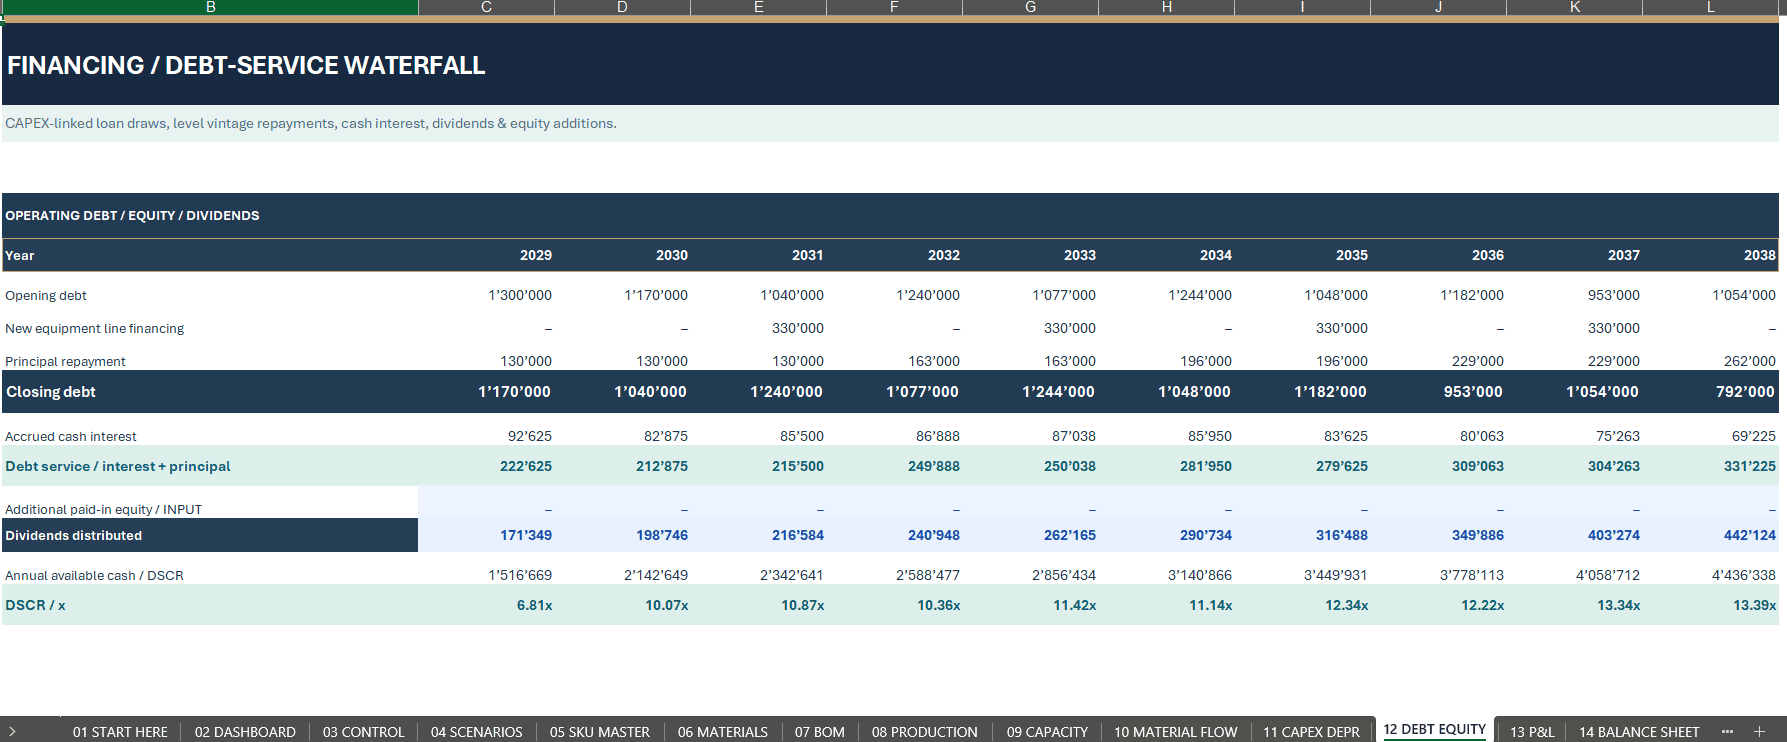
Debt & Equity Features:
- Equipment Loan Drawdowns
- Scheduled Principal Repayments
- Loan Interest Calculations
- Closing Debt Balances
- Equity Contributions
- Dividend Assumptions
- Debt Service Coverage
- Liquidity and Leverage Indicators
New equipment borrowing is linked to additional production-line investments. Routine maintenance CAPEX is funded from cash.
Financing shortfalls remain visible in the financial model rather than being automatically covered by an artificial funding plug.
Business Valuation Features:
- Free Cash Flow to Firm (FCFF)
- Discounted Cash Flow (DCF)
- Enterprise Value
- Equity Value Bridge
- Editable Discount Rate
- Terminal Perpetuity Growth Rate
- Working Capital Adjustments
The DCF framework connects operating profitability, cash taxes, capital expenditure and changes in working capital to estimated enterprise value.
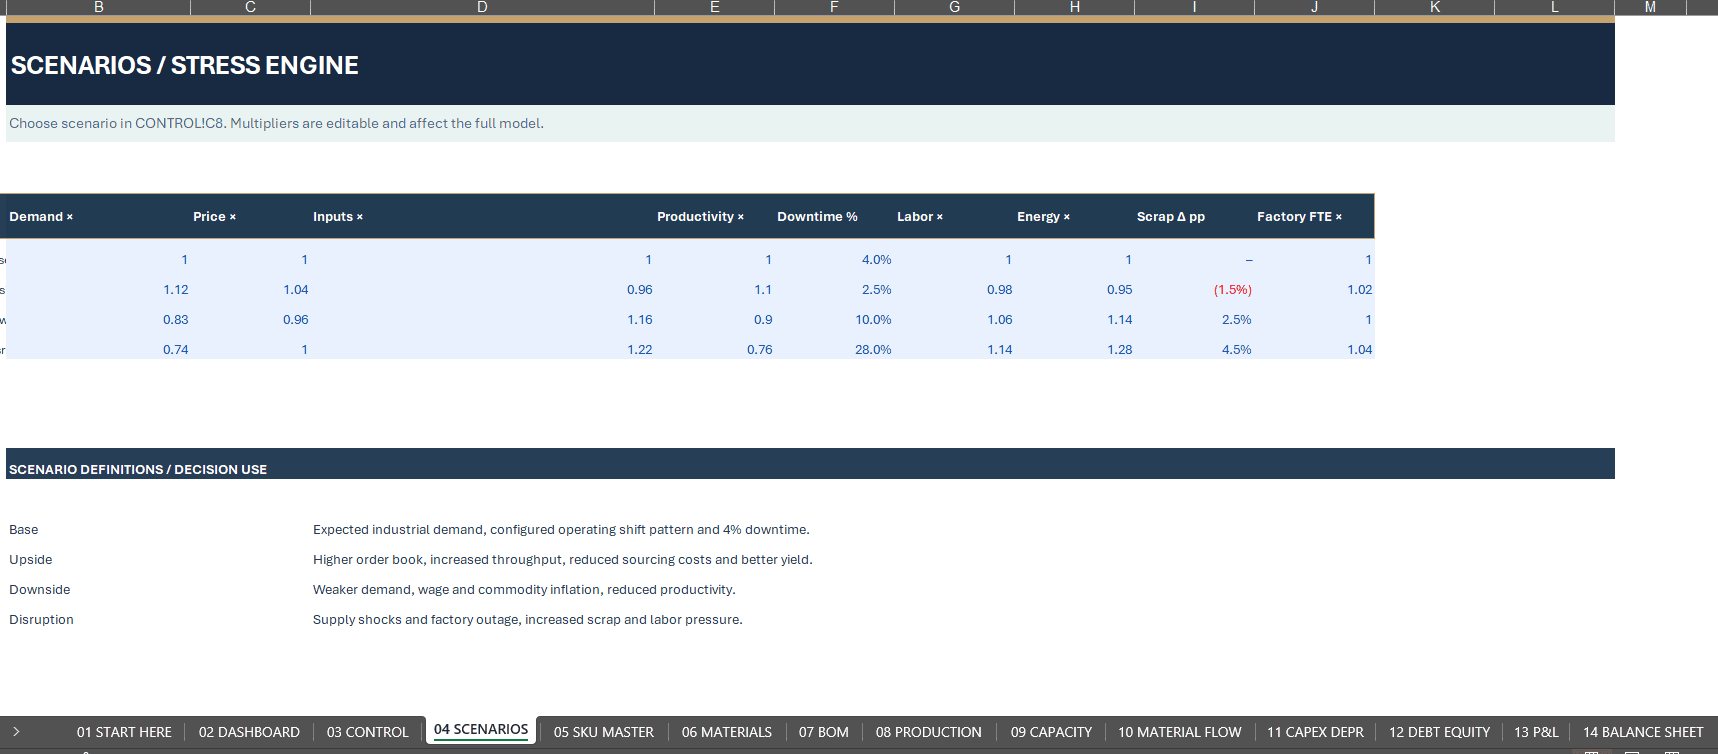
🔄 7. BASE, UPSIDE, DOWNSIDE & DISRUPTION SCENARIOS
Evaluate alternative manufacturing conditions using four selectable operating scenarios.
Available Scenarios:
- Base
- Upside
- Downside
- Disruption
Editable Scenario Drivers Include:
- Product Demand
- Selling Prices
- Raw-Material Costs
- Factory Productivity
- Manufacturing Downtime
- Variable Labor Expenses
- Electricity Costs
- Production Scrap
- Factory Staffing Requirements
Scenario changes flow through the operating engine and connected financial calculations.
Users can compare projected sales, manufacturing costs, operating profitability, inventory requirements and financial outcomes across different business conditions.
Two-Way Sensitivity Analysis
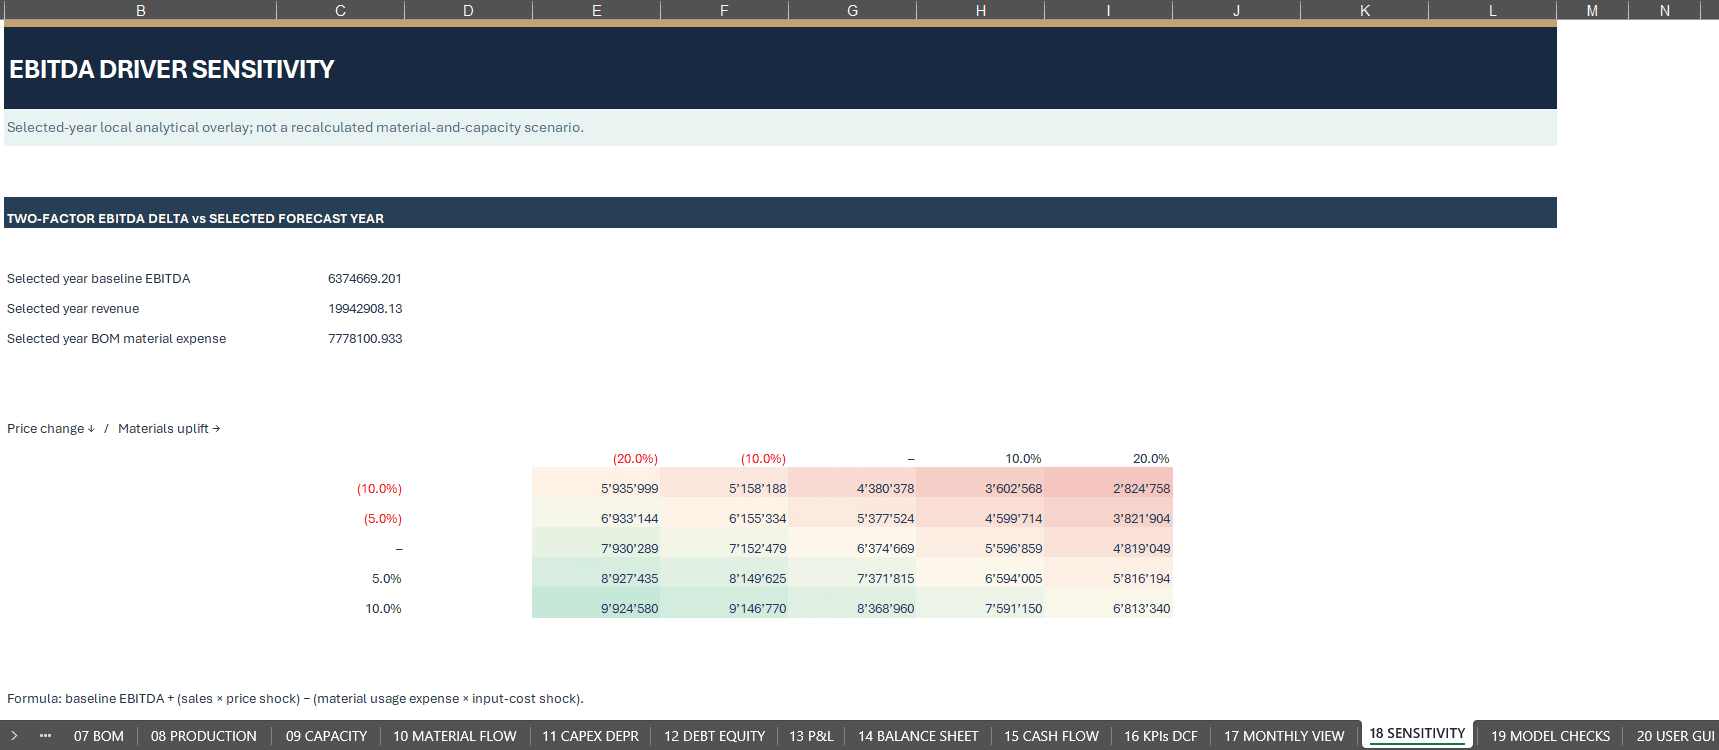
A dedicated sensitivity worksheet evaluates the approximate EBITDA impact of changing selling prices and material costs.
The sensitivity grid uses a linear calculation approach and is not a complete recalculation of all operating, financing and tax schedules.
✅ 8. MODEL INTEGRITY & FINANCIAL CONTROLS
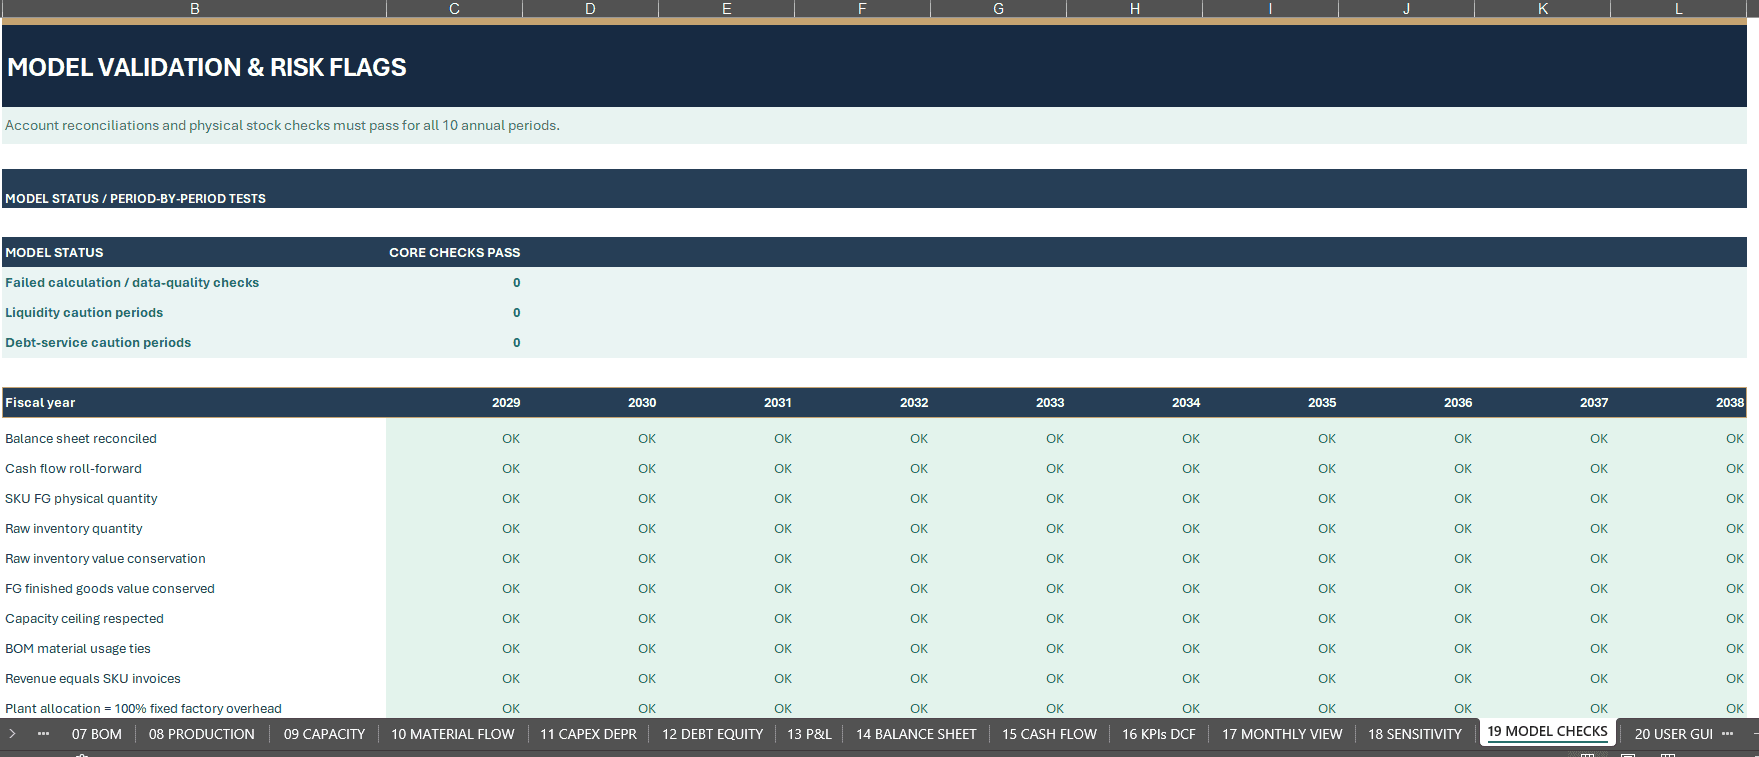
The dedicated MODEL CHECKS worksheet supports the review of financial consistency, production calculations and master-data quality.
Integrated Control Areas Include:
- Balance Sheet Reconciliation
- Cash Flow Roll-Forward
- Finished-Goods Inventory Quantities
- Raw-Material Inventory Quantities
- Inventory Value Conservation
- Production Capacity Constraints
- BOM Material Consumption
- Manufacturing Revenue Reconciliation
- Fixed Factory Overhead Allocation
- Debt Balance Continuity
- Product and Material Identifier Validation
- BOM Reference Validation
- Scenario Input Validity
- Discount-Rate and Terminal-Growth Constraints
Additional financial and operational warnings help identify negative liquidity, low debt-service coverage, unmet customer demand, operating losses and production capacity pressure.
A passing model integrity check confirms only the programmed reconciliation relationships. It does not guarantee commercial feasibility, sufficient liquidity or acceptable investment risk.
📚 9. WHAT’S INCLUDED
FILE 1 — MANUFACTURING 10-YEAR FINANCIAL MODEL (.XLSX)
One editable Excel workbook containing:
- 20 Connected Worksheets
- 10 Annual Forecast Periods
- 15 Configurable Product Slots
- 8 Raw-Material Master Records
- 75 Illustrative BOM Entries
- 500 Prepared BOM Component Lines
- Ten-Year Product and Inventory Schedules
- Production Capacity and Bottleneck Analysis
- Integrated Three Financial Statements
- Machinery CAPEX and Depreciation
- Debt and Equity Financing
- Four Operating Scenarios
- Eight Native Excel Dashboard Charts
- Two-Way EBITDA Sensitivity Analysis
- DCF Enterprise and Equity Valuation
- Financial Model Checks
- 120-Month Operating Presentation
FILE 2 — COMPLETE HOW-TO-USE GUIDE (.PDF)
A comprehensive 30-page English user manual covering:
- Initial Workbook Setup
- Navigation and Input Guidance
- Instructions for All 20 Worksheets
- Product and Material Master Data
- Bill of Materials Configuration
- Production Requirements and Capacity
- Raw-Material and Finished-Goods Inventory
- Manufacturing Cost Calculations
- Capital Investment and Financing
- Income Statement, Balance Sheet and Cash Flow
- DCF Valuation
- Scenario and Sensitivity Analysis
- Dashboard and KPI Interpretation
- Model Integrity Checks
- Troubleshooting
- Financial Modeling Conventions
- Manufacturing and Finance Terminology
- Final Model Review Checklist
Both purchased files are delivered together in one downloadable ZIP package.
10. WHO IS THIS FINANCIAL MODEL FOR?
Designed for:
- Manufacturing Business Owners
- Manufacturing CFOs and Finance Managers
- Financial Planning & Analysis Professionals
- Factory and Operations Managers
- Industrial Investment Analysts
- Business Valuation Analysts
- Manufacturing Consultants
- Financial Advisers
- Business Planning Professionals
- Entrepreneurs Evaluating Manufacturing Operations
The model is particularly suitable for businesses that can be represented within 15 product slots, eight material master records and an annual machine-hour-based manufacturing framework.
🧭 11. HOW TO USE
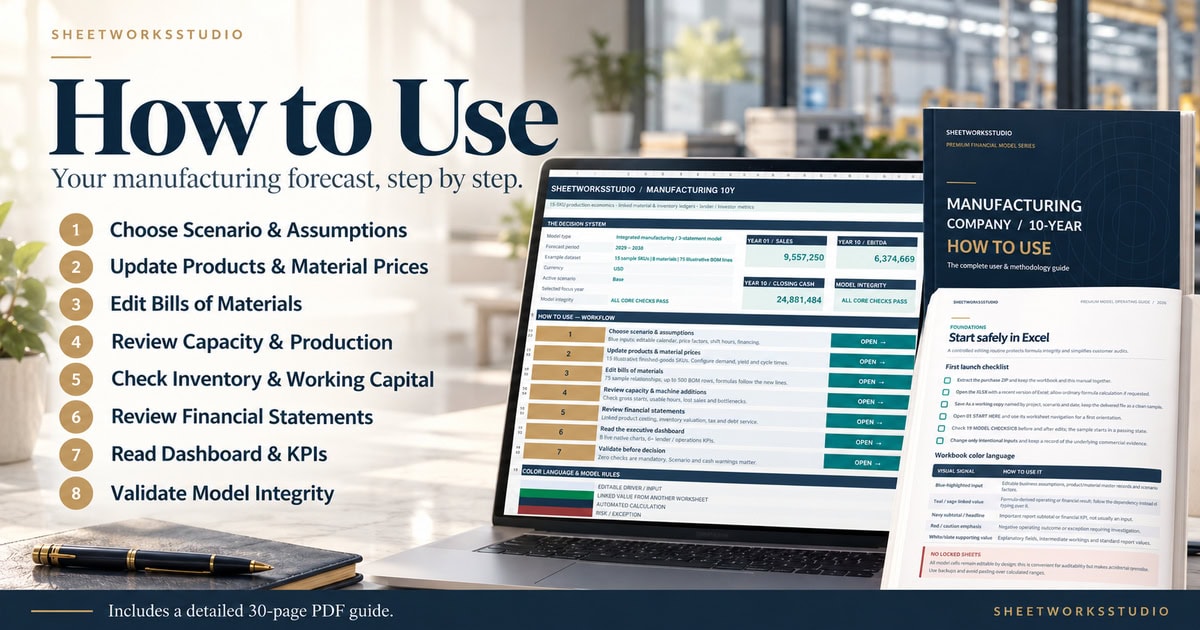
STEP 1 — CONFIGURE YOUR BUSINESS
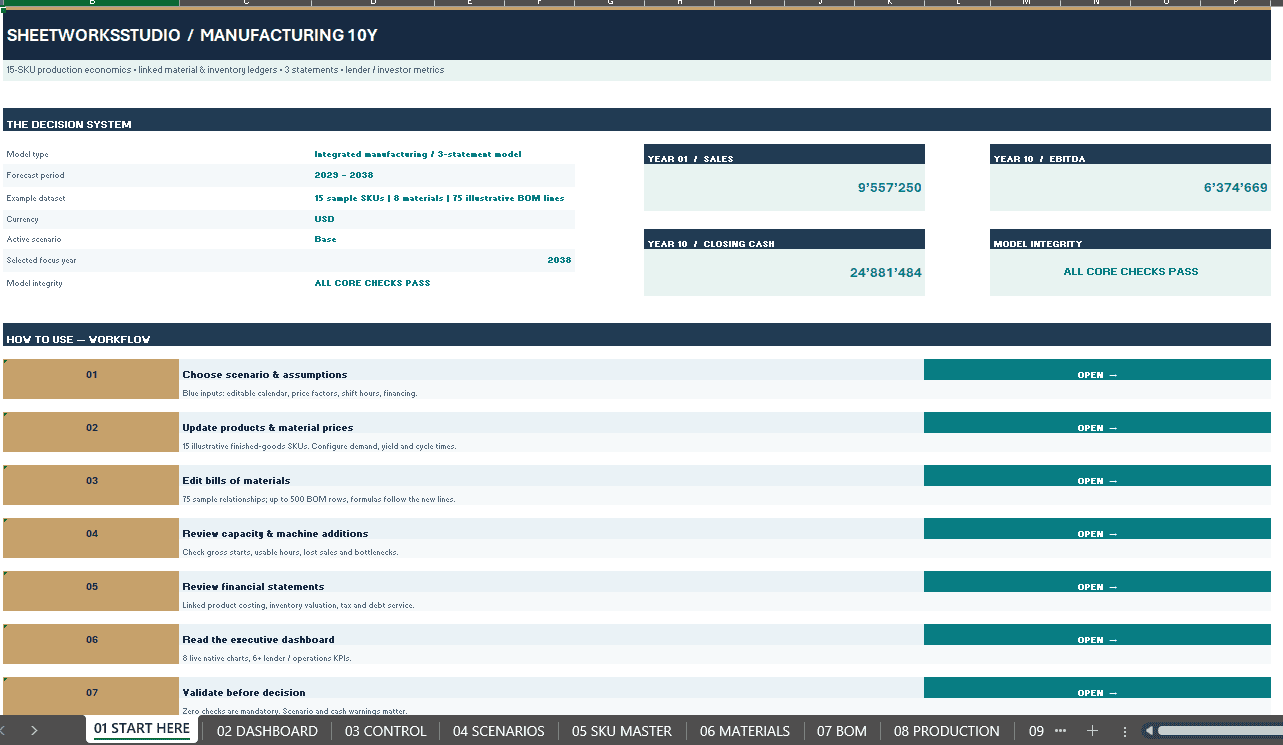
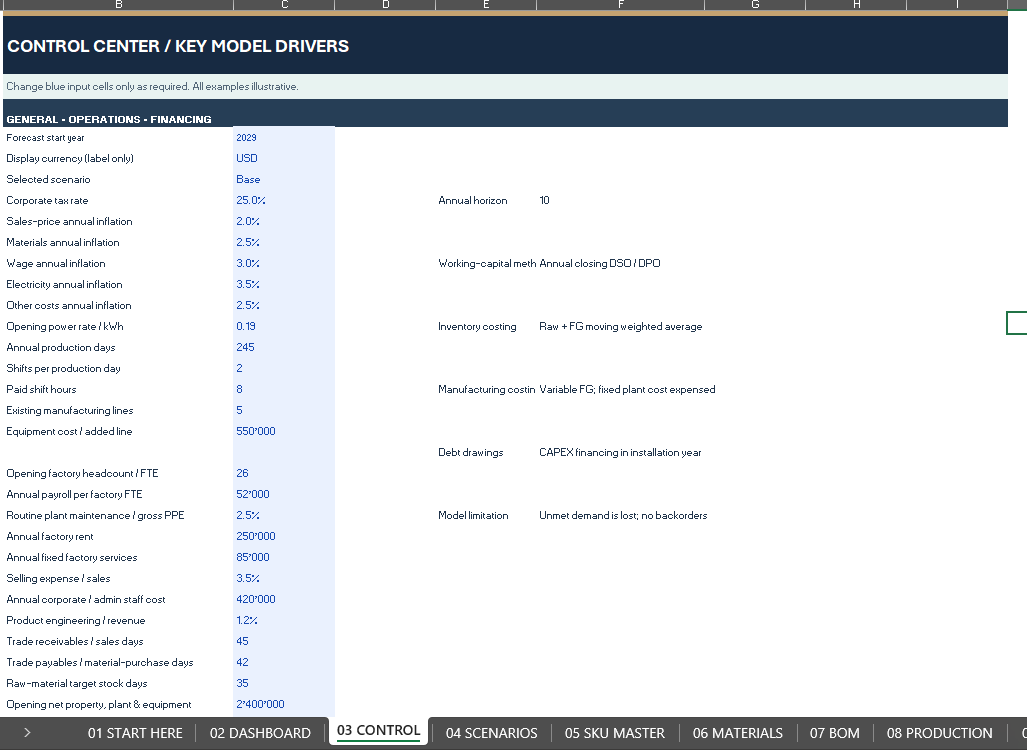
Review START HERE and set the forecast start year, reporting currency and operating scenario in CONTROL.
STEP 2 — CUSTOMIZE PRODUCT & MATERIAL ASSUMPTIONS
Replace fictional product records, raw-material data and bill-of-materials entries with your own supported assumptions.
STEP 3 — REVIEW PRODUCTION REQUIREMENTS
Analyze forecast demand, production starts, available machine-hours, capacity utilization, scrap and unmet orders.
STEP 4 — CONFIGURE CAPITAL INVESTMENT & FINANCING
Adjust production-line additions, routine maintenance CAPEX, financing rates, borrowing assumptions and equity contributions.
STEP 5 — ANALYZE FINANCIAL PERFORMANCE
Review the Executive Dashboard, Income Statement, Balance Sheet, Cash Flow Statement, working-capital indicators and DCF valuation.
STEP 6 — VALIDATE YOUR MODEL
Examine MODEL CHECKS and financial risk indicators before relying on the projected results.
12. TECHNICAL SPECIFICATIONS
- Product: Manufacturing Company Financial Model
- Forecast Horizon: 10 Annual Periods
- Default Illustrative Years: 2029–2038
- Worksheets: 20
- Native Excel Charts: 8
- Product Capacity: 15 Slots
- Raw Materials: 8 Records
- BOM Capacity: 500 Prepared Lines
- Illustrative BOM Records: 75
- Scenarios: Base, Upside, Downside, Disruption
- Financial Reporting: Three Integrated Annual Statements
- Monthly Presentation: 120 Months
- Valuation: Discounted Cash Flow
- Documentation: 30-Page English PDF Guide
- File Formats: XLSX + PDF
- Recommended Software: Microsoft Excel Desktop
- Macros / VBA: Not Required
- External Workbook Dependencies: None
- Delivery: Digital ZIP Download
Software Compatibility: Microsoft Excel Desktop is recommended. Google Sheets import and functional compatibility have not been independently verified. Equivalent calculations, charts, navigation, dropdowns and formatting are therefore not guaranteed.
The currency setting changes the displayed reporting label and does not perform automatic foreign-exchange conversion.
13. IMPORTANT MODEL LIMITATIONS & DISCLAIMER
The workbook contains fictional sample manufacturing assumptions for demonstration and educational financial modeling purposes.
The model uses simplified manufacturing, inventory, production, financing, accounting and taxation conventions.
The 15 product slots and eight material records are fixed within the supplied calculation structure. Expanding these master-data counts requires structural adjustments to the workbook.
Raw materials are assumed available for purchase as required. Supplier lead times, procurement supply limits, detailed work-in-progress accounting and customer backorder carryforwards are not modeled.
Tax calculations exclude tax-loss carryforwards and deferred tax.
The DCF valuation depends on user-selected operating and financial assumptions and does not constitute an independently certified business valuation.
All sample forecasts, financial results, investment values and risk indicators are illustrative and do not represent verified market predictions or investment recommendations.
Users should replace sample assumptions with independently supported company-specific inputs and seek appropriate financial, tax, accounting and legal advice before making business deci
Similar ProductsOther customers were also interested in...



 eFinancialModels
Electric Vehicle (EV) Charging Station Financial M...
With this comprehensive 5- or 10-year monthly tool, investors can assess the viability of setting up... Read more

Financial Model for Mobile App | Mobile App Busine...
The Mobile App Financial Plan Template in Excel allows you to develop financial projections when lau... Read more

 HenrySheykin
Food Truck Financial Model Excel Template
The Food Truck Financial Model helps entrepreneurs, founders, business owners, consultants, and anal... Read more

Green Hydrogen Production from Wind Energy Financi...
The Green Hydrogen from Wind Financial Model aims to comprehensively forecast a horizon of 40 years ... Read more

Simple Mutual Non-Disclosure Agreement Template
Protect your business secrets with ease using our Simple Mutual Non-Disclosure Agreement Template. S... Read more

Solar Energy Financial Model
The Solar Energy Financial Model Spreadsheet Template in Excel assists you in preparing a sophistica... Read more

 Peter Graf
The Customer-Centric Financial Model for Restauran...
Starting a restaurant without a financial plan is like driving a car blindfolded. You wouldn´t do i... Read more
You must log in to submit a review.