
0 ITEMS

AI SaaS Financial Model Template — Inference Cost, Heavy Users, AI Gross Margin
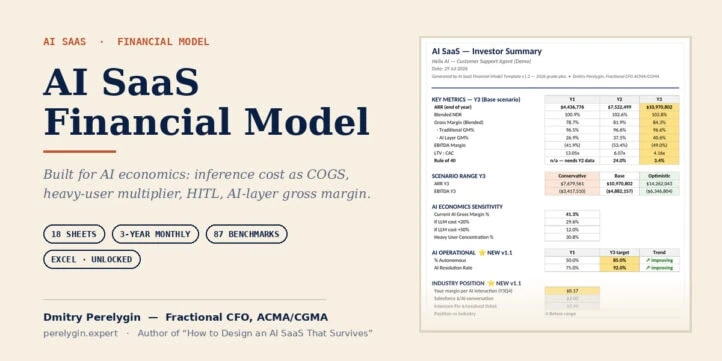
A three-year monthly financial model for AI SaaS startups, built around the cost structure that classical SaaS templates do not have: inference cost that moves with usage, a small share of heavy users consuming several times the average, and humans in the loop sitting inside COGS rather than OpEx. 18 sheets. Four pricing components — per agent, per activity, per output, per outcome — that can be toggled on independently or combined into a hybrid. Traditional and AI-layer gross margin reported separately. Renewal-cliff stress test, inference-cost sensitivity, three-statement output, cap table and a one-page investor summary. Ships with a fully populated demo workbook, a 36-term glossary, a user manual, and a benchmark file where all 87 reference points carry their source. Vanilla Excel. No macros, no VBA, no add-ins. Every cell unlocked, every formula visible.
What this is
A financial model for AI SaaS companies at pre-seed and seed stage. Three-year
monthly build, 18 sheets, roughly 140 input cells collected on a single
Assumptions sheet. Enter your assumptions once; the P&L, cash flow, balance
sheet, SaaS metrics, valuation, cap table and a one-page investor summary
follow from them.
The problem it solves
A classical SaaS model treats cost of revenue as hosting plus support. Both
scale slowly and predictably, which is why software gross margin sits at 75–85%
and everybody plans around it.
An AI product does not behave that way.
Inference cost moves with usage, not with headcount. A small group of heavy
users consumes several times what the average user does, so blended
assumptions understate the true cost of serving. Humans in the loop — review,
escalation, quality assurance — are cost of delivering the product, yet most
models bury them in OpEx, where they quietly inflate gross margin. And LLM
pricing is not a constant you can hard-code for three years.
Run an AI business through a standard SaaS template and gross margin comes out
too high, LTV comes out too high, and payback comes out too short. The plan
looks fundable right up to the point where growth stops paying for itself.
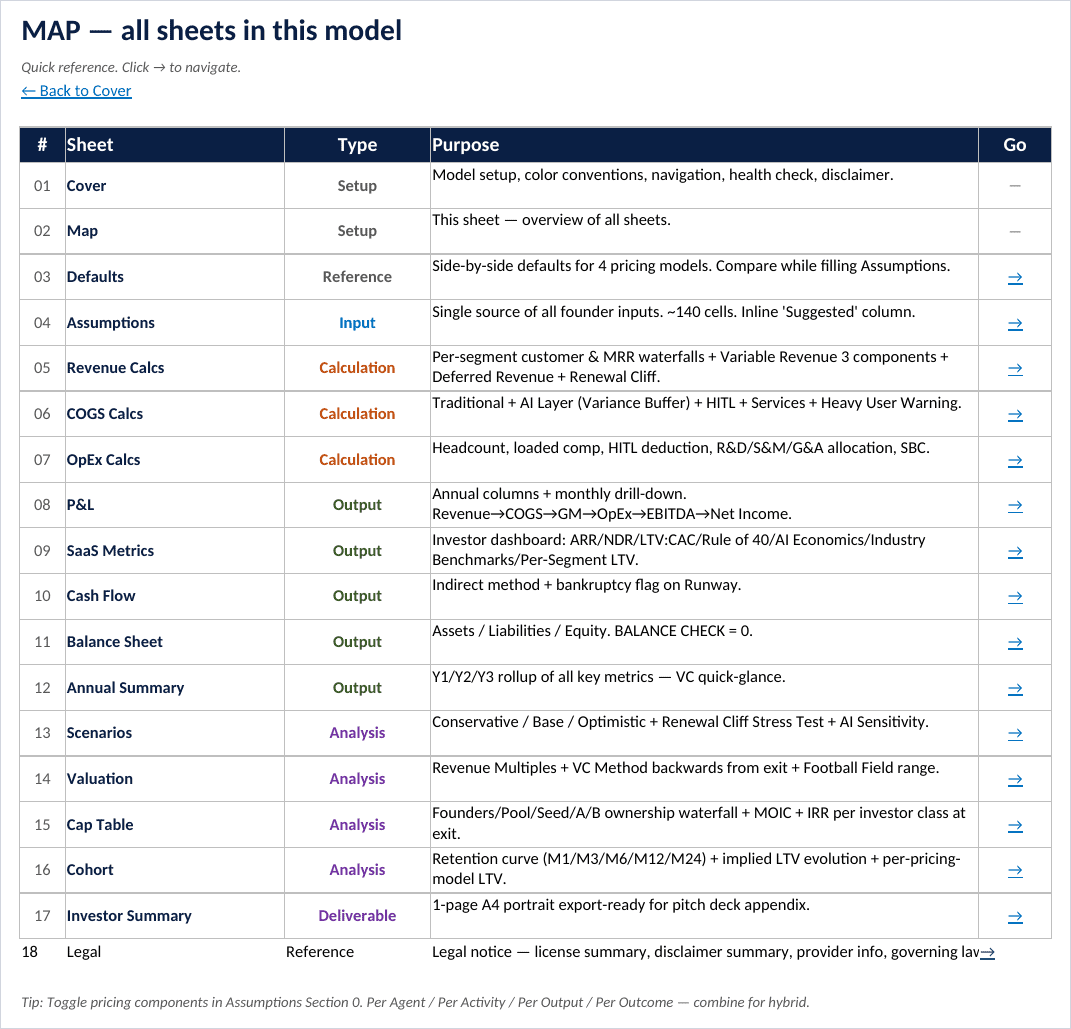
What is inside
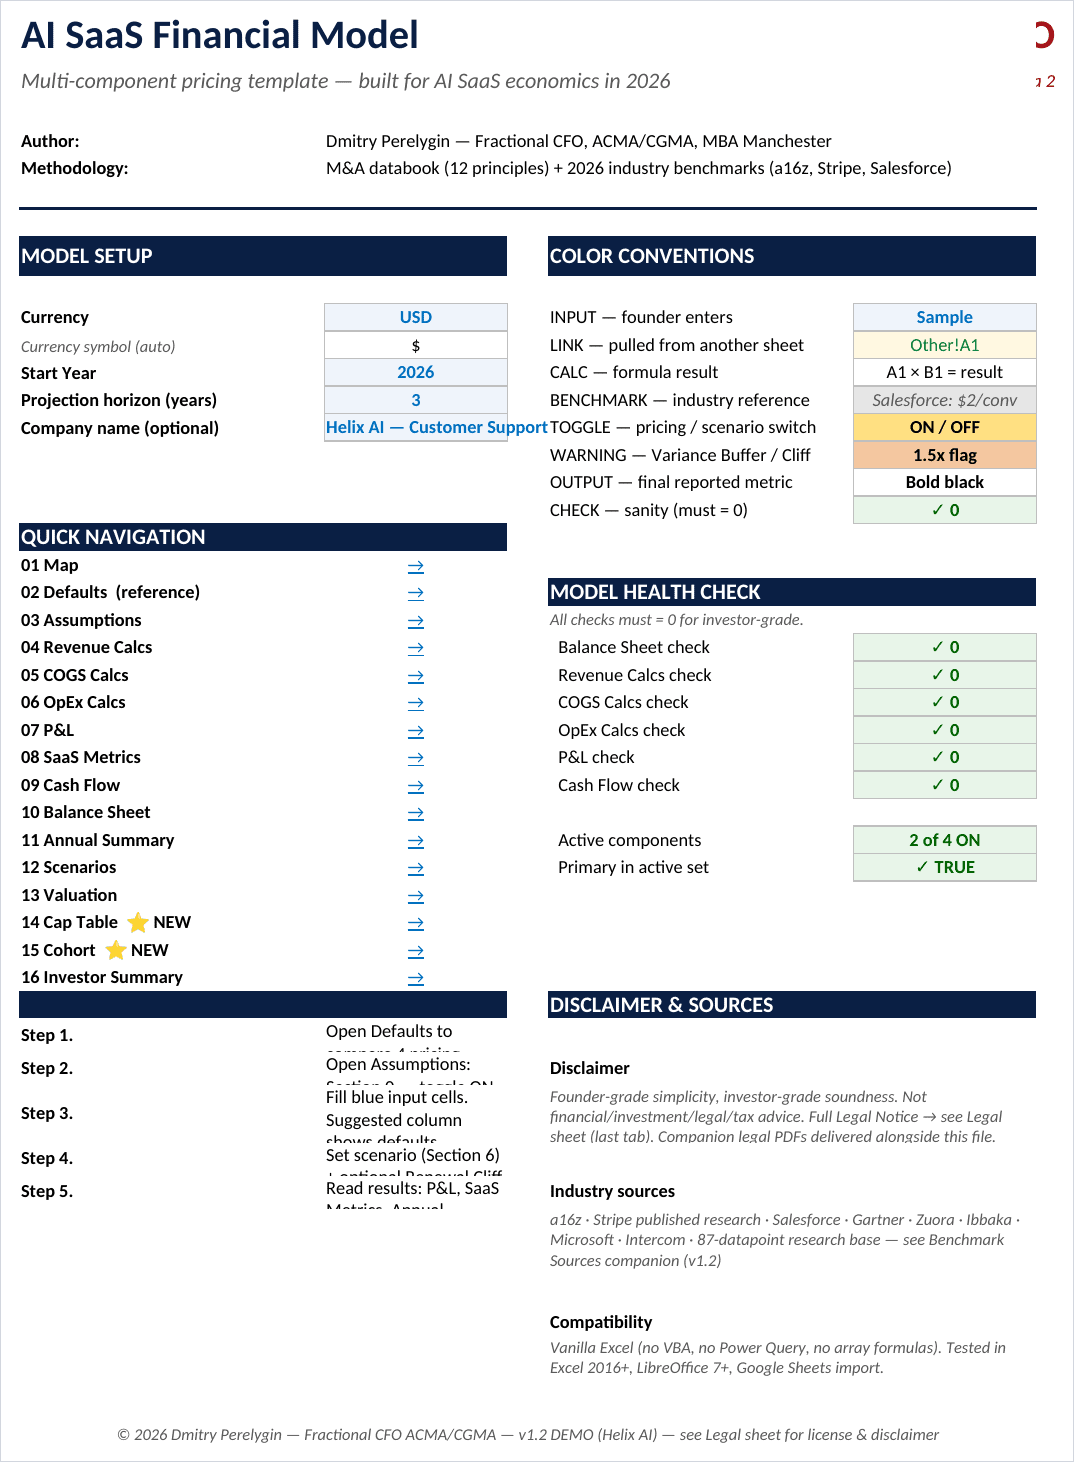
Setup — Cover with model settings, colour conventions and a six-point
health check that must read zero for the model to balance. Map of all sheets.
Defaults sheet comparing suggested starting values across the four pricing
models.
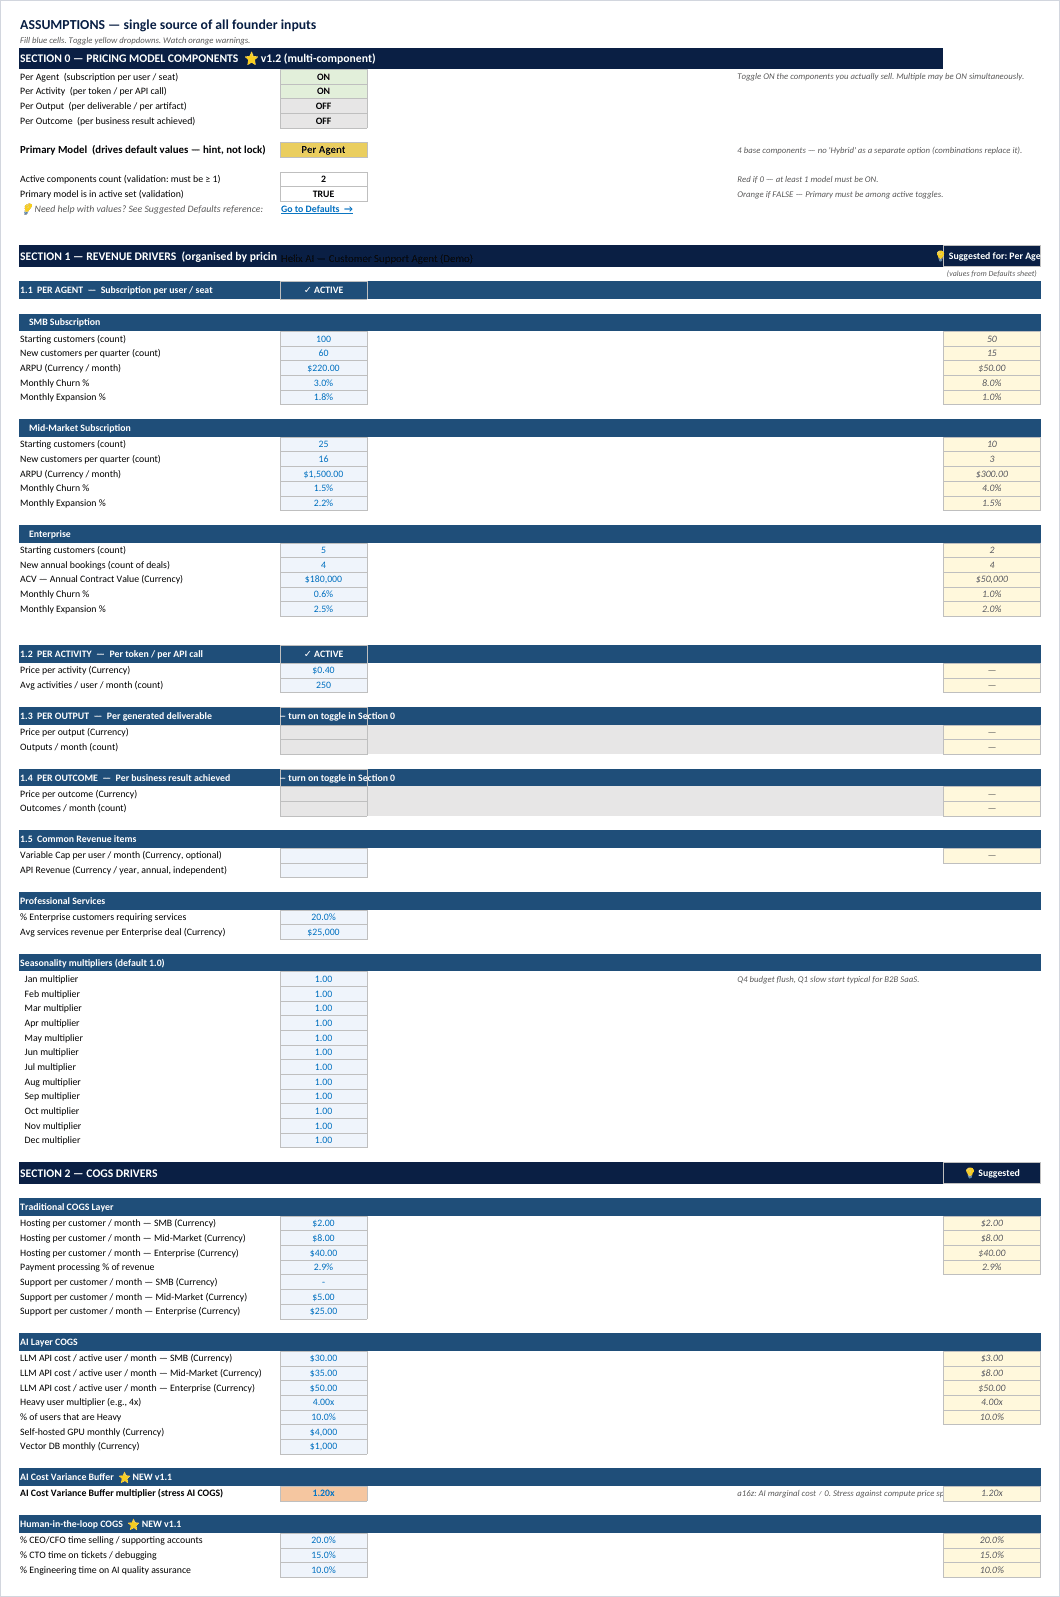
Input — one Assumptions sheet, seven sections, with a Suggested column
showing the industry-typical value for whichever pricing model you selected.
Calculation — Revenue Calcs (per-segment customer and MRR waterfalls,
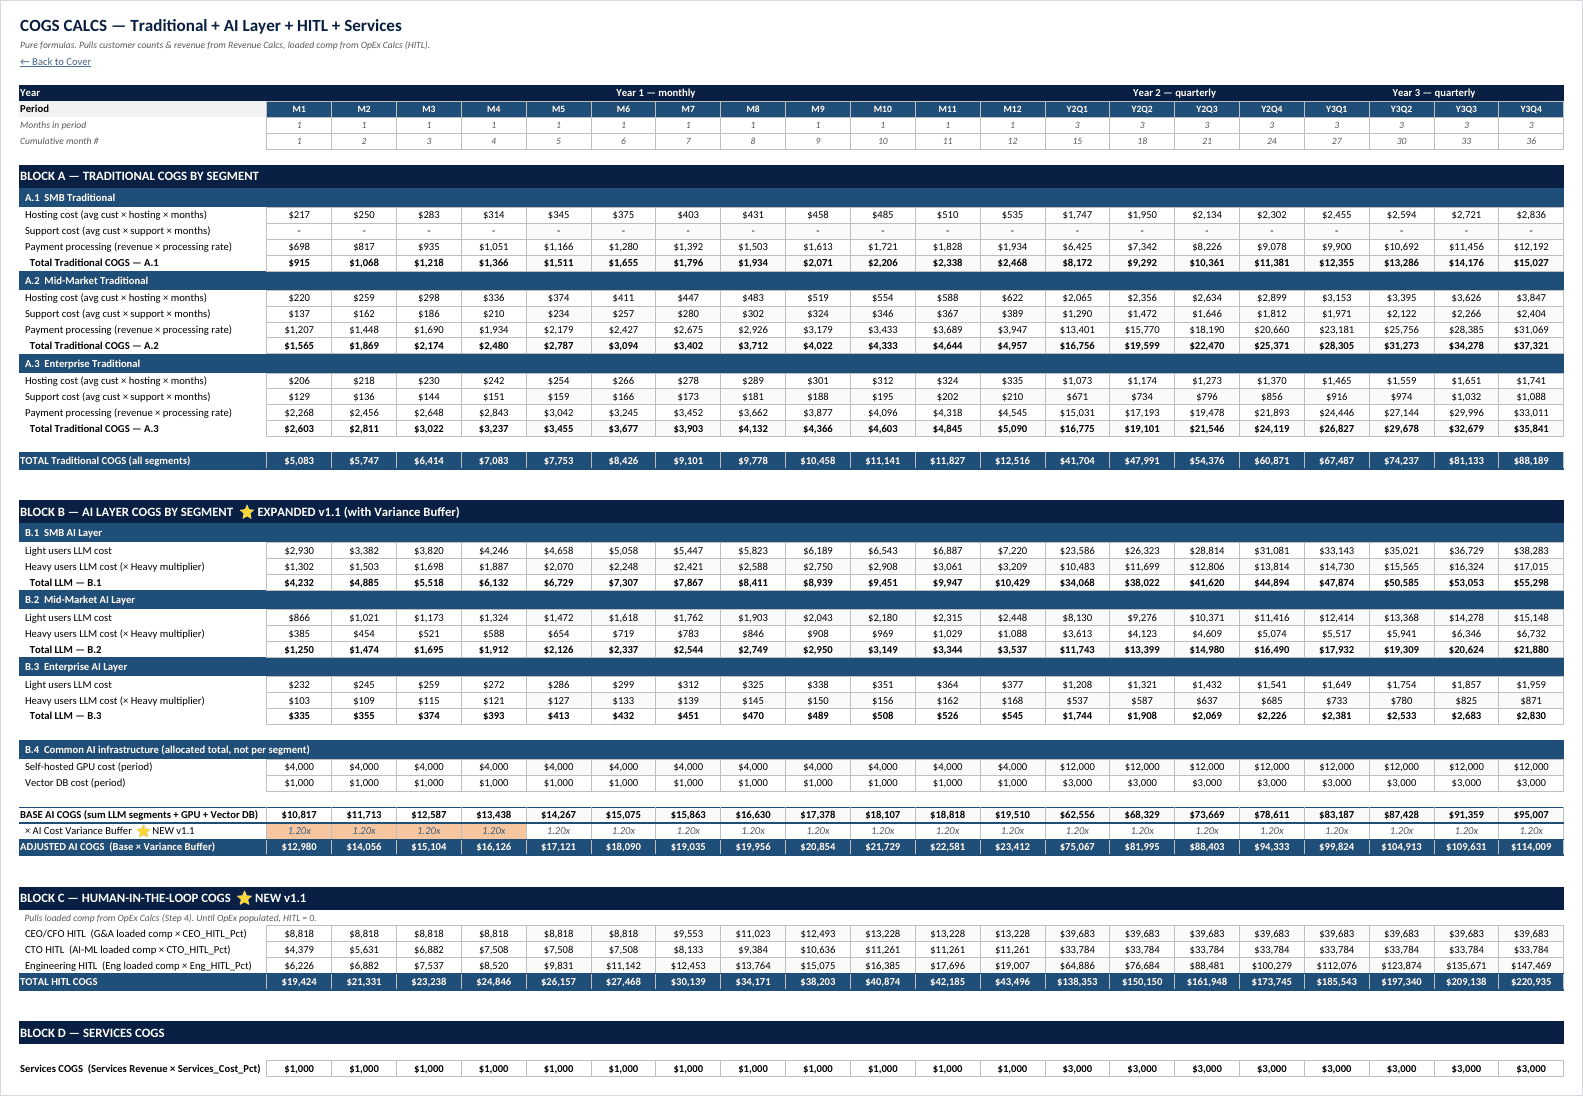
variable revenue, deferred revenue, renewal cliff), COGS Calcs (traditional
layer, AI layer with variance buffer, human-in-the-loop, services, heavy-user
warning), OpEx Calcs (headcount, loaded compensation, HITL deduction,
R&D/S&M/G&A allocation, stock-based compensation).
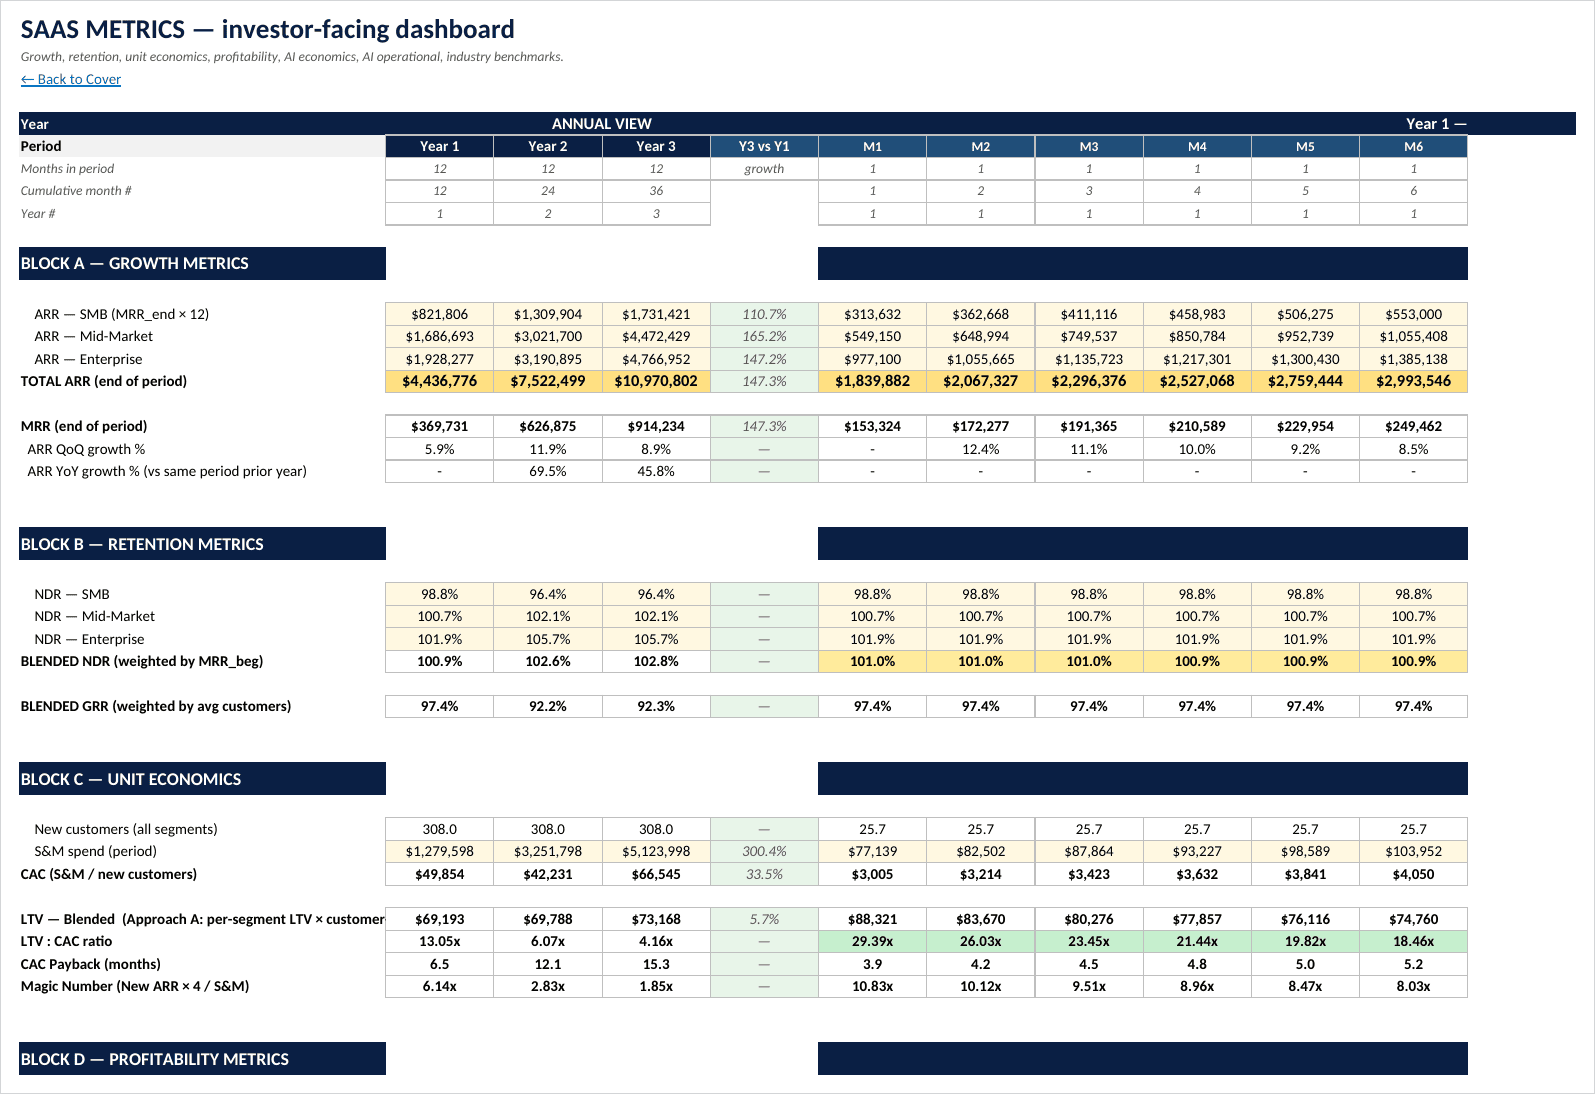
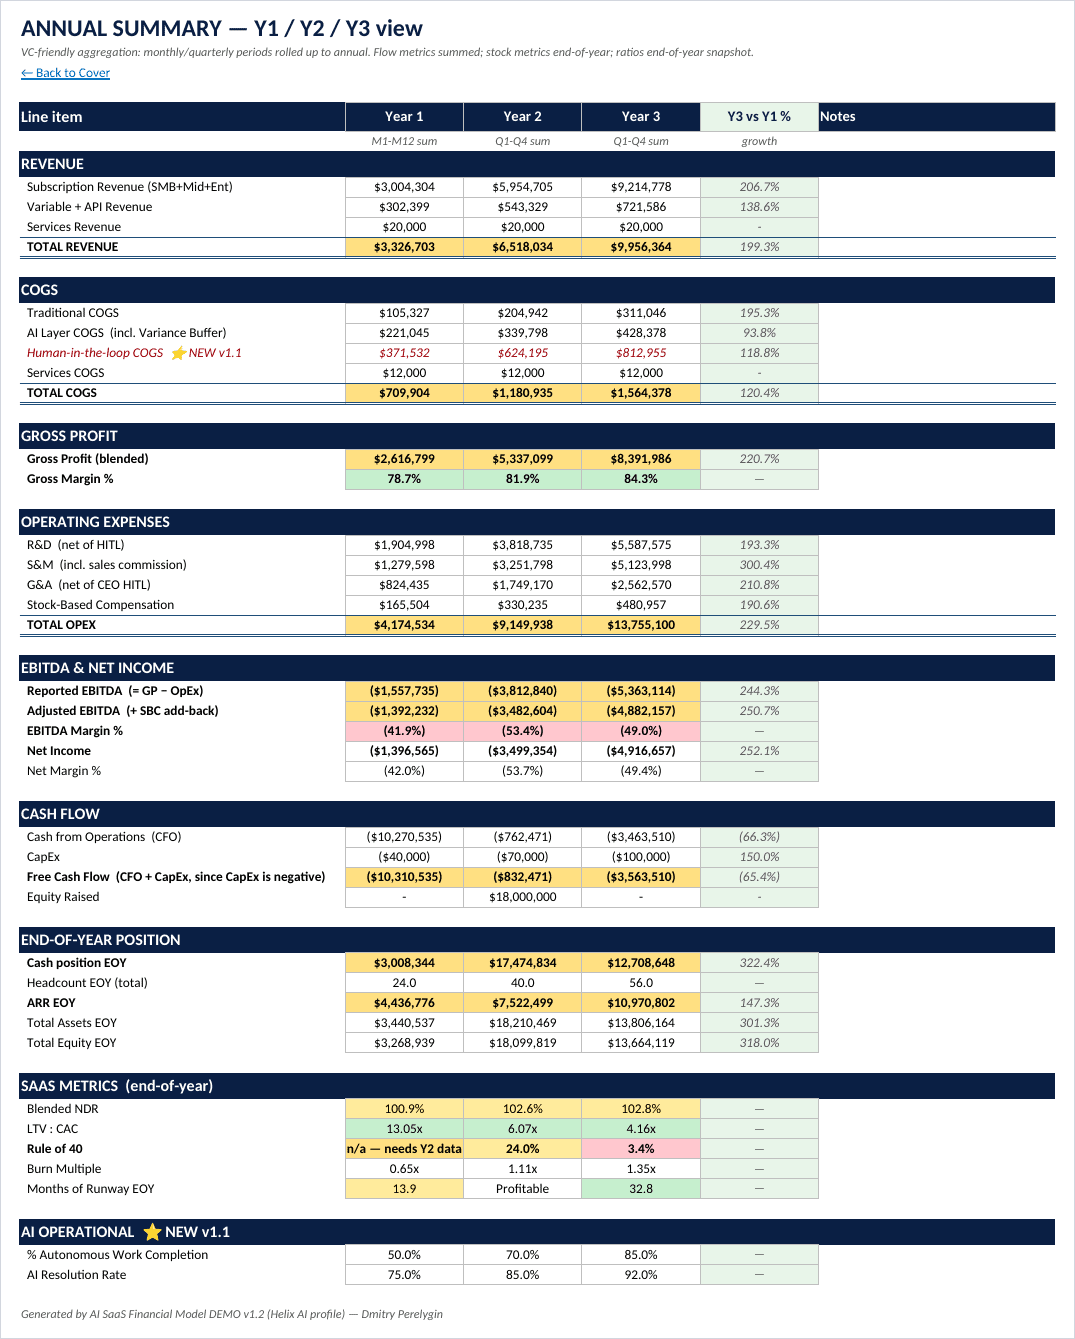
Output — P&L, SaaS Metrics dashboard, Cash Flow (indirect method with a
runway flag), Balance Sheet with a balance check, Annual Summary.
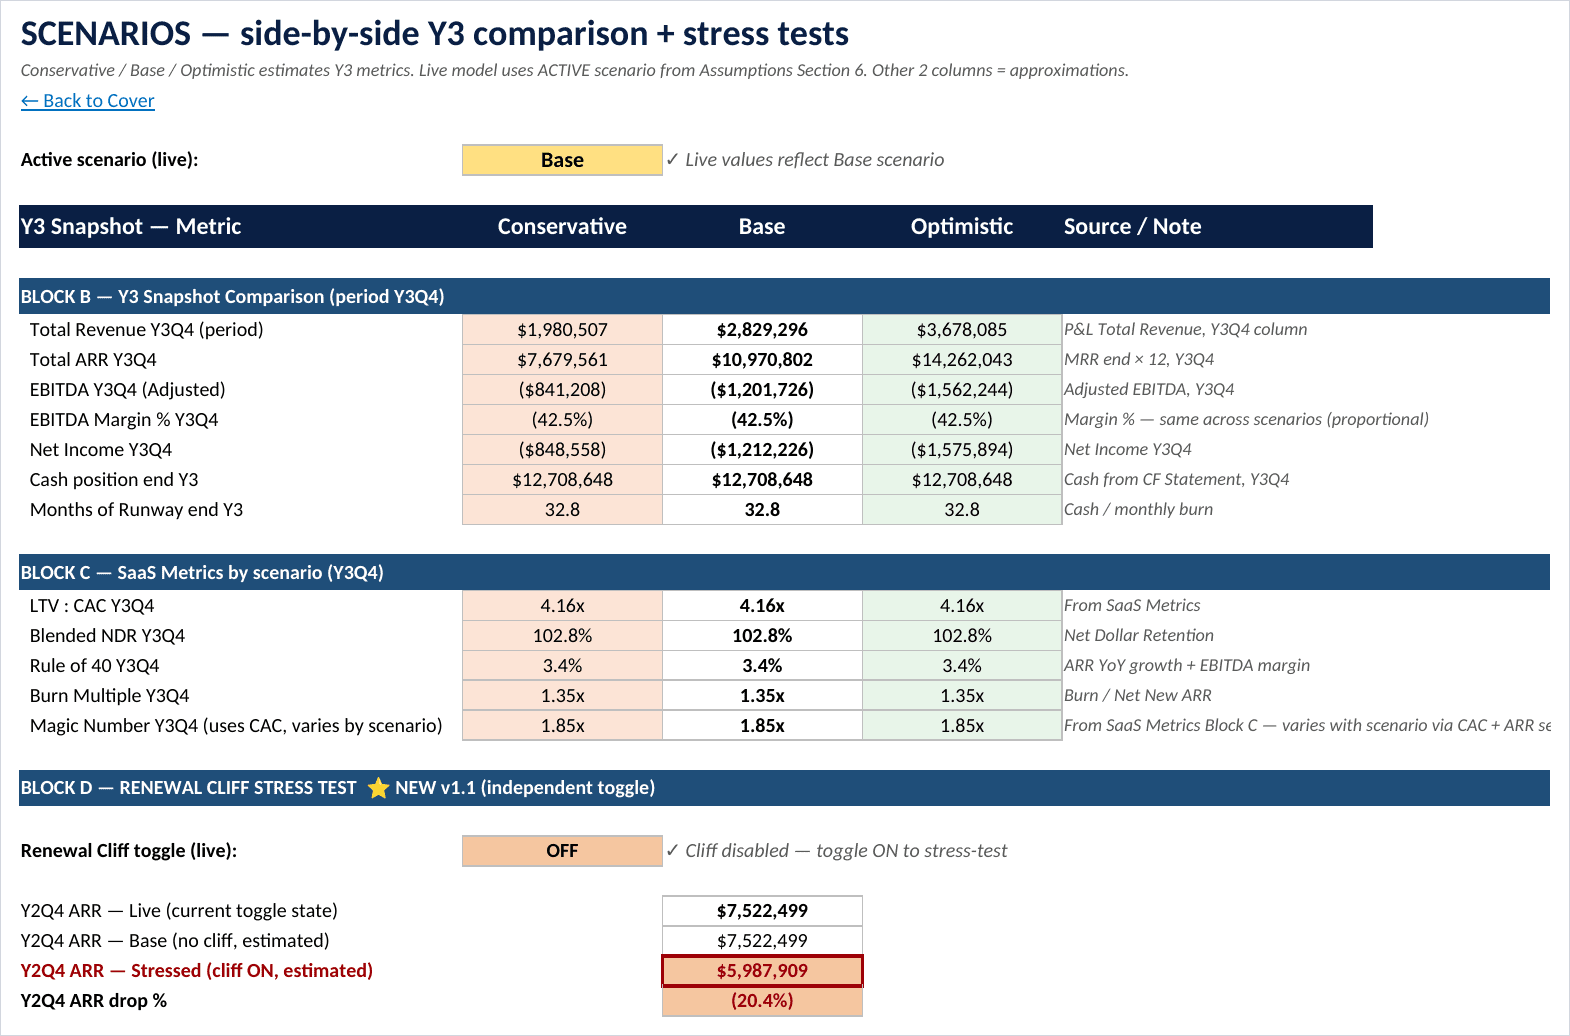
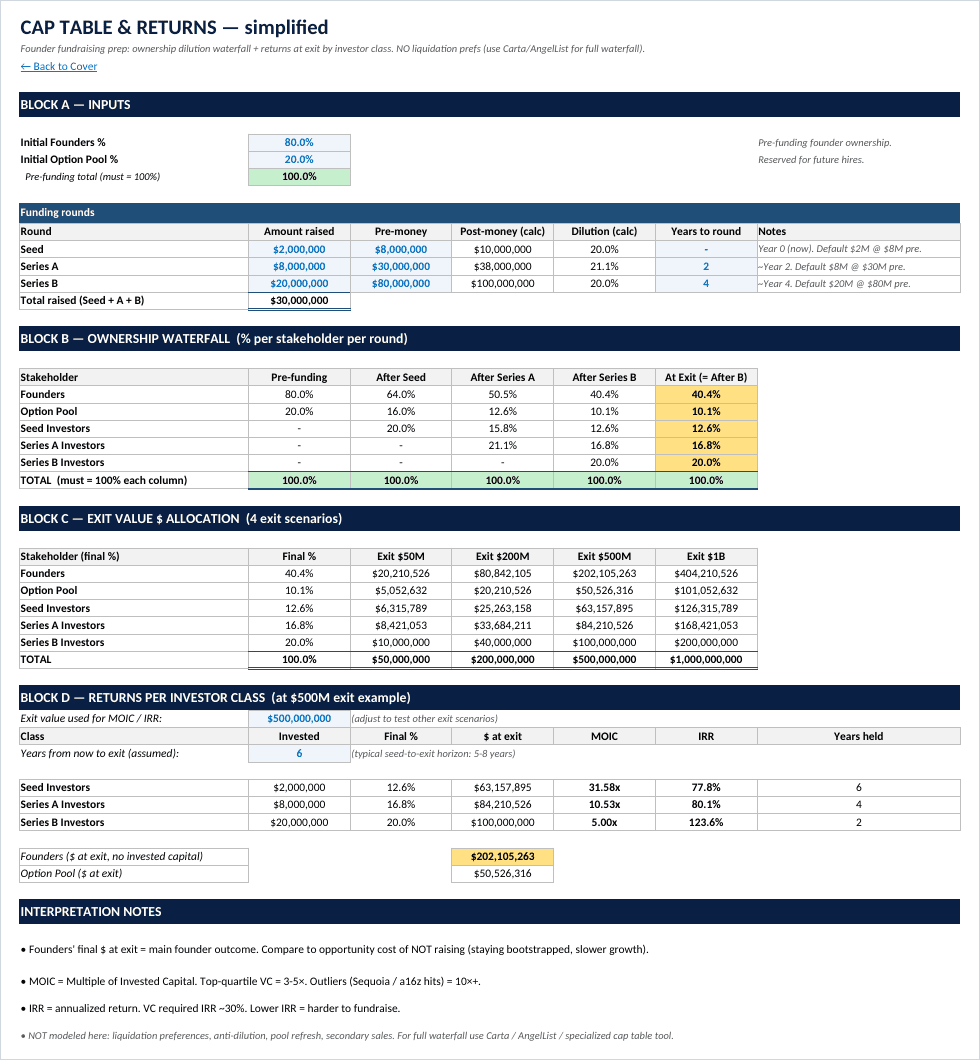
Analysis — Scenarios with conservative/base/optimistic plus a renewal-cliff
stress test and inference-cost sensitivity; Valuation via revenue multiples,
VC method and a football-field range; Cap Table with an ownership waterfall and
MOIC/IRR per investor class; Cohort retention with implied LTV evolution.
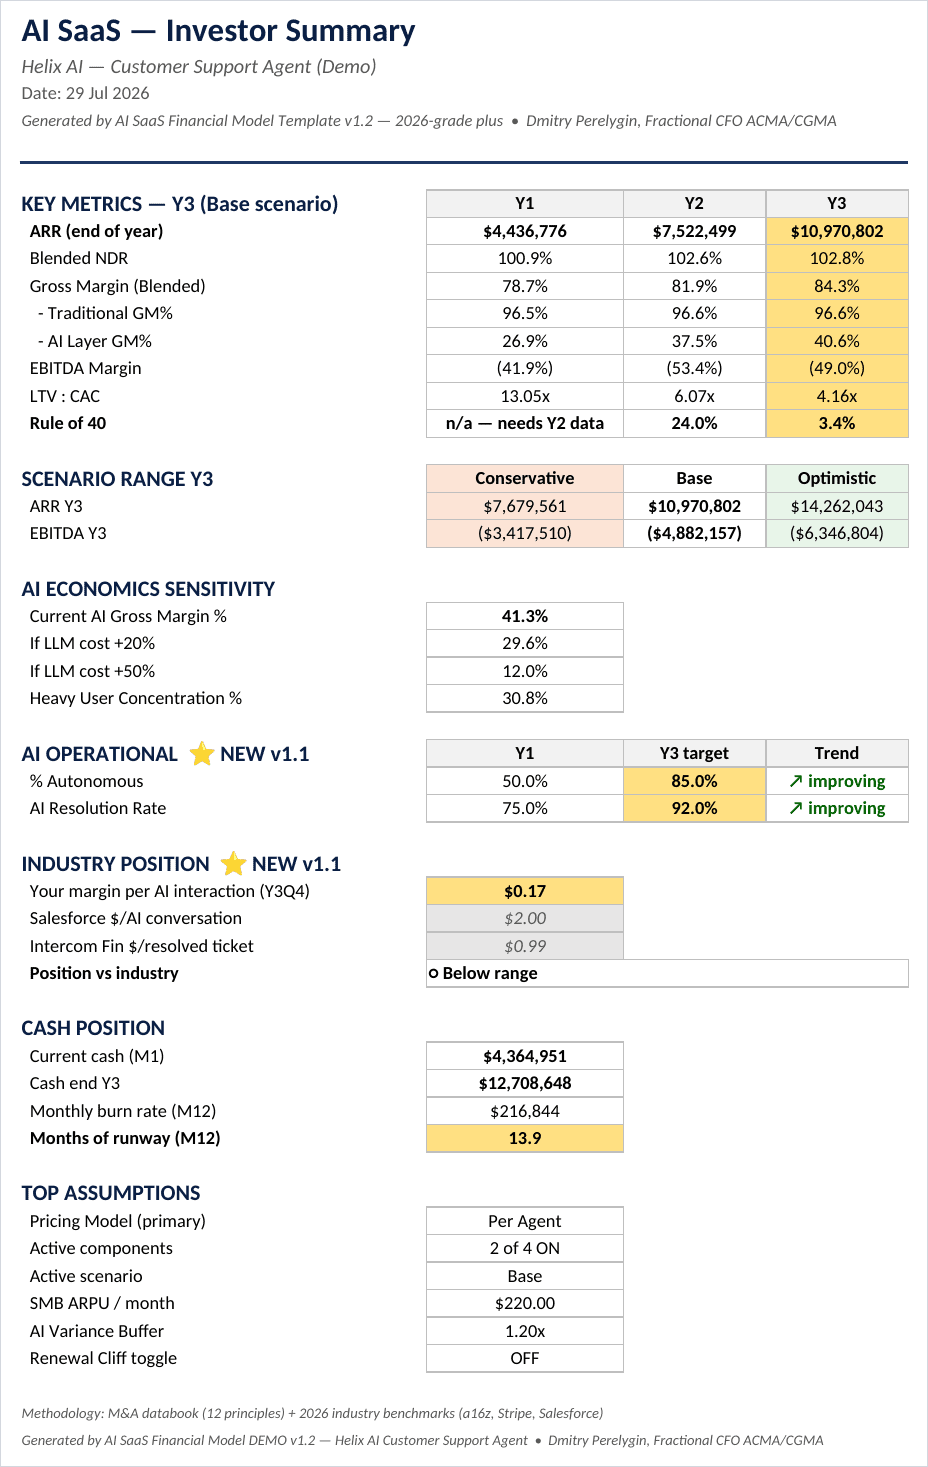
Deliverable — a one-page A4 investor summary, formatted to drop into the
appendix of a pitch deck.
How it differs from a standard SaaS template
Cost of revenue is split into a traditional layer and an AI layer, and gross
margin is reported for each separately — so you can see the moment the AI layer
starts dragging the blended number down.
Inference cost carries an explicit variance buffer, and the model shows what
happens to margin if LLM cost rises 20% or 50%.
Heavy users are modelled with their own multiplier instead of being averaged
away, and the model raises a warning when heavy-user concentration passes the
point where blended assumptions stop being safe.
Human-in-the-loop cost is deducted from OpEx and placed in COGS, where it
belongs.
Revenue is built from four pricing components — per agent, per activity, per
output, per outcome — which can be switched on independently or combined,
because AI products rarely price on seats alone.
Every benchmark used in the model is listed in a companion file with its
source: a16z, Bessemer Cloud Index, Stripe, High Alpha, Carta, Zuora/Ibbaka,
David Skok, Craft Ventures, Scale Venture Partners and others. No unsourced
numbers.
Who it is for
Founders of AI SaaS companies preparing a pre-seed or seed round who have no
CFO on the team and need numbers that survive a due-diligence conversation.
Also useful to operators pressure-testing pricing before a change, and to
advisors who need a defensible starting structure.
What is not included
Not a DCF model — no WACC, no terminal value. No comparable-company analysis.
No liquidation preferences or anti-dilution modelling. No multi-cohort vintage
tracking. Each of these is named in the sheet where it would sit, with a note
on what to use instead.
Not industry-specific beyond AI SaaS. Not a business plan, and not a template
for a funding application.
What you receive
- AI SaaS Financial Model Template — Excel, 18 sheets, all cells unlocked
- Populated demo workbook — the same model filled end to end
- Financial Glossary — PDF, 36 terms, each with its AI-specific twist
- User Manual — PDF, sheet-by-sheet walkthrough
- Benchmark Sources — Excel, 87 benchmarks with sources
- Disclaimer — PDF
Vanilla Excel throughout: no VBA, no macros, no Power Query, no array formulas.
Tested in Excel 2016 and later, LibreOffice 7 and later, and Google Sheets
import.
Disclaimer
This model is a planning instrument, not a forecast. Every output is a
consequence of the assumptions entered, and the assumptions are yours.
Benchmarks are industry reference points for comparison, not targets and not
guarantees. Nothing in this file constitutes financial, investment, legal or
tax advice. Author: Dmitry Perelygin, Fractional CFO, ACMA/CGMA, MBA
Manchester.
Similar ProductsOther customers were also interested in...



 eFinancialModels
Electric Vehicle (EV) Charging Station Financial M...
With this comprehensive 5- or 10-year monthly tool, investors can assess the viability of setting up... Read more

Financial Model for Mobile App | Mobile App Busine...
The Mobile App Financial Plan Template in Excel allows you to develop financial projections when lau... Read more

 HenrySheykin
Food Truck Financial Model Excel Template
The Food Truck Financial Model helps entrepreneurs, founders, business owners, consultants, and anal... Read more

Green Hydrogen Production from Wind Energy Financi...
The Green Hydrogen from Wind Financial Model aims to comprehensively forecast a horizon of 40 years ... Read more

Simple Mutual Non-Disclosure Agreement Template
Protect your business secrets with ease using our Simple Mutual Non-Disclosure Agreement Template. S... Read more

Solar Energy Financial Model
The Solar Energy Financial Model Spreadsheet Template in Excel assists you in preparing a sophistica... Read more

 Peter Graf
The Customer-Centric Financial Model for Restauran...
Starting a restaurant without a financial plan is like driving a car blindfolded. You wouldn´t do i... Read more
You must log in to submit a review.