
0 ITEMS

Average Revenue per User (ARPU)
Average Revenue Per User (ARPU) is a key metric that reveals how much revenue your business generates from each customer over a specific period. A rising ARPU often signals strong customer engagement and upsell success, while a declining ARPU may highlight churn risks or pricing issues. In a competitive landscape, knowing your ARPU can be the difference between scaling sustainably and flying blind.
Financial model templates make it easy to calculate average revenue per user (ARPU) accurately and quickly. These tools break down your total revenue and user base into simple inputs. You can quickly see how much each user contributes to your income. The templates also help you track trends and compare ARPU over time. This insight supports better pricing and growth decisions. With built-in formulas, you reduce errors and save time. Use them to stay on your metrics and sharpen your financial planning.


🔥 Premium AI / LLM Company Valuation Financial Model A…
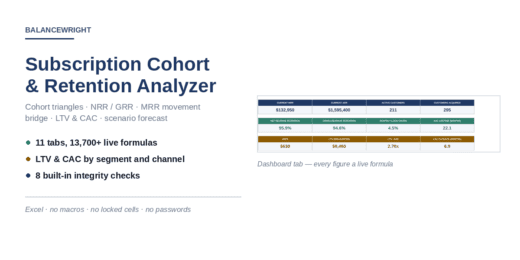

Give this workbook one row per customer per month and…

🚀 Premium Creator Economy Multi-Platform Revenue Financial Model, A professional…


This fully unlocked 5 Year, 12-tab institutional-grade Excel template is…

Professional Vertical AI SaaS Financial Model Template for B2B businesses…


E-Commerce Unit Economics & CAC/LTV Calculator Understand your customer acquisition…


Comprehensive 8 year telecoms financial model forecasting income, cash flow…


A premium, investor-ready SaaS Financial Model (Excel) built for founders,…


This NVIDIA Financial Model Template in Excel has been built…

A polished, investor-ready E-commerce Financial Model for DTC and marketplace…


This dynamic Early Stage Startup SaaS Financial Model, built by…


Tailored for BNPL platform operators, fintech entrepreneurs, and financial analysts,…


Financial Model providing a 10-year financial plan for a startup…

Optimize your fintech payment business’s financial planning with our Fintech…


This Excel-based financial model provides a clear, fully integrated way…


Comprehensive editable, 5-year 3 statement MS Excel spreadsheets for tracking…


This Excel model is a highly adaptable and user-friendly tool…


The Video Streaming Financial Model Template is a comprehensive tool…


This 10-year monthly Gym Fitness Center financial model is designed…

This Childcare Center Financial Model Template has been built for…

The SaaS B2C Business Financial Model for Irregular Renewal Periods…


The Mobile App Financial Model Template is a comprehensive tool…

This Student Bundle includes financial model templates from various industries…

A financial model framework designed for an AI platform that…

This detailed and user-friendly Excel spreadsheet template provides a comprehensive…

This Healthcare Mobile App Financial Model Template has been built…



This Advanced Financial Financial Model Template has been built for…

This Cardiology Clinic Financial Model Template has been built for…



This Social Media Mobile App Financial Model Template has been…


This Indoor Rock Climbing Gym Financial Model Template has been…




This Laundromat Financial Model Template (5 Year Financial Forecasts, Income…







This E-Commerce Mobile App Financial Model Template has been built…

Human Resource Management (HR / HRM) SaaS Financial Model Template…

This Payment Gateway and Billing Solutions SaaS Financial Model Template…

This Communication Platform SaaS Financial Model Template has been built…

This Content Management System (CMS) SaaS Financial Model Template has…

This Customer Relationship Management (CRM) SaaS Financial Model Template has…


This Enterprise Resource Planning (ERP) SaaS Financial Model Template has…

What Is Average Revenue per User?

When Facebook reports making over $60 in revenue from just one user in the U.S. and Canada—or when Google pulls in billions by monetizing search activity across the globe—it becomes clear that not all users are created equal. Behind these impressive earnings lies a deceptively simple metric: Average Revenue Per User (ARPU). The answer to what is average revenue per user doesn’t just reflect how much a company earns from its users—it tells a story about monetization strategies, business models, and overall financial health.
Average Revenue Per User (ARPU) shows how much money a business makes from each customer. It helps companies track growth, spot trends, and compare performance. Facebook and Google use ARPU to measure how well they turn users into profit. A rising ARPU often means better monetization and stronger business health. It’s a simple way for startups to check if users are truly valuable. Whether you run a subscription app or an online store, understanding ARPU can help you grow smarter and faster.
We will focus on the following key points in this article:
- Understanding the Average Revenue Per User Formula
- High ARPU means better monetization and engagement
- Why is ARPU Important for Businesses?
What is the Definition of the Average Revenue per User (ARPU)?
Average Revenue Per User (ARPU) shows how much a company earns from each customer over a set time. It is a financial metric that measures the value each user brings to the business. It's common in telecom & mobile sites, SaaS, and subscription-based businesses. A higher ARPU means users spend more, which boosts profits. Lower ARPU may signal pricing issues or low customer engagement. This simple yet powerful metric helps shape marketing, pricing, and product decisions.
Average revenue per user (ARPU) is a measure of profitability. ARPU helps companies understand how much profit each user brings in. It doesn't show full costs, but it points to earning power. Tracked over time, it reveals trends in customer behavior and revenue quality. ARPU also helps spot where to cut costs or boost income. While not a full profit metric, it's a key piece of the bigger picture.
Lastly, when we want to understand what is average revenue per user we need to be aware that the measurement of this metric involves setting a time period - monthly, quarterly, or annually You add up all revenue from users in that period and divide it by the total number of users. It helps compare performance across time frames and track growth.

Below, we have compiled the top 10 digital advertising platforms and their ARPU in 2024.
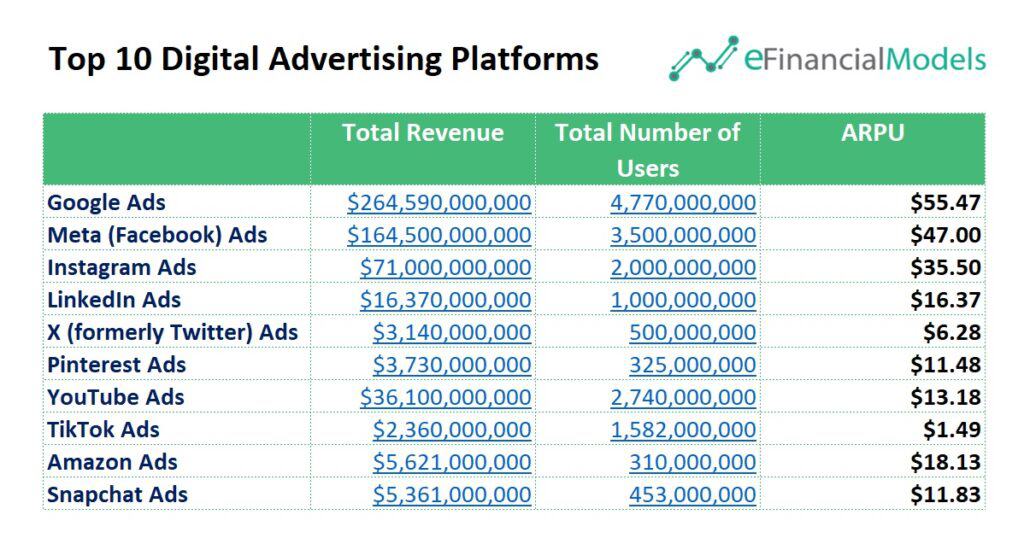
Note: The data presented in this article is based on information compiled from different industry reports and reputable websites as of 2024, including Statista, Sprout Social, Oberlo, and Business of Apps.
What is the Average Revenue per User in the above chart? The chart above shows how much revenue the top digital ad platforms made in 2024 and how much they earned per user. Google Ads has the highest total revenue and the top average revenue per user (ARPU) at $55.47. Meta and Instagram also show strong returns per user, proving their power in targeted marketing. In contrast, platforms like TikTok and X (formerly Twitter) have massive user bases but low ARPU, signaling weaker monetization. This data helps marketers spot which platforms turn attention into dollars more efficiently—critical for choosing where to spend ad budgets wisely.
Knowing which digital advertising platforms make the most money per user shows where brands get the biggest bang for their buck. It highlights which platforms truly engage users and drive action—key signs of value for marketers. Instead of just chasing clicks, businesses can use this insight to focus ad spending where it works hardest. High revenue per user means stronger monetization, better targeting, and smarter ad strategies. In a crowded digital world, this metric helps cut through the noise and prioritize what delivers real results.
Understanding the Average Revenue Per User Formula
The Average Revenue Per User formula helps businesses understand how much money they make from each customer. To calculate it, divide total revenue by the number of users.

Where:
- Total Revenue is the full amount of money a business earns from selling its products or services. It includes all sales before subtracting any costs or expenses. This number shows how much cash is coming in from customers. It is a key starting point for tracking success and making financial decisions.
- The Total Number of Users means how many customers use a product or service during a certain period. Depending on the business model, this count includes both paying and free users. It helps measure reach, scale, and growth. A higher user count often shows demand and market interest. Tracking this number helps businesses understand who they serve and how their audience changes.
For instance, if a company earns $100,000 from 5,000 users in a month, its ARPU for that month is:

The above calculation shows that the company earns $20 per user monthly. The Average Revenue Per User formula shows how valuable each user is to your business. It’s a quick way to track growth, compare performance over time, or measure the impact of pricing changes. Focusing on this simple yet powerful metric gives you clear insight into customer value and business health.
Why is ARPU Important for Businesses?
Average Revenue Per User (ARPU) matters because it shows how much money each customer brings in. It clearly shows how well a business turns users into revenue. A rising ARPU means your customers see value and are willing to pay more. A falling ARPU could signal weak pricing or engagement. By tracking ARPU, businesses stay sharp, make better decisions, and focus on what drives growth.
Customer Value Evaluation
Average Revenue Per User (ARPU) shows how much each customer brings in on average. It helps you understand how valuable your users are. A higher ARPU often means better customer loyalty or stronger demand. You can focus on attracting high-value users and improving your marketing efforts by tracking them.
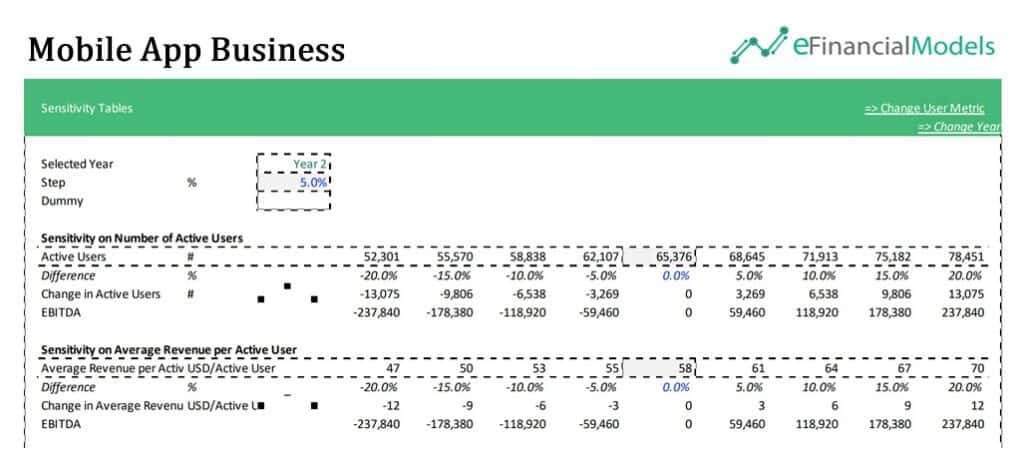
The above chart is from our Mobile App Business Plan Template. It helps evaluate customer value by showing how average revenue per user (ARPU) changes impact the mobile app’s earnings. Through sensitivity analysis, it tests different ARPU values—ranging from $47 to $70—and reveals how each shift affects the Earnings before Interest, Taxes, Depreciation, and Amortization (EBITDA). As ARPU increases, EBITDA rises, showing that even small improvements in user spending can lead to big financial gains. This simple yet powerful sensitivity table makes it easy to see how much value each user adds and helps app owners plan smarter revenue strategies.
Pricing and Monetization Insights
ARPU reveals if your pricing strategy is working. If ARPU is low, you might be underpricing or missing upsell chances. If it's high, your pricing and features may be well-aligned. It helps you test new pricing models, tweak subscriptions, and find the best way to make money from your users.

The above chart is from our Gym Fitness Center Financial Model. It shows how the gym’s Average Revenue Per User (ARPU) reveals key pricing and monetization insights over a 10-year forecast. By tracking ARPU from $38.07 in 2025 to $43.79 in 2034, the gym can evaluate how pricing strategies, member growth, and added services impact revenue per member. It highlights the role of group classes and extra services in boosting income beyond standard membership fees. The rise in ARPU over time suggests effective upselling and member engagement, helping the gym fine-tune pricing plans and increase long-term profitability.
Revenue Performance Tracking
ARPU is a simple way to measure revenue growth. It tells you how your business performs without needing full financial reports. If ARPU grows over time, your business is scaling well. You may need to fix churn, pricing, or product value if it drops. It's a key number for tracking success.

The above chart is from our SaaS B2C Financial Model for Irregular Subscription Renewal. It tracks Average Revenue Per User (ARPU) to show how well a SaaS B2C business grows its revenue over 10 years. ARPU starts at $34.36 and slowly rises to $36.42, reflecting steady pricing and product value. This small but consistent increase, combined with strong subscriber growth, drives a sharp rise in Monthly Recurring Revenue (MRR) from $7K in 2025 to $866K by 2034. By monitoring ARPU, the business can measure how effectively monetizes users and sustains long-term growth, even with a flat price model.

Boost ARPU with Precision Through Financial Modeling
Average Revenue Per User (ARPU) is a simple but powerful metric that shows how much revenue each customer brings in. It helps businesses understand customer value, track performance, and improve pricing strategies. Whether you’re running a mobile app, a SaaS platform, or a gym, rising ARPU signals strong monetization and growth. In short, knowing your ARPU helps you make smarter decisions, target high-value users, and grow sustainably.
Boosting ARPU starts with clear data and smart tools. Financial models let you test pricing, forecast revenue, and spot what drives user spending. You can try different scenarios, adjust strategies quickly, and see the impact before changing. These models remove the guesswork and bring sharp focus to your growth plan. You turn insight into action with the right inputs and confidently raise ARPU.
You might also like:
- 10 Ideas to Increase Average Revenue Per User
- How to Calculate Annual Recurring (ARR) Revenue for Sustainable Growth
- Understanding the Key Differences Between Levered and Unlevered Free Cash Flow
- How to Optimize the Average Selling Price: Strategies for Higher Profits
- 10 Main Elements of a Business Plan
- Calculating Revenue Growth Rate: A Key Metric for Business Success
- 5 Practical Tips to Help Raise Funds For Startups
- Creating a Budget Plan – Using the Best Excel Budget Template
- Financial Planning for Small Business Owners - Taking an SBA Loan
- Revenue Model Templates and their Characteristics
- Average Order Value (AOV)
- Business Valuation
- Monthly Recurring Revenue (MRR)
- 10-Step Financial Planning Checklist for Smart Executives
- Financial Ratios Analysis and Its Importance
- Startup Model Templates in Excel that can help your Business Grow
- Financial Forecasting Models by eFinancialModels
- Why Financial Forecasting Models Are Vital for Your Business
- Average Revenue Per User & Why It Matters