
0 ITEMS

Top-Down vs. Bottom-Up Financial Planning: What’s the Difference?

Understanding different forecasting methods can improve the accuracy of your financial plans.
- Top-down forecasting starts with broad industry data and breaks it into specific targets for your business.
- Bottom-up forecasting builds from detailed operational data, such as unit sales and costs, to create realistic projections.
- Choosing the right approach depends on your business size, goals, and data availability.
- Combining both methods can provide a balanced view for strategic and operational planning.
- Accurate financial modeling using these approaches supports better decision-making and resource allocation.
Keep reading to see which method suits your business needs best.
Top-Down Forecasting: Big Picture Insights
Top-down forecasting involves starting with the big picture and then drilling down to finer details. Here, you begin with broad, high-level assumptions or figures about the market and apply them to your company. For example, if you’re forecasting revenue, you might begin with the total market size and estimate what share of that market your business can reasonably capture.
Top-down forecasting is effective when strategic planning must align with large-scale trends, such as economic indicators, market-wide shifts, and policy changes. That is why larger companies and government institutions commonly adopt it. Imagine a large tech company like Apple planning its next fiscal year; it might use top-down forecasting, beginning with high-level market trends, economic forecasts, and corporate goals to allocate budgets across departments. This strategy allows them to align effective plans for individual units with an overarching vision.
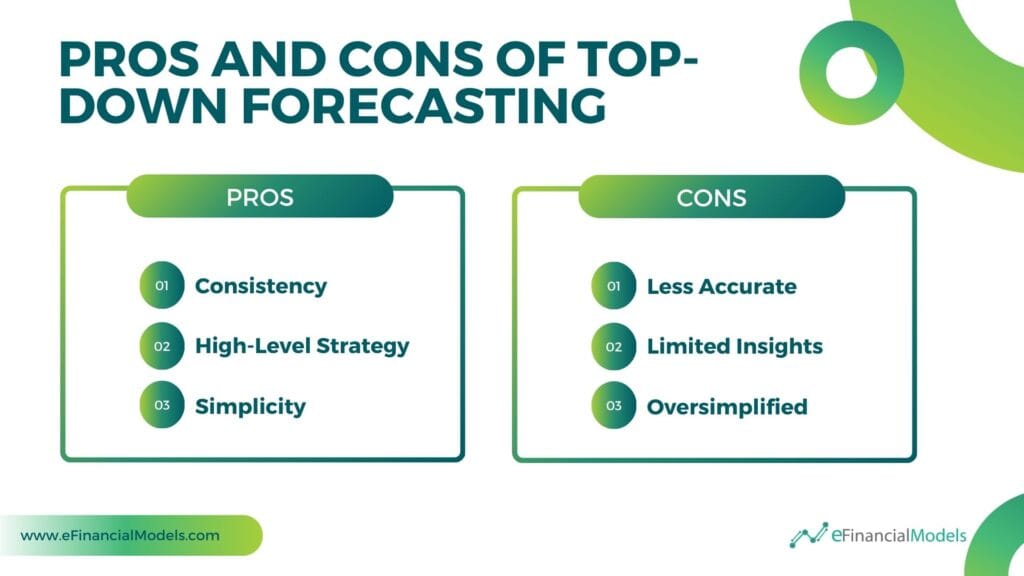
Pros of Top-Down Forecasting
- Consistency: The top-down approach ensures that your financial projections align with broader industry trends, making it suitable for stakeholders or investors who want to see how your business fits into the larger market landscape.
- High-Level Strategy: This approach helps executives focus on overall growth, profitability, and strategy rather than getting bogged down in operational details.
- Speed and Simplicity: The top-down approach is often quicker to implement because it relies on broad market data and high-level estimates. It’s particularly useful if you need more detailed internal data or a fast, ballpark figure for planning.
Cons of Top-Down Forecasting
- Less Accurate: Relying on broad estimates can lead to less accurate forecasts, as the top-down approach often overlooks specific elements that may significantly affect performance.
- Limited Insights: Since high-level metrics drive this method, it often provides limited insights into the finer details of the business that might need more granular adjustments.
- Oversimplification: The top-down approach can oversimplify certain aspects of a business, particularly operational details. It might overlook factors like resource constraints or local market differences.
Top-Down Financial Model: Sample Financial Planning
A top-down financial model is a strategic approach to financial forecasting. It begins by assessing the big picture before narrowing it down to a company’s specifics. Financial planning using this model starts with high-level assumptions. These may include market size, growth rates, and industry trends. We then use those to estimate a company’s revenue, costs, and profitability. Here’s an illustrative financial planning example using a top-down financial model for an established company seeking to enter a new market:
Step 1: Market Size Estimation
Healthy Choice Inc. is a well-established food company. It plans to expand into the plant-based beverage market. The top-down approach begins with estimating the total market size. Suppose industry reports reveal that the global plant-based beverage market is valued at $15 million, with an annual growth rate of 10%.
Step 2: Target Market
Next, Healthy Choice narrows its focus to North America, representing 20% of the global market. Thus, the North American market size is $3 million. Given its existing brand recognition and distribution channels, the company assesses that it could aim for a 5% market share within five years, equivalent to $150 million in annual revenue.
Step 3: Sales Forecast
Based on the macroeconomic data, Healthy Choices arrived at the following annual sales forecast/target:
- Year 1 = $150,000
- Year 2 = $165,000
- Year 3 = $181,500
- Year 4 = $199,650
- Year 5 = $219,615
Step 4: Cost Structure and Investment
Healthy Choice also estimates the costs involved, including production, marketing, distribution, and entry costs. By analyzing industry benchmarks, they predict:
- Production costs will be 40% of revenue.
- Marketing and promotional expenses will be 20% of revenue.
- Operational costs will be 15% of revenue.
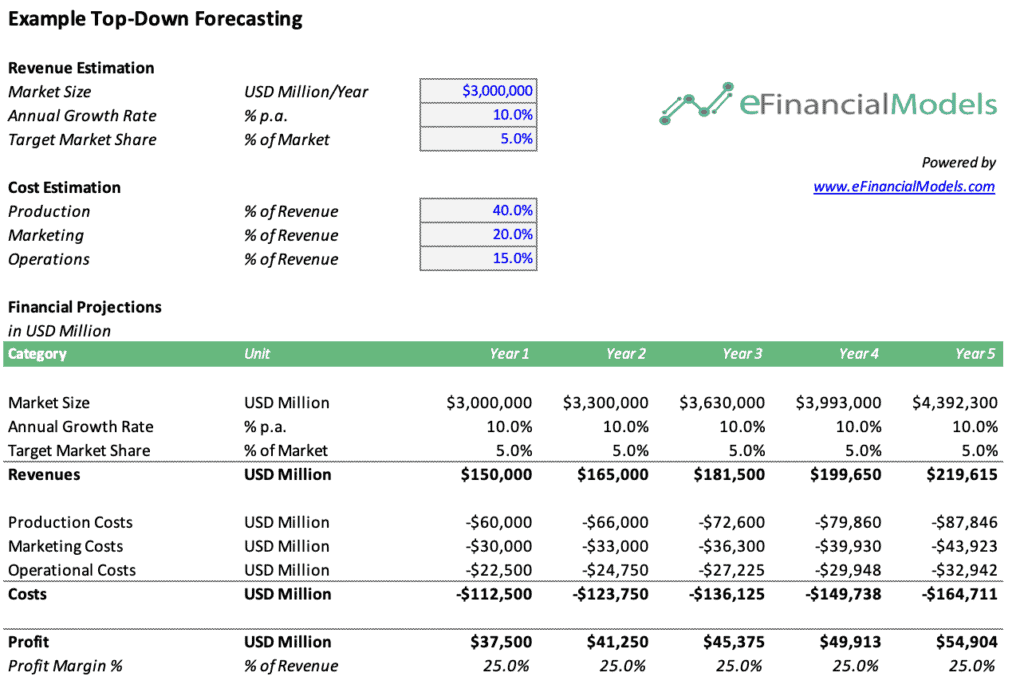
This illustrative top-down financial model for Healthy Choice Inc. starts with the total market size. Then, we applied the estimated growth rates and target market share. It shows a high-level revenue and cost projection showing consistent growth from Year 1 ($24,604) to Year 5 ($37,500).
Step 5: Financial Analysis
Based on this illustrative top-down financial model, we can determine the expansion’s feasibility. Given the consistent revenue growth, the expansion appears financially viable.
A top-down financial model is particularly useful for new market opportunities lacking data. Macro-level data provides a bird’ s-eye view of the business landscape. It helps companies quickly gauge their market potential. Established industries also use a top-down financial model for a high-level overview. These industries have abundant and reliable historical data. They make forecasting future performance easier.



















































Bottom-Up Forecasting: Insights from the Ground Up
Bottom-up forecasting involves starting with detailed data from within the company. From here, we build up the larger financial picture. You begin with the smallest components—the number of units sold, individual costs, or internal production capabilities—and use these details to create an overall forecast. Businesses with in-depth knowledge of their operations often prefer this method. It provides a clearer understanding of the factors influencing their performance. For example, a small app developer might use bottom-up forecasting to build a thorough financial plan. The process may start by evaluating current resources. From here, we can estimate sales and project expenses.
Bottom-up forecasting best creates accurate, detailed financial projections based on specific activities. It begins with estimating individual revenue streams and then aggregates them for a complete financial picture. It is ideal for startups validating growth potential. It is also ideal for established companies assessing the impact of operational changes on financial health. Detailed data on their operations provides a realistic estimate considering current capacity, resources, and constraints.
Pros of Bottom-Up Forecasting
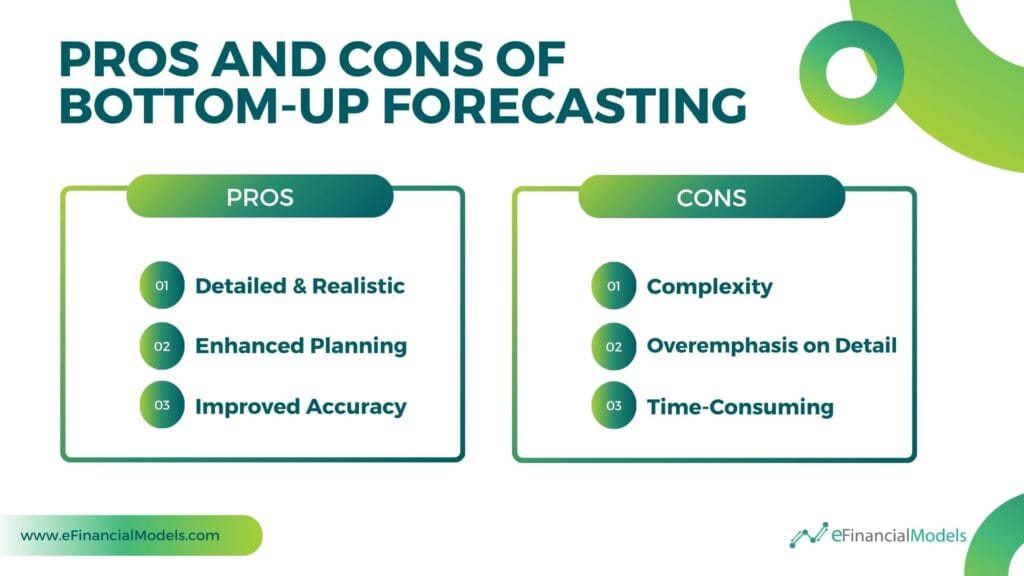
- Detailed and Realistic: Bottom-up forecasting provides a more realistic and detailed forecast since it uses internal data that reflects your company’s actual performance.
- Enhanced Planning: By focusing on granular details, a bottom-up forecast helps identify specific resource requirements and operational bottlenecks, making it easier to plan for day-to-day operations.
- Improved Accuracy: Bottom-up financial forecasts tend to be more accurate, particularly for smaller businesses or those in specialized niches, as the figures are based on real operational capabilities and sales trends.
Cons of Bottom-Up Forecasting
- Complexity: The level of detail can lead to a more complex model that might be harder for some stakeholders to understand, especially if they are unfamiliar with the operational details.
- Overemphasis on Detail: In some cases, bottom-up forecasting can lead to overemphasis on minor details, which may detract from the big picture, making it challenging to communicate strategic goals to investors.
- Time-Consuming: A bottom-up forecast can be time-consuming and data-intensive, requiring collecting detailed information from different company parts.
Bottom-Up Financial Model: Sample Financial Planning
A bottom-up financial model starts by estimating costs and revenues from the ground level. It focuses on detailed inputs like individual sales, expenses, and growth rates to forecast financial performance. The model builds projections based on each component of the business. It allows for a more accurate reflection of real activities. It’s ideal for startups or companies with varied product lines, as it offers flexibility and insights into specific operations. The model gives a comprehensive financial health overview by aggregating data from individual units. It’s thorough, data-driven, and effective for precise planning. Here’s an illustrative financial planning example using a bottom-up financial model for a startup providing an online fitness subscription service:
Step 1 – Gather Historical Financials
The startup may need to gather historical financials to project the following data and build a bottom-up financial model:
- Number of Leads: The company estimates the number of potential leads it can generate through marketing channels.
- Conversion Rate: A percentage of leads that are converted into paying subscribers.
- Average Revenue per Subscriber (ARPU): The estimated revenue from each paying customer.
- Churn Rate: The percentage of subscribers expected to cancel each month.
Step 2 – Sales Forecast Calculation
After gathering historical financials, the startup arrives at the following assumptions:
- Number of Leads Per Month: 1,000
- Conversion Rate: 10%
- Churn Rate: 5%
- ARPU: $20
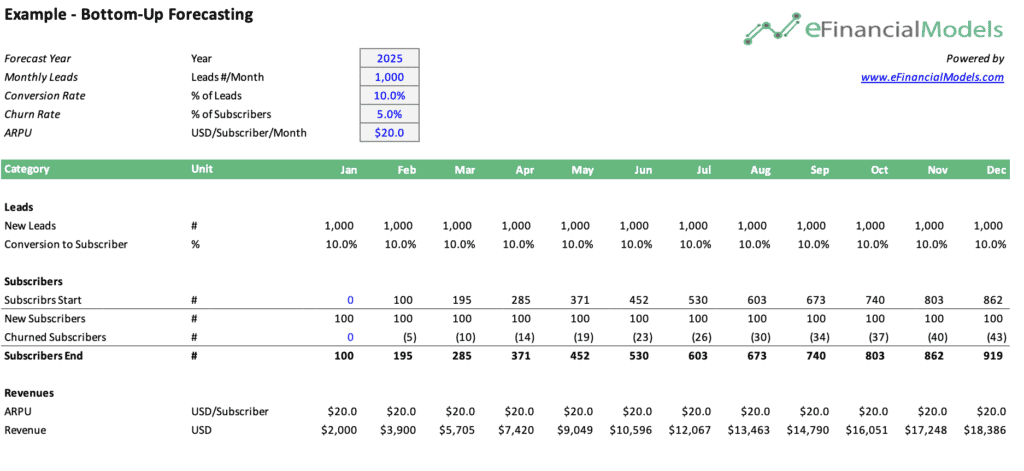
We can now perform the sales forecast calculation in our bottom-up financial model. The following Excel table illustrates these calculations and forecast sales over 12 months:
Step 3: Financial Analysis
This bottom-up financial model forecasts subscriber growth, revenue, and churn for 2025. The forecast is based on inputs like the number of leads, conversion rate, churn rate, and Average Revenue per User (ARPU). The consistent increase in new subscribers month over month indicates positive growth. The increasing revenue aligns with subscriber growth, showing a positive trend that implies the plan can become profitable over time if managed correctly. However, the churn rate is set at 5%, but there’s no detailed analysis of why customers churn. Understanding customer engagement, satisfaction, and reasons for churn for an online fitness plan is key to improving retention rates.
A bottom-up financial model helps businesses with detailed financial forecasting. It begins with small components—like sales units, cost per unit, and salaries—and builds up to create a full projection. Startups benefit from its realistic view of costs and revenues, aiding decision-making. This model is also useful for budgeting, scenario analysis, and project planning, where understanding each input’s impact is key. Focusing on detailed operational assumptions provides a clearer view of strategic planning and resource allocation.
Key Differences Between Top-Down vs. Bottom-Up Financial Planning
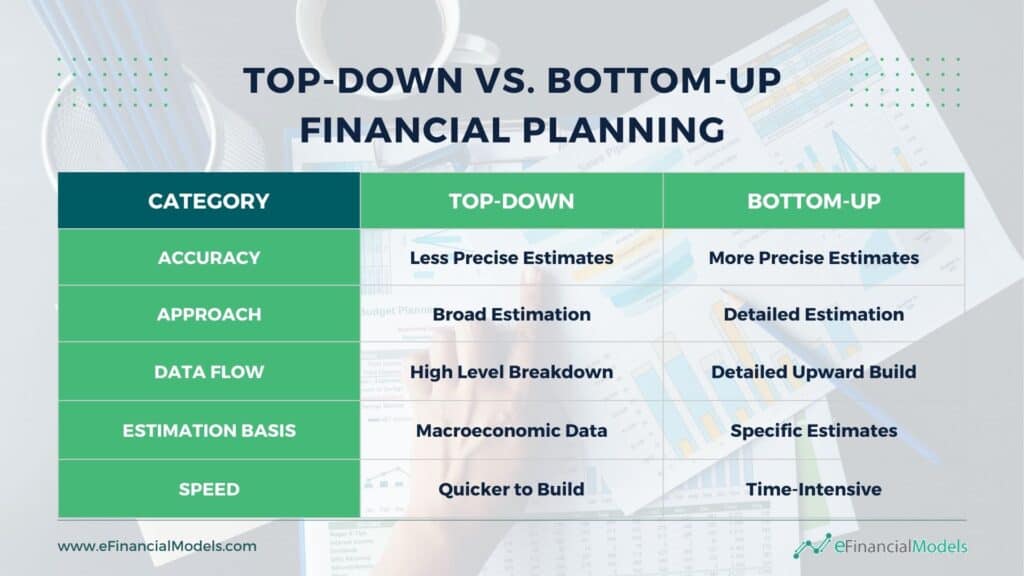
Top-down vs. bottom-up financial planning offers distinct perspectives. They differ in how data is gathered, and decisions are made. They represent fundamentally different ways of structuring decision-making processes, impacting how accurate the resulting estimates are, the scope of their application, and the flow of data involved.
Accuracy
Top-down financial planning starts with big-picture estimates. You look at the market size, potential revenue, and industry trends. These broad numbers trickle down to set targets for different business areas. While this approach is quick, it often needs more precision. It relies on assumptions that may not capture specific details, making it less accurate for financial modeling.
On the other hand, bottom-up financial planning builds from the ground up. It starts with detailed data, like individual sales forecasts, costs, and operational metrics. The model reflects a more granular reality by adding up these smaller components. This approach generally leads to more accurate financial projections because it captures the unique elements of your business. However, it takes more time and requires thorough data collection for reliable results.
Approach
In top-down planning, you start with macro-level financial targets. It is ideal for situations that need broad estimates. It works well for tasks like market potential analysis and strategic planning. For example, a top-down approach quickly estimates the overall market size and growth potential when exploring new markets.
In contrast, bottom-up financial planning is best for detailed estimates. It’s commonly used for budgeting, operational planning, and financial forecasting. This more detailed approach allows for realistic forecasting because it involves insights from those closest to operations. Bottom-up planning is ideal for capturing operational details and for organizations that value input from different teams.
Data Flow
Top-down financial planning starts from the big picture. The data flow in the top-down approach involves high-level breakdowns from overarching company goals or macroeconomic projections. These high-level figures are then allocated across different business segments or departments, providing a general framework within which they must operate. In financial modeling, the data flow begins with overall assumptions, such as market growth rates, and ends by breaking these down into detailed departmental or project-level numbers.
Bottom-up financial planning works in the opposite direction. It begins with the specifics and builds upwards. Each department or unit provides detailed input data, which is then aggregated to form the overall picture. In financial modeling, data flows upward, starting from granular inputs like employee costs or product sales. These detailed components are combined to form the overall financial picture, giving a clear view of the company’s realistic capabilities and potential growth. This upward flow of information provides a more detailed estimate as it captures operational-level nuances, making it easier to understand where adjustments may be required during the planning process.
Estimation Basis
Top-down financial planning starts with a big-picture view. Companies estimate future performance by looking at macroeconomic data. They take a high-level financial goal—like a specific revenue target—and break it down into smaller components for each department or product line. This approach is useful when quick projections are needed, or historical data isn’t available. However, it can be less accurate because it relies on broad assumptions, which may not reflect the nuances of each business segment.
In contrast, bottom-up financial planning starts from specific estimates. It builds estimates by aggregating detailed inputs from each team, product, or cost center. This approach often provides more realistic and granular estimates based on specific data points and actual operational insights. While bottom-up planning takes longer and requires more coordination, it results in a detailed and reliable model that better reflects the company’s capabilities and limitations.
Speed
One significant advantage of top-down financial planning is its speed. It is faster because it uses a big-picture approach. You start with overall company goals and use assumptions to create a financial model. This saves time by focusing only on key metrics. The model doesn’t dive into small details. Instead, it estimates the company’s performance based on high-level targets. This makes it a quick method, especially when you need a fast overview.
The bottom-up approach, however, is more time-intensive. It takes longer because it requires gathering data at a detailed level across the organization. The process involves verifying the accuracy of inputs. Every piece is put together to get the final picture. Bottom-up planning works best if you need precision, but top-down financial planning is faster.
Sophisticated Financial Modeling uses the Bottom-Up Planning Approach
Top-down vs. bottom-up are two different approaches to business planning and financial modeling. Top-down financial planning starts with a broad view, focusing on market size and potential, then breaks down into smaller goals. It’s great for strategic planning and high-level forecasts. In contrast, bottom-up financial planning starts with detailed data and operational insights, creating realistic and precise projections. This approach is ideal for businesses needing tight control over specific metrics. The choice between these methods depends on your goals, the accuracy you need, and the level of detail required.
Bottom-up forecasting is ideal for financial modeling when accuracy and a deep understanding of a business’s internal workings are crucial. The method uses detailed data, like unit sales, costs, and resource allocation, to produce precise insights. It captures daily business complexities, offering a realistic financial outlook. This makes it effective for aligning financial projections with operational capabilities, giving managers confidence in their plans. Though time-consuming, its reliability makes it valuable for detailed budgeting and planning.
Ready to choose the right financial modeling approach for your business? Dive deeper now to make informed decisions!

















































You might also like:
- 10 Main Elements of a Business Plan
- 10-Step Financial Planning Checklist for Smart Executives
- 5 Practical Tips to Help Raise Funds For Startups
- Fundraising
- Master the Art of IRR Calculation: A Comprehensive Guide for Investors
- Finding a Valuation Model for Your Business
- Real Estate
- How to Make a Startup Financial Plan for Fundraising?
- Key Financial Ratios
- Financial Projections
- The Potential of Carbon Capture and Sequestration
- Understanding the Debt Service Coverage Ratio: An Essential Metric for Financial Analysis
- Why Financial Forecasting Models Are Vital for Your Business
- How to Write a Business Plan Step-by-Step
- Boost Your Business’s Financial Management with this Excel Budget Template
- Education
- Agriculture
- Business Valuation
- Are EV Charging Stations Profitable?
- Steps to Building Financial Models in Excel
- Debt Amortization Table