
0 ITEMS

Forecasting Sales Using Product Life Cycle

Forecasting sales through the product life cycle helps businesses plan for growth, competition, and decline phases.
- The product life cycle includes four stages: introduction, growth, maturity, and decline, each with unique challenges.
- Quantitative methods like straight-line growth or sales indexes are commonly used but may not capture seasonality or product failure.
- Using a product life cycle model enables more realistic sales forecasting by considering market demand, product reinvestment, and timing of new product launches.
- Monitoring product life cycle trends helps identify when to innovate or replace products to sustain revenue.
- Accurate forecasting supports strategic decision-making, resource allocation, and financial stability over the long term.
The video summarizes the different types of forecasting sales when dealing with product life cycles.
A product’s life cycle is the period from its introduction to consumers until it declines or is no longer sold and removed from the market. The product life cycle stages are usually divided into four: introduction, growth, maturity, and decline. Each presents unique business challenges and opportunities, impacting cost, promotion, pricing, and revenue in distinct ways.
- Introduction stage is when your product is first launched in the marketplace and where demand is created. This stage may result in slow sales as it can take time to move through, depending on the complexity of the product, how new and innovative it is, how it suits customer needs, and whether there is any competition in the marketplace. The cost of products in the introduction stage is initially high due to research and development, production setup, and market entry. During this stage, building product awareness and educating the market is intensive. Pricing may be high to recoup development costs or low to attract customers quickly. Revenues are typically low as the product is new and the customer base is still established..
- The growth stage is when customers have accepted the product, and there has been an increase in market share. The time it takes to achieve steady growth entirely depends on your product, the current market landscape, and the adoption rate of customers. Costs per unit typically decrease during the growth stage due to economies of scale in production and increased efficiency. Promotion remains high but shifts towards more aggressive advertising to maximize market share. Prices may remain high if demand is strong or can be reduced to capture more market share. Revenue rapidly increases as the product gains market acceptance and brand recognition.
- At the maturity stage, a product is established in the marketplace. By now, many consumers will have bought the product, and competitors will be shown, meaning branding, price, and product differentiation become even more critical to maintaining a market share. Costs are lower but may rise due to increased marketing to defend market position. Promotional costs can be high to fend off competitors. Competitive pricing becomes crucial as the market becomes saturated. Revenue peaks and stabilizes as the product is well-known and the market is saturated..
- The decline stage of the product life cycle is associated with decreasing revenue due to market saturation, high competition, innovations that supersede existing products, and changing customer needs. Companies must weigh the costs and benefits when deciding whether to discontinue the product, sell the manufacturing rights to another business, find new uses for the product, or tap into new markets. Reducing costs is critical to maintaining profitability. The promotion was significantly reduced, often focusing only on loyal customer segments. Prices may be reduced to clear inventory or held for niche segments. Revenue declines as market interest wanes, newer technologies emerge, or consumer preferences shift.
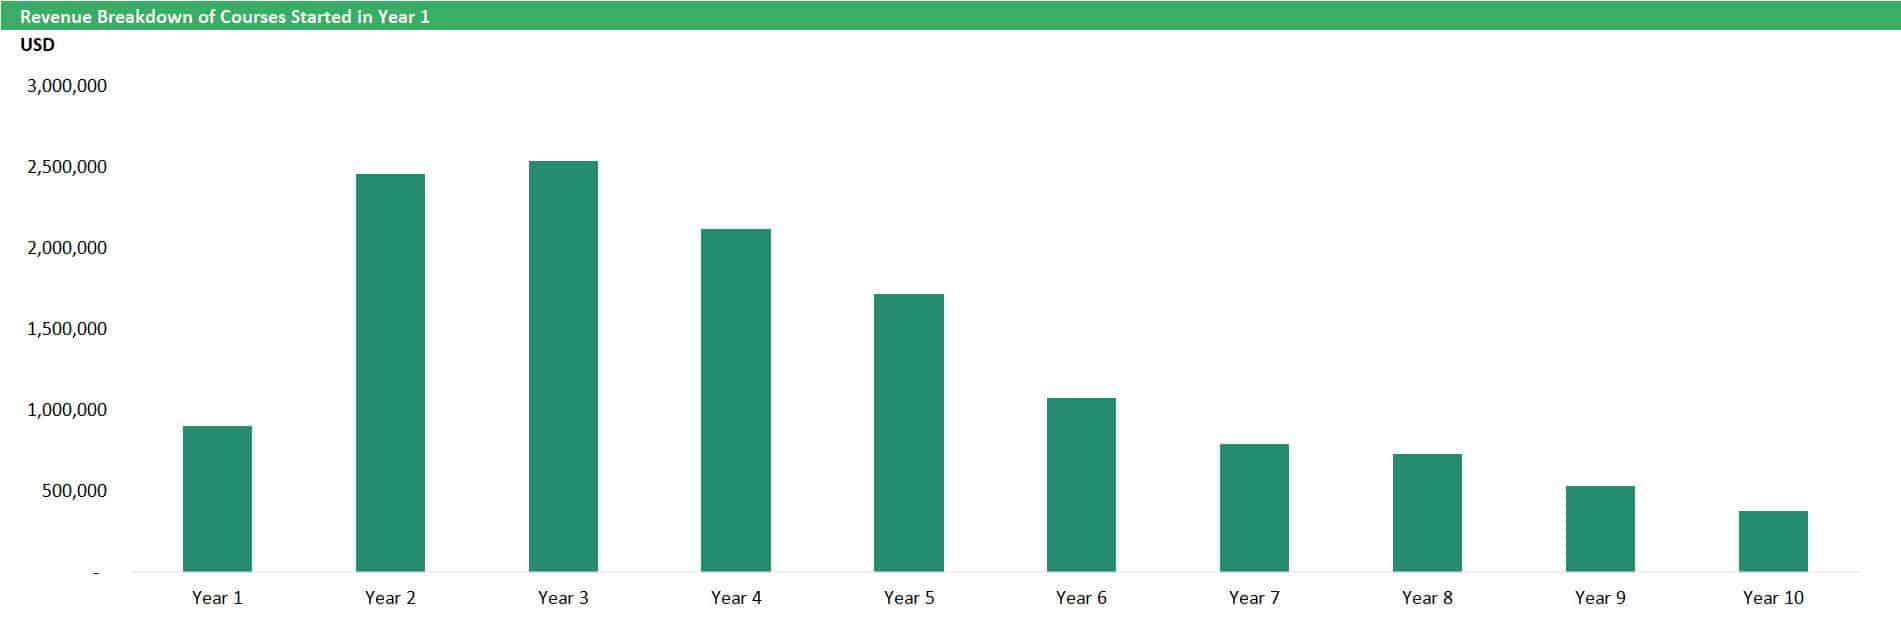
While all products have a life cycle, many of the most successful ones can maintain the mature life cycle stage for many years before any eventual decline. These product life cycle stages are demonstrated in the bar chart below:
Traditional vs Product Life Cycle Forecasting
Quantitative financial forecasting is straightforward in generating forecasts based on complex data. The most used quantitative sales forecasting technique is the straight-line or growth rate, where the rates are applied to quantities or volumes sold, price assumptions, or both. This method is easiest to implement and reasonably estimates what businesses can anticipate in future financial scenarios.
Steady Growth Products
Sales are forecasted simplistically and may result in a flat curve or steady growth line. Flat sales would be appropriate for a product like biodiesel, where the volume output is steady and is dependent on production capacity. If no forecasting sales growth rate is applied, the revenue would be the same per month.
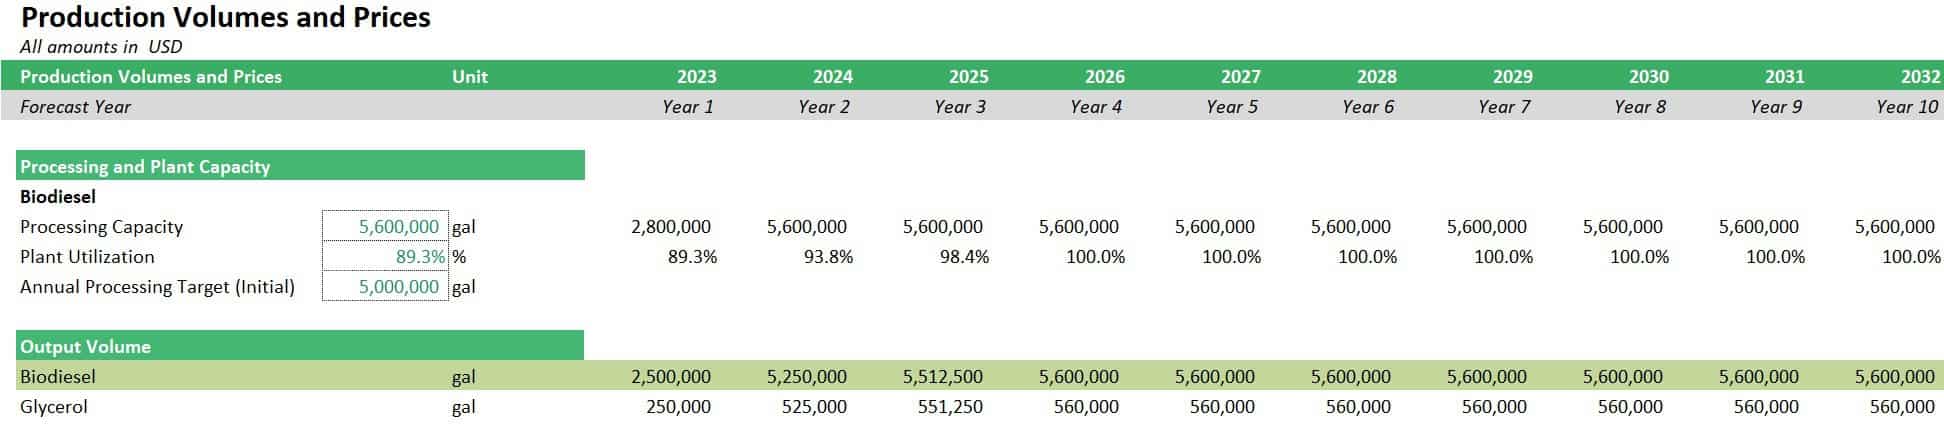
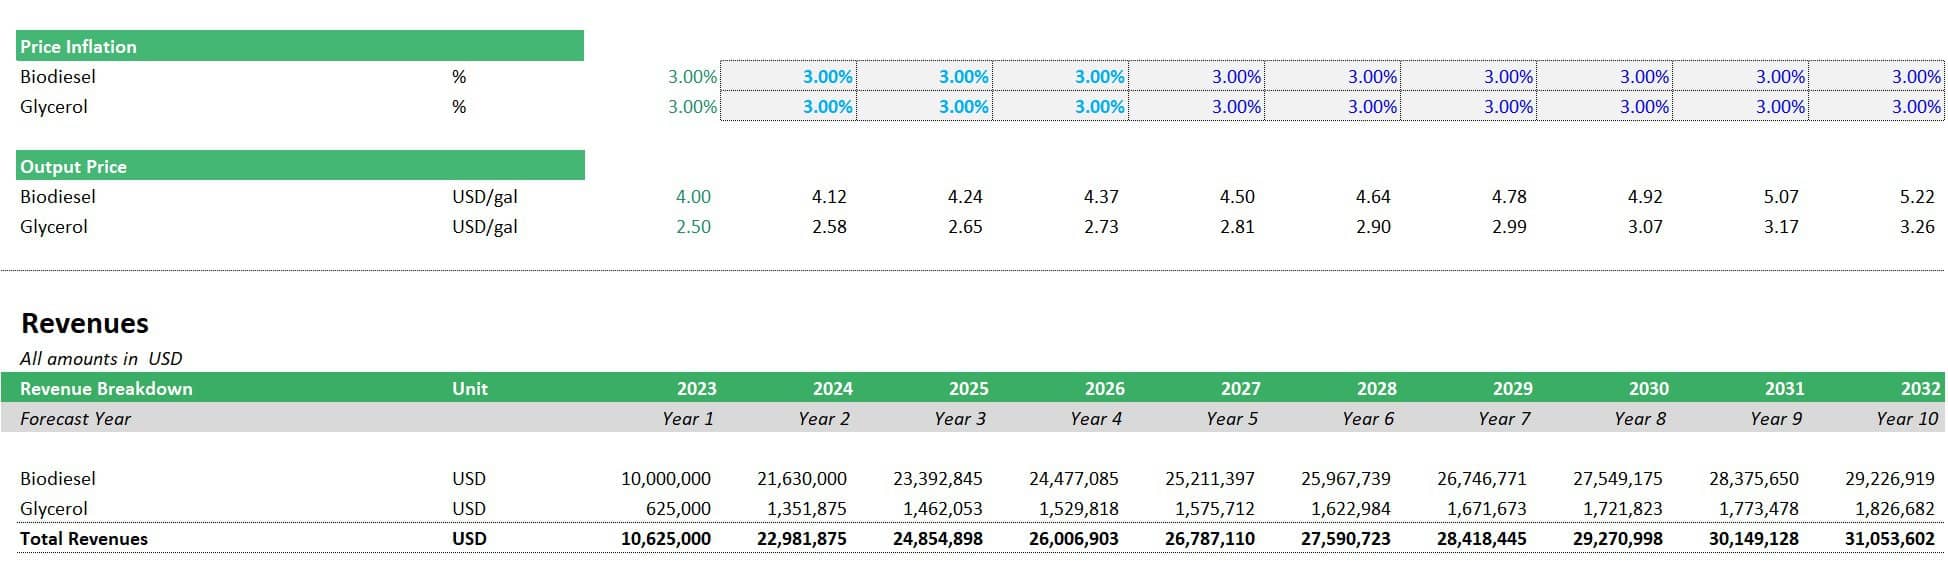
If the Biodiesel Manufacturing Plant Financial Model applies the growth rate to the price assumptions, and there is a constant output volume due to processing capacity, this would lead to a steady yearly increase in revenue.
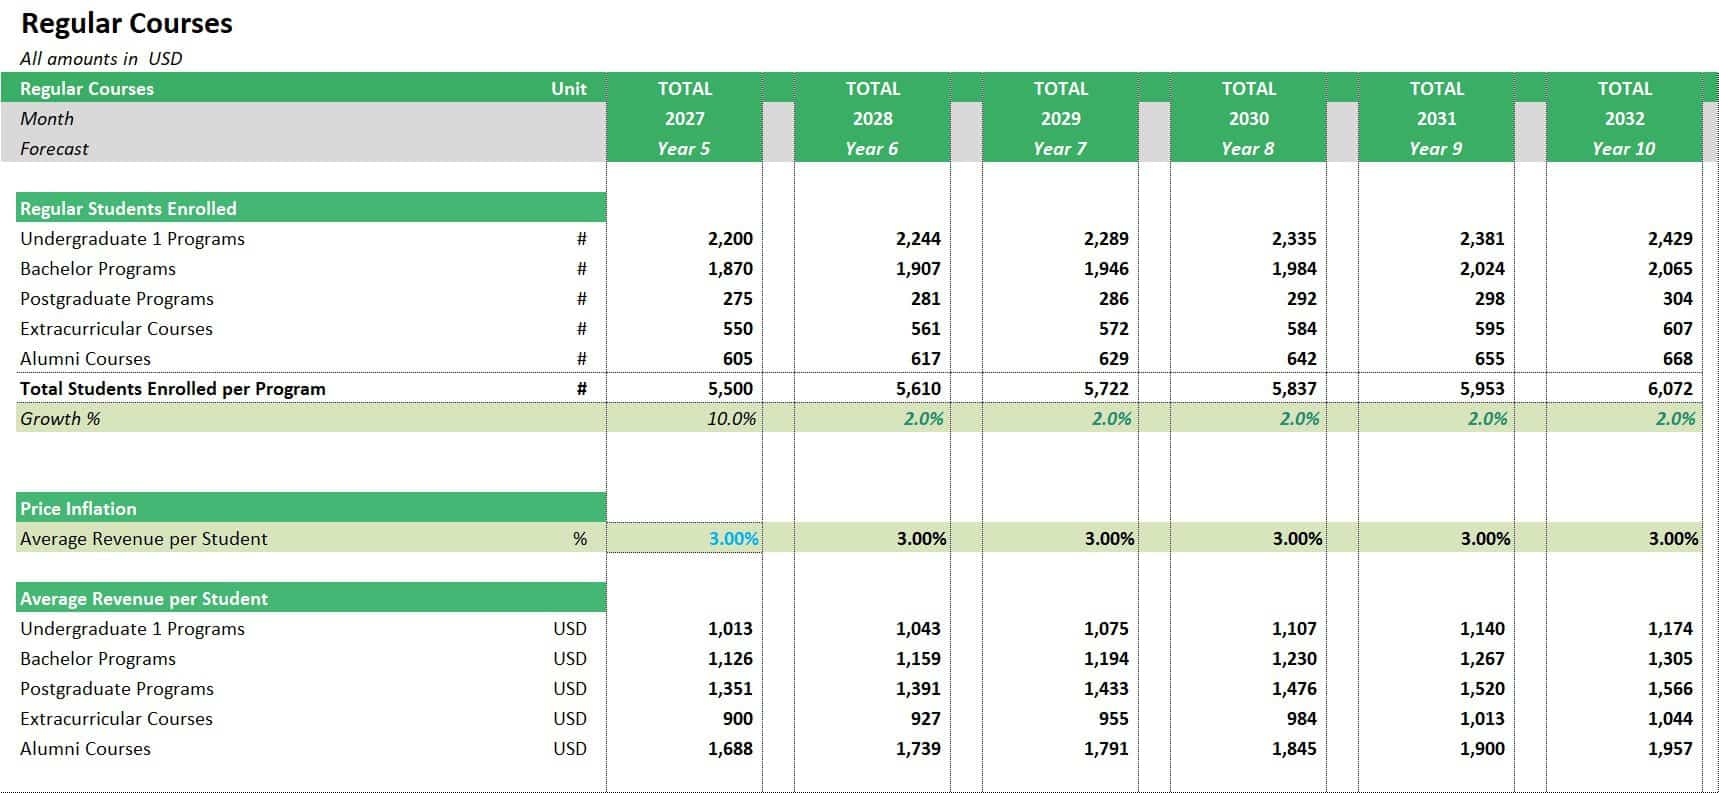
Other products or services, such as the University and School Financial Model, apply forecasting sales growth rate to the number of yearly regular students enrolled and the average revenue charged per student, resulting also in steady revenue growth.
Fashion or Cyclical Products
It is important for certain products, such as fashion clothes, to analyze and forecast revenue using product life cycles. Fashion trend tends to experience short product life cycles as the products will sell at their peak during their seasonal months and start to decline in the following months until it is no longer sellable. The traditional forecasting sales methods fail to consider the seasonality or changes in market and demand; hence, does not reflect reality.
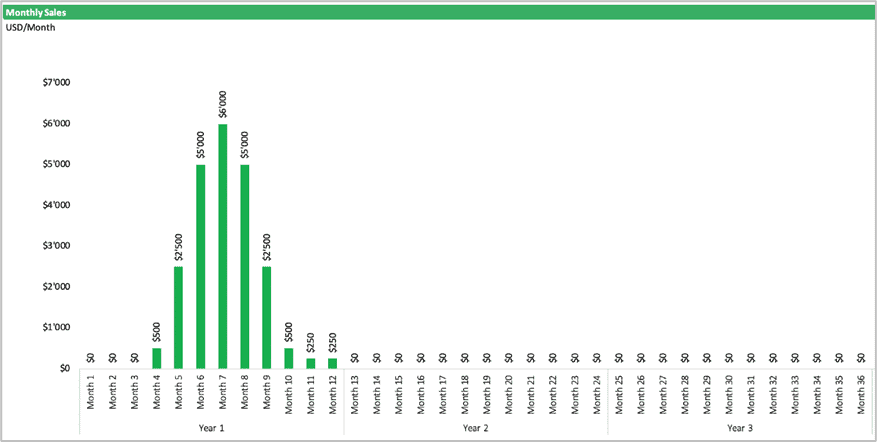
Failed Products
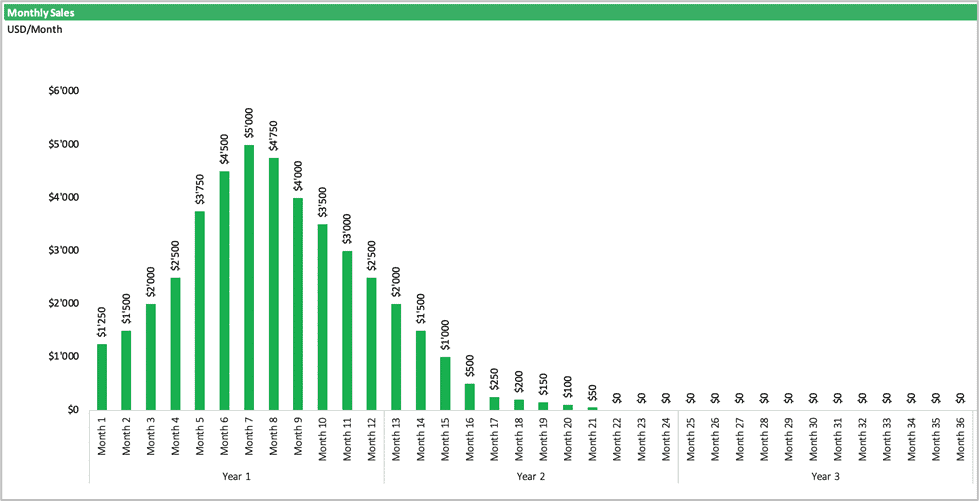
Financial planning often does not consider failure, but this is a reality and will occur. Products launched will fail to meet the expectations at some point, resulting in a drop in revenues until they reach zero. The traditional forecasting sales methods also fail to consider the possibility of product failure.
Online Course Provider Multichannel Financial Plan for Product Life Cycle Management
Product life cycle management can help increase profitability and maximize returns. At the same time, a failure to do so may lead to an increase in their marketing and production costs, ultimately leading to the limited shelf life for their product(s). Utilizing a product life cycle template Excel, like an Online Course Provider Multichannel Financial Plan, can significantly enhance your ability to find, analyze, and interpret product life cycle data, especially in financial analysis, business planning, and investment evaluation.

The Online Course Provider – Multichannel Financial Model is designed to help online course providers plan for their business’s financial viability and profitability. This product life cycle template Excel uses bottom-up monthly revenue and cost schedules to create a financial plan based on five to ten years (depending on the model version). It carries 50 to 100 online courses, divided into types, product life cycle types, start and end dates, individual course prices, sales channels, and corresponding sales allocation percentages.
To understand how to forecast a product life cycle in a product life cycle template Excel, we have put this simple step-by-step guide illustration:
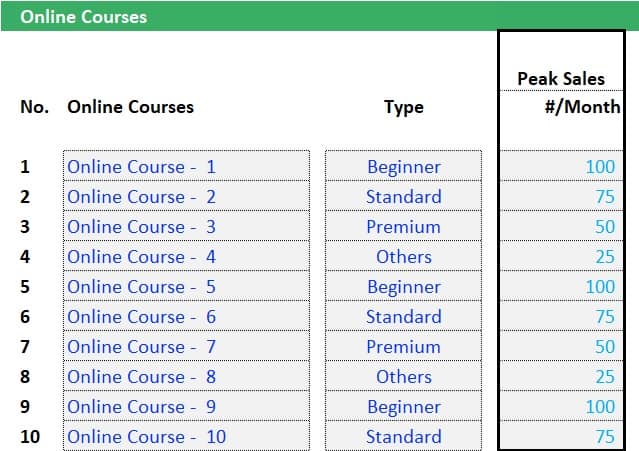
1. Inputting Peak Sales per Month
Peak sales at a product level will be the reference point of the product life cycle index.
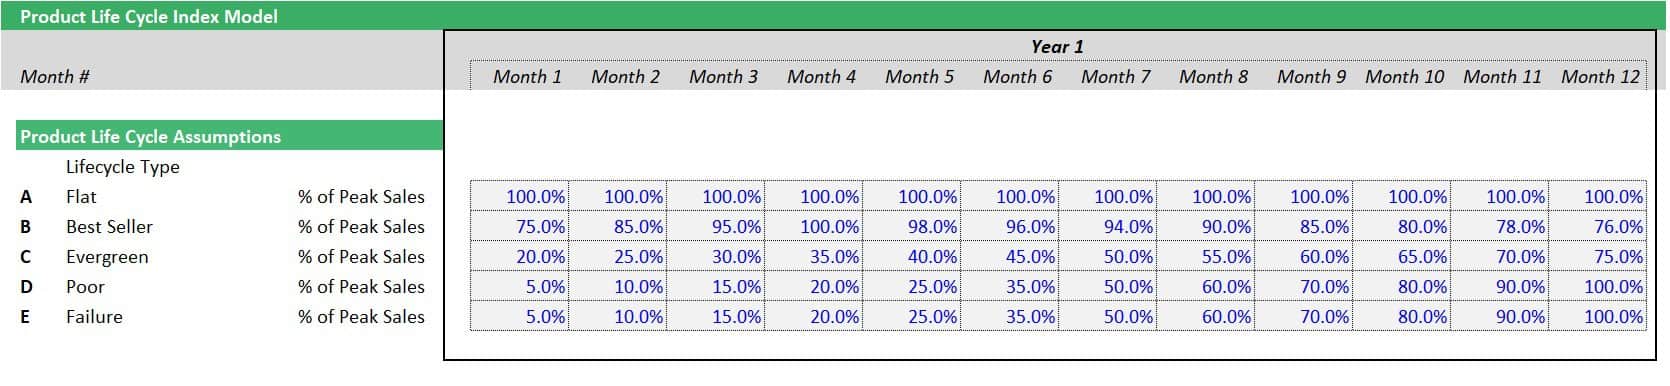
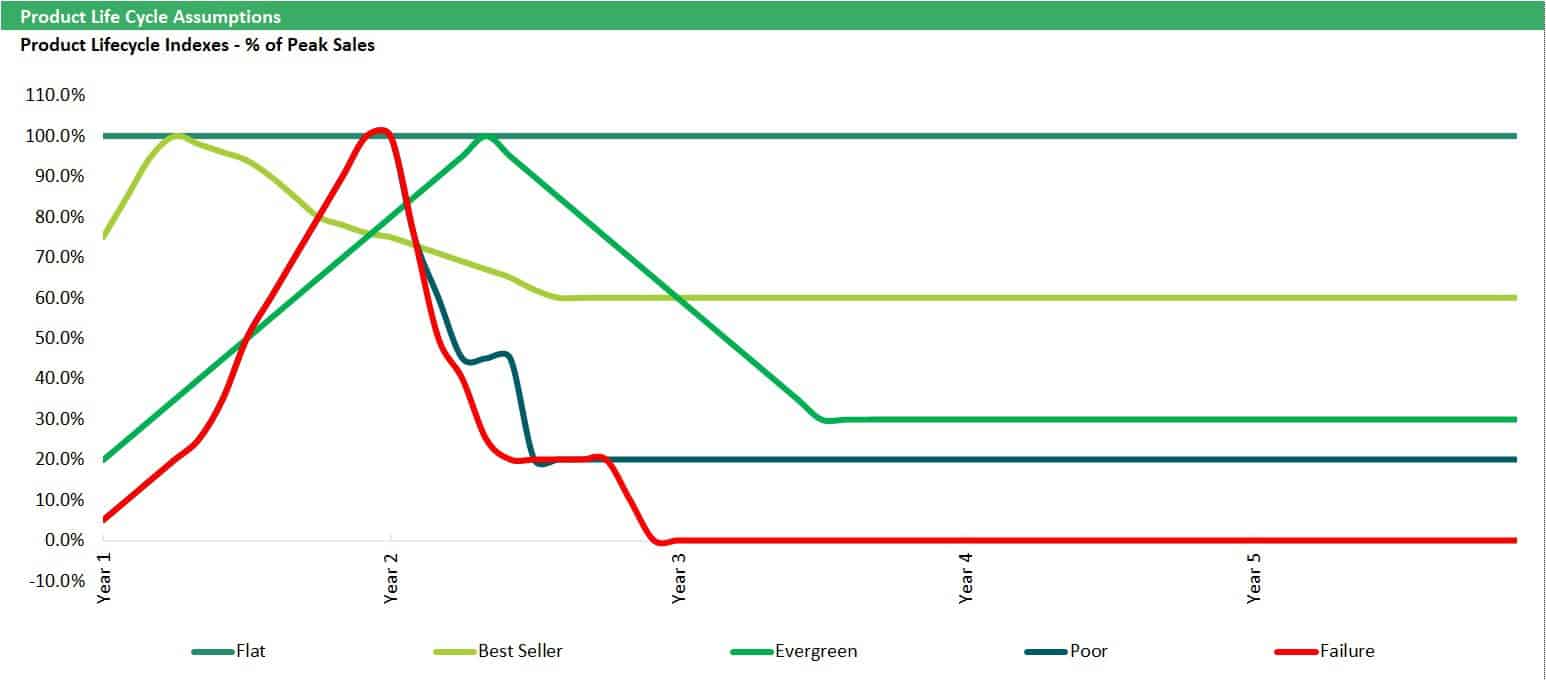
2. Plotting a Product Life Cycle Index
The product life cycle modeled via indexes will define the sales pattern of products, predicting the rise and fall. The index can stretch over one year or several years.
3. Forecasting Sales
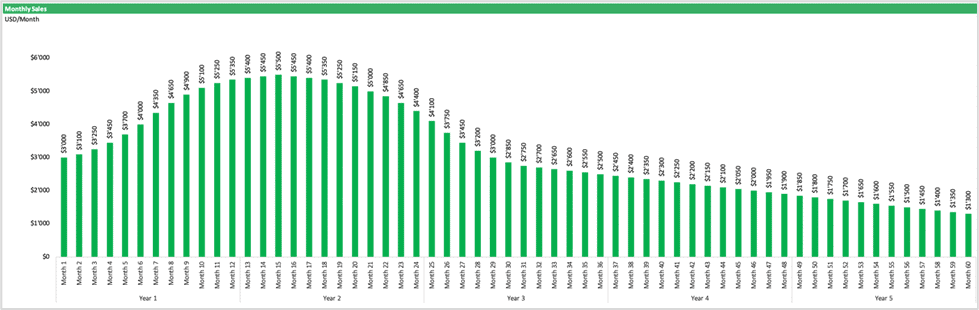
Forecasted sales are calculated by multiplying the peak sales by the life sales index and the product prices that would reflect the expected product life cycle.
As illustrated in the monthly sales forecast below, when courses are first launched, course revenue is expected to rise as the marketing kicks in until they peak. Once new competitors enter or the courses become outdated, revenues will result in a steady decline as the market share drops.
Launching new Products to Compensate for expiring Products on our Life Cycle
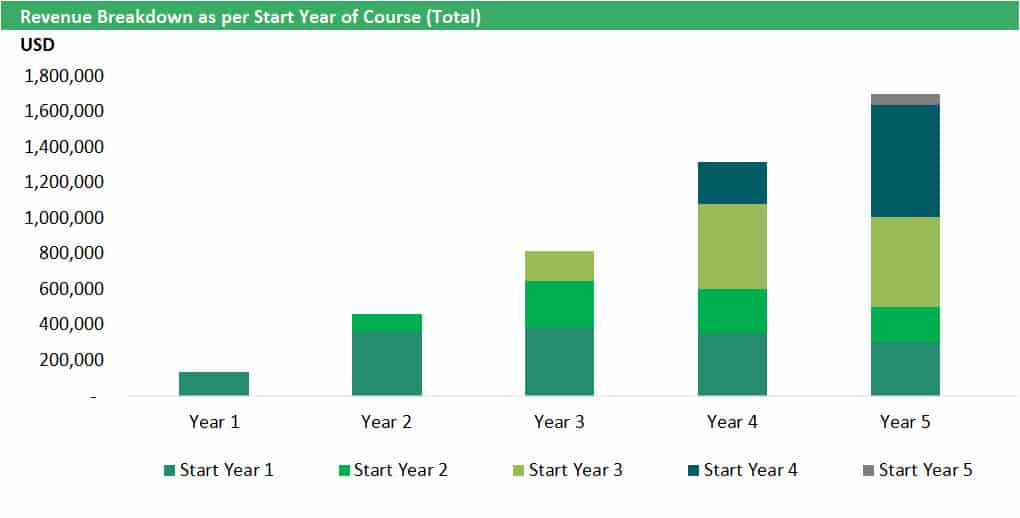
The product life cycle concept highlights that, sooner or later, all products die and that if management wishes to sustain its revenues, it must replace the declining products with the new ones.
Online courses are not introduced in year one and are forecasted through the life cycle model. Because of the product life cycle effect, sales will decline. New courses are introduced in different years to compensate for the drop and sustain or increase the revenue. It is essential to consider the market demand and the cost consequences in identifying how many courses will be launched and in what year.
A sales forecast is not definite as events may or may not go according to what was estimated. But if done correctly and realistically, the estimation should offer a good idea of what to expect in the future.
Using a Product Life Cycle Model can forecast Sales more realistically
Examining products concerning market needs, competition, costs, and profits allows companies to work out whether their products meet the needs of the target market.
With the proper product life cycle, companies will be able to pivot their product focus to maintain longevity in the marketplace by reinventing and innovating with existing to reinvigorate demand and elongate the product’s market life. Knowing when a product is going into decline enables companies to develop a new replacement product or change direction to stay abreast of a changing marketplace.
Understanding the product cycle is a vital part of sales forecasting. It provides helpful information that guides management to devise a more detailed roadmap for the business, prepare an effective product plan, make better strategic decisions, and help create more accurate financial forecasts.
If you’re looking for financial model templates for forecasting, please feel free to browse our selection below:























































You might also like:
- Financial Forecasting Models by eFinancialModels
- Why Financial Forecasting Models Are Vital for Your Business
- 10 Tips to Develop a First Class Business Valuation Report
- 10 Main Elements of a Business Plan
- How to Make Smart Decisions with 6 Key Financial Metrics?
- How to Use Excel for Financial Analysis?
- Steps to Building Financial Models in Excel
- Understanding the Levelized Cost of Energy Formula
- Debt Service Coverage Ratio: An Essential Metric for Financial Analysis
- Creating a Budget Plan – Using the Best Excel Budget Template
- How to Create a Price Comparison Template?
- Sales Tracking
- Scenario Analysis
- E-Commerce & Web Shops
- Automotive Supplier
- Financial Model – Valuation of Tax Loss Carryforwards
- Simple Budget Planner Template
- What Is Financial Modeling In Excel – Crash Course
- Top 5 Principles of Corporate Finance
- Financial Projections

