What Is Financial Modeling In Excel – Crash Course

Are you building a business? Are you looking for funding? Are you evaluating different investing in different business projects? You might have answered yes to at least one of these business questions. Perhaps yes to all three. To answer questions such as these, understanding what the financial prospects via an Excel financial model become critical. Whatever business questions you may have or which stage in the process of finding answers, you have realized Excel financial modeling becomes an important topic. Or maybe, an interesting one!
This article will get your feet wet on what financial modeling in Excel is, why Excel financial models are preferred and who are the people who build it. Also, a brief discussion of essential Excel formulas and functions needed on how to build a financial model. An outline of financial model types with links to Financial model Excel templates is available. Lastly, what common mistakes to avoid with Excel financial modeling.
What Is Financial Modeling In Excel
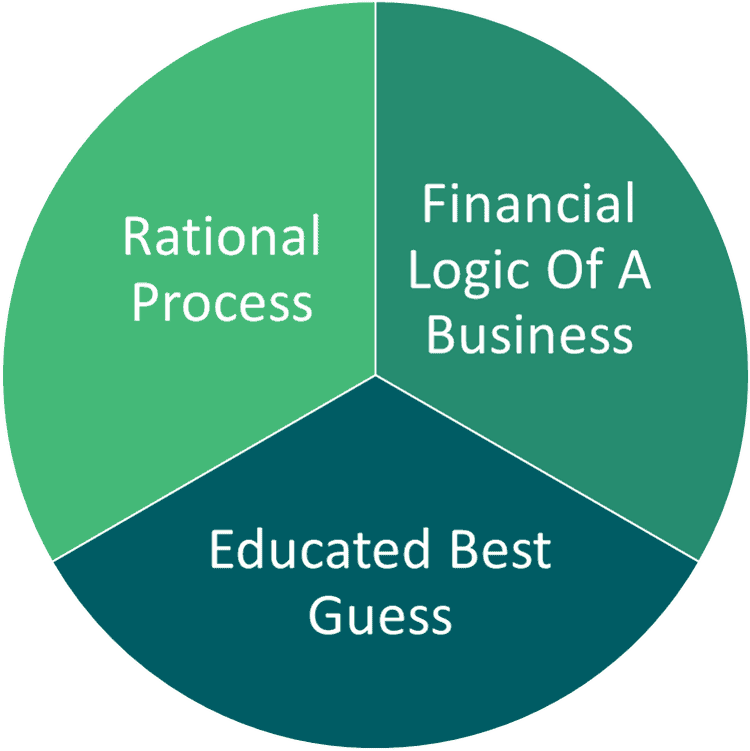
When you type “What is Excel financial modeling” in the Google search bar, there are about tens of millions of results. A majority of the results will ramble away with business jargon, fancy words, and long-drawn-out meaning. However, there are three main key concepts to understand what financial modeling in Excel is.

- Rational process. Excel financial modeling involves a series of steps and actions carried out to achieve a specified goal. Bear in mind, these steps and actions are based on clear thought and reason. Simple, well-documented, easily-communicated, and error-proofed procedures are critical. Non-essential and repetitive steps are avoided.
- Financial logic of a business. The rational process of an Excel financial model is used to describe and understand a business logic, asset, or project. How does a business earn money? What products or services it provides? What risks are involved in this particular asset type? What economic factors affect an asset’s return? Why is project A better than other proposed projects? A financial model paints a picture of what a business is and how it goes about operating.
- Educated best guess. The knowledge and process involved in Excel financial modeling are then used to reach an educated best guess. The success and failure of a business, asset, and project involves many variables, assumptions, estimates, and scenarios. Nothing is known with 100% certainty but an Excel financial model is a key tool of a well-informed decision-maker.
Now, we combine these three concepts to form a straightforward and comprehensible definition.

The Why, When, And Who In Excel Financial Models
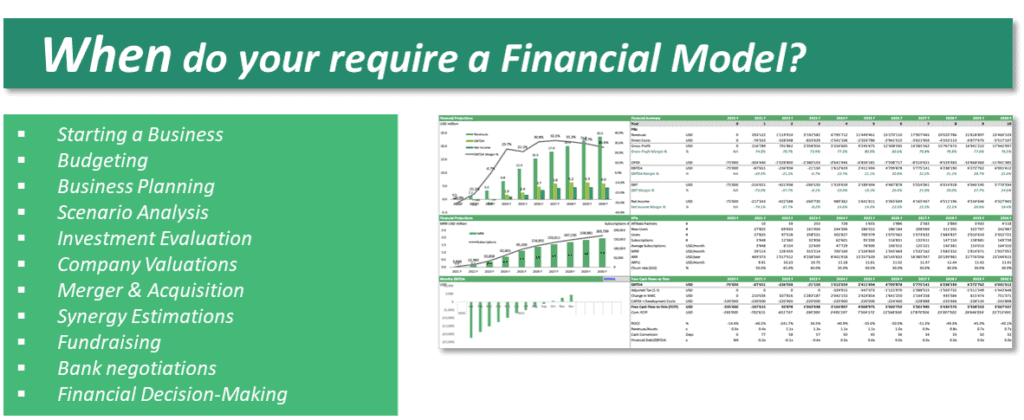
Financial modeling in Excel is used for various reasons and scenarios

Forecasting revenue and budgeting cost & expenses for the next 3 to 5 years are based on varying key assumptions. Excel’s financial modeling presents a range of results, from worst-case to best-case financial scenarios. The range of results a financial model in Excel presents is a useful tool for analyzing risks, developing strategies to mitigate risks, estimating returns, allocating resources, etc.
Using an Excel financial model can help you understand the business and explain the logic behind how revenue is generated, how assets are utilized, how resources are allocated, etc. Financial models in Excel can be a tool to determine the value of a company or asset as well as capital or funding needs. How to Value a Business?
Financial modeling in Excel can be used at any stage of a life of a business or asset; it can be used at the very early or planning stages, growth phase, and mature phase.

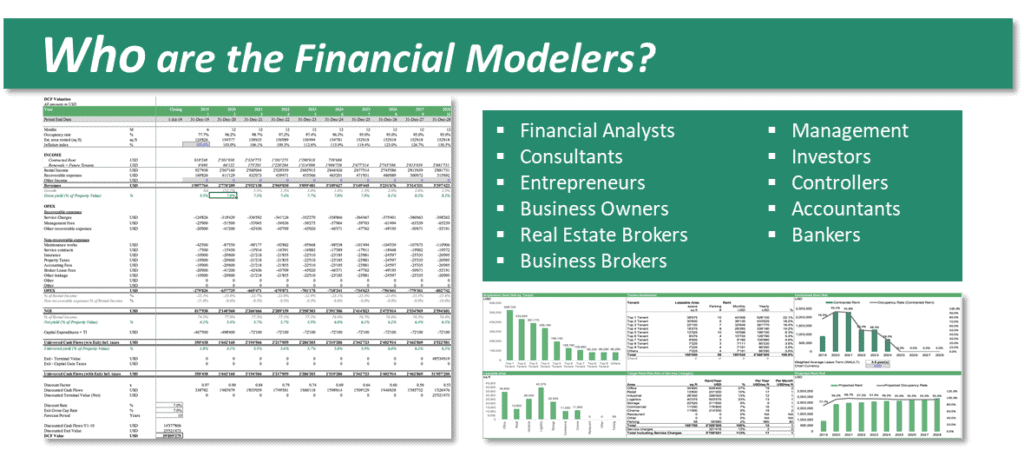
Financial models in Excel are mostly developed by financial modelers but with its many uses, the classification is diverse.

Excel Financial Models Are Preferred
When most people think of Excel financial modeling, they quickly imagine a spreadsheet with columns and rows filled with numbers and calculations. But that’s not surprising as it is largely built in Excel. An Excel financial model compared to a spreadsheet is more structured and dynamic. It considers the impact of several variables (inputs) to hypothetical scenarios (outputs).
Every Excel financial model type uses assumptions, calculations, and estimates of variables and other factors to reach a better understanding of a business needed for making informed decisions. Together with Accounting, Finance, Economics, and Math concepts, these are presented, evaluated, and analyzed using Microsoft Excel. But, why an Excel financial model?
Financial modeling in Excel is preferred because:
- Easily accessible. Every business has Microsoft Excel installed in their office computers so there is no need to purchase a new license or software.
- Widely used. Microsoft Excel has no borders, it can be used across different industries, regions, and institutions. Microsoft Excel can be used by a US-based manufacturing company’s sales department as well as a UK-based IT company’s HR department. Most users have some familiarity with Excel, so they can navigate and edit.
- Wide range of tools available. Microsoft Excel is considered as a Swiss-army-knife software. When used properly, it has features, functions, and formulas that go hand in hand with varying assumptions, inputs, and scenarios. The IF function allows you to set parameters to test different scenarios. When working with large data, Excel’s Lookup functions (VLOOKUP, HLOOKUP)help you to find and retrieve specific information for whatever financial model type needed.
- Customizable and Flexible. Not every business is the same, each has its own unique attributes, assumptions, estimates, and calculations. With Excel’s many tools, it allows you to incorporate these into every financial model type. For example, Excel’s Data Validation allows you to control the type of input entered by the user. Aside from presenting rows and columns of numbers, Excel allows you to present data and output using charts and graphs thus allowing a more visual presentation.
Excel Formulas And Functions For Building Excel Financial Models
Excel has so many formulas and functions to help you build any financial model type. The below list is just a few of the most commonly used for Financial modeling in Excel.
- IF Function is a logical-test based formula that gives you the flexibility to set multiple parameters.
- SUM Function adds numerical values in a range of cells.
- SUMIF Function. Combines the SUM function and the logical-test of the IF Function.
- SUMPRODUCT Function multiplies numerical values in a range of cells then adds the products
- AVERAGE Function calculates the arithmetic mean of a set of numbers.
- COUNT Function is used for counting the number of cells that contain numbers. Learn 5 Easy Ways on How to Use Count Functions in Excel for Business. You can also combine the COUNT function with an IF statement using COUNTIFS function.
- MIN and MAX Function is used for identifying the minimum and maximum values.
- ROUND Function is used for rounding up numbers to a specified number of digits
- VLOOKUP Function searches for a piece of information from a table or data set by performing a vertical lookup.
- INDEX and MATCH Function a combination of 2 separate functions, INDEX function, and MATCH function, that searches for a piece of information from a table or data set by performing a 2-way lookup.
Key Elements Of An Excel Financial Model
With its many uses and designed for many end-users, financial models in Excel may vary depending on the purpose, the type of business, asset or project, and the level of analysis and calculations needed.
A thorough walkthrough of how to build a financial model is laid out in this Financial Modelling in Excel for Beginners
- Assumptions. Based on historical financial data and metrics of the business you can build a Financial Model in Excel by making assumptions on the metrics and ratios for the business’ future performance. Depending on the Financial model type, common assumptions made are on Price, Sales and Production Volume, Net Working Capital, Debt, etc.
- Operating Model. A model that forecasts a company’s operations and details the sources of revenue, operating and direct costs, debt, etc.
- Financial Schedules. A set of financial statements that presents the financial activities for the forecasted years. The Income Statement, Balance Sheet, and Cash Flow Statement are among these.
- Financial Ratios. Ratios are calculated to analyze the business’ historical performance as well as forecasted performance. Leverage, Liquidity, Profitability, and Efficiency ratios are commonly used for Financial modelling in Excel to identify the strengths and weaknesses of a company.
- Financial Metrics. Key measurements that reveal specific financial information that may not be apparent in financial statements and ratios. Commonly used metrics in Excel financial modelling are NPV, IRR, Payback Period, etc.
Types of Financial Models In Excel
There are many types of Excel financial models, here are basic and advanced models.
Basic Financial Model Types in Excel
- Three Statement Model. The most basic type of model and consists of the Income Statement, Balance Sheet, and Cash Flow Statement. This financial model type links all 3 statements using Excel formulas thereby reflecting any changes in inputs and assumptions.
- Discounted Cash Flow (DCF) Model. This financial model type is used to estimate the value of a company, project, or an asset-based on expected cash flows. The model follows the principle of the Time Value of Money and uses Excel’s NPV or XNPV functions.
- Budget Model. Typically designed for monthly or quarterly figures and determines “what the business wants to achieve”. But can also be used for personal and household purposes.
- Forecasting Model. Primarily used with the Budget Model and determines “what the business can achieve”. Designed to help a business plan and strategize its growth.
Financial Model Excel templates
Free Download Three Statement Model
Yearly Budget Templates in Excel
Advance Financial Model Types in Excel
- Initial Public Offering Model (IPO). Used to value a private company going public. Analyses Comparable Companies to estimate how much investors will pay for the stock.
- Merger & Acquisition (M&A) Model. Simulates the financial impact of 2 companies merging or 1 company taking over another.
- Leveraged Buyout Model (LBO) Model. Evaluates the acquisition of a company or asset using high levels of debt.
- Consolidation Model. Combines the financial performance of different business units into one single model.
- Sum Of Parts Valuation Model. Values a company based on the value of its different business units.
Financial Model Excel templates
Leveraged Buyout Financial Model in Excel
Consolidated Financial Statement Model in Excel
What To Avoid In Excel Financial Modeling
While Financial modelling in Excel is very useful for so many reasons, it is only as good as the one who built it and the assumptions entered into the model. It is important to recognize the roles and purpose a worksheet plays in the overall Excel financial model. Whether you built a financial model in Excel or the end-user, be aware of these common Financial modelling in Excel mistakes:
- Using Incorrect Financial History. Many financial models in Excel use data from The Three Main Financial Statements, the Balance Sheet, Income Statement, and Cash Flow Statement. Make sure the financial period is correct, figures are up-to-date and accurate before building a financial model in Excel.
- No Logical Structure. Most Excel financial models contain multiple worksheets, arrange the worksheets logically, and according to functionality. Make sure the end-user understands what each worksheet is for.
- Inconsistent Formats. Most worksheets in a financial model in Excel have the same month by month, quarter by quarter, or year by year presentations. Not only for presentation purposes but also usability, best to use identical column headings, a standard border and font style, color, labels, and descriptions.
- No Error Checks. Utilize Excel’s built-in error handling tools and audit functions, these will help Spot, Check, And Fix Errors in Excel. An Error Check Sheet or Sanity check is equally important, it tells you at a glance if formulas are calculating properly. Simple checks like if Assets equal Liabilities and Equity if the sum of each section adds to the Total, etc. are useful.
- Lacking Visual Presentations (charts and graphs). Humans process data far better when presented in charts and graphs. It just simply makes understanding large quantities of financial data easier. Excel charts and graphs paint a clearer picture of the business or asset than a table with rows and columns of numbers.

