
0 ITEMS

Coffee Roasting Business Plan Financial Model Excel Template
The Coffee Roasting Financial Model helps entrepreneurs, founders, business owners, consultants, and analysts turn a coffee roastery concept into a structured financial forecast. Instead of relying on rough estimates, users can model the economics of roasted coffee sales across direct-to-consumer, subscription, and wholesale channels, while connecting revenue assumptions to cost of goods sold, operating expenses, payroll, startup costs, cash flow, profitability, and funding needs. The template is designed to support business planning, investor conversations, lender submissions, internal budgeting, and strategic decision-making. Built for a coffee roasting business, the model gives users a practical way to evaluate pricing, volume, margins, production growth, green coffee costs, packaging costs, staffing plans, and overhead requirements. It helps answer the questions investors and stakeholders often ask, such as how much capital is required, what drives revenue, when the business can reach break-even, how profitable the roastery may become, and whether the cash flow can support growth. Because the assumptions are editable, users can replace the pre-filled inputs with their own market data, supplier quotes, sales targets, payroll plans, and operating strategy. The Coffee Roasting Financial Model is especially useful for anyone preparing a coffee roasting business plan, pitch deck, loan package, or expansion forecast. It includes a ready-to-use structure for reviewing performance under different assumptions, presenting clean financial outputs, and monitoring key metrics that matter in a roastery, such as gross margin, EBITDA, revenue growth, return on equity, payback timing, and cash runway. The model helps users move from a general business idea to a more disciplined financial plan that can be reviewed, tested, and shared. By using this financial model template, buyers can save time compared with building a spreadsheet from scratch while still maintaining full control over the numbers. The template works in Excel and Google Sheets, supports up to five years of projections, and is built to be customized for a startup roastery, an artisan coffee brand, or an existing business planning new wholesale accounts, subscription growth, or production expansion. It gives decision-makers a clearer view of the financial path ahead so they can plan funding, manage risk, and evaluate whether the coffee roasting business can reach sustainable profitability.
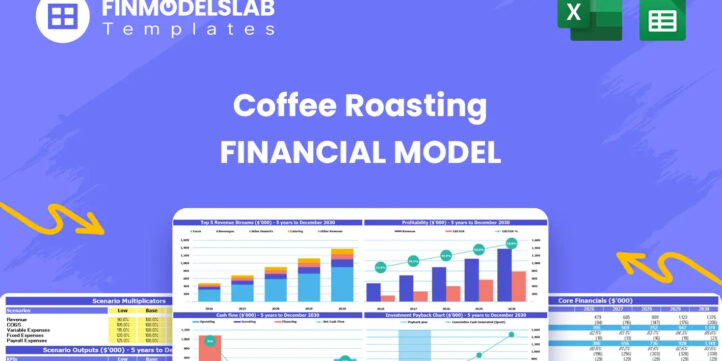


Financial Model Overview
The Coffee Roasting Financial Model is a ready-to-use financial model template built to help users plan, analyze, and present the economics of a coffee roasting business. It brings together the major financial drivers of a roastery, including direct-to-consumer bag sales, wholesale accounts, subscription revenue, green coffee bean costs, packaging, payroll, startup investment, operating expenses, cash flow, profitability, and investor return metrics. For entrepreneurs, business owners, consultants, analysts, and founders preparing business plans or funding documents, the model provides a structured way to replace guesswork with clear assumptions and forecasted outputs. Because the template is editable, users can adjust pricing, sales volume, product mix, production capacity, staffing, supplier costs, and growth rates to reflect their own coffee roasting concept. The result is a practical planning tool that supports launch decisions, funding conversations, operational budgeting, scenario testing, and stakeholder presentations.
All-in-One Dashboard
The all-in-one dashboard gives users a centralized view of the most important inputs and outputs in the Coffee Roasting Financial Model. Instead of searching through separate worksheets to understand performance, users can review core assumptions, projected revenue, profitability, cash position, return metrics, and other financial results in one organized area. This component is useful because a coffee roasting business has several moving parts, including roasted coffee volumes, bag sizes, sales channels, green bean costs, packaging expenses, payroll, and overhead. The dashboard helps connect those assumptions to high-level financial outcomes so users can quickly see whether the business plan is financially viable. For a founder preparing a pitch, a consultant building a client forecast, or an owner reviewing growth plans, this section provides a clear summary of the model’s conclusions. It also helps users identify which inputs have the greatest impact on financial performance, making it easier to refine pricing, capacity, cost structure, and funding needs before presenting the plan to investors, lenders, or internal stakeholders.
Low, Base, and High Scenario Analysis
The low, base, and high scenario analysis section helps users test how the coffee roasting business may perform under different market conditions. A roastery forecast depends on assumptions that can change, such as customer acquisition, wholesale demand, subscription growth, green coffee bean pricing, production efficiency, and operating costs. This component allows users to compare conservative, expected, and optimistic cases without rebuilding the model from scratch. Inputs may include lower or higher sales volumes, different pricing strategies, cost changes, staffing adjustments, or alternative growth rates. The outputs help show the impact on revenue, gross profit, EBITDA, cash flow, break-even timing, and funding requirements. This is especially valuable for decision-making because it shows how resilient the business may be if sales ramp more slowly than planned or if input costs rise. It also helps founders set minimum viable sales targets, define upside potential, and prepare more credible responses to investor or lender questions about risk, uncertainty, and downside protection.
Professional Charts
The professional charts section converts the financial model’s projections into visual reports that are easier to understand and present. Coffee roasting financial plans can include detailed numbers across revenue channels, margins, operating expenses, cash flow, and profit, but stakeholders often need a faster way to interpret the story behind the forecast. This component may include charts for revenue growth, EBITDA, net profit, cash balance, cost structure, margin trends, and other key measures. These visuals help users communicate how the roastery is expected to scale over time, where profitability improves, and how cash flow changes as sales increase. For business planning and funding documents, charts can make the forecast more persuasive because they show direction, timing, and performance trends without requiring readers to inspect every line of the spreadsheet. The section is also helpful for internal review, allowing owners and managers to identify patterns, compare assumptions, and explain financial performance in meetings, pitch discussions, or strategic planning sessions.
ROE Components and DuPont Analysis
The ROE components and DuPont analysis section helps users understand what drives return on equity in the coffee roasting business. Rather than treating ROE as a single isolated output, this component breaks the metric into underlying drivers such as profitability, asset efficiency, and financial leverage. For a coffee roastery, this can be useful because returns may depend on how efficiently the business uses roasting equipment, inventory, working capital, and invested funds to generate profit. Inputs may include projected net income, equity investment, asset balances, debt structure, and operating performance assumptions. The outputs help show whether returns are being driven mainly by strong margins, better use of assets, or financing structure. This is particularly useful for investors and stakeholders who want to understand the quality of projected returns, not just the headline number. It can also help business owners evaluate whether additional equipment, inventory, or expansion spending is likely to improve performance or dilute returns over time.
Revenue Inputs
The revenue inputs section is where users define the commercial assumptions that drive the Coffee Roasting Financial Model. This component is built around the specific revenue structure of a coffee roasting business, including direct-to-consumer sales, subscription plans, and wholesale distribution. Users can adjust assumptions such as product sizes, unit volumes, pricing, monthly sales ramp, customer growth, channel mix, and recurring subscription behavior. For example, the model can be customized for sales of 12-ounce retail bags, larger consumer bags, wholesale 5-pound or 10-pound bags, and recurring subscription orders. These inputs generate the revenue forecast and directly influence profitability, production needs, cash flow, and break-even analysis. The section is important because pricing and volume assumptions are often the foundation of a roastery’s business plan. By organizing revenue drivers in one structured place, users can test whether their sales goals are realistic, compare the impact of different channels, and understand how changes in customer demand affect the overall forecast.
Bank-Ready Reports
The bank-ready reports section organizes the model’s financial outputs into lender-friendly statements and summaries. When a coffee roasting business seeks financing for equipment, inventory, working capital, or expansion, banks and lenders typically want to review clear financial statements, repayment capacity, cash flow, and key assumptions. This component helps present projected financial performance in a structured format that can support loan discussions, funding applications, and stakeholder reviews. It may include forecasted profit and loss statements, cash flow projections, balance sheet summaries, operating metrics, and investment requirements. The outputs help users demonstrate how the business expects to generate revenue, manage expenses, maintain liquidity, and support debt obligations. For a roastery, this can be especially important because startup equipment such as commercial roasting machines, grinders, packaging tools, inventory, and facility setup can require meaningful upfront capital. Bank-ready reporting helps users move beyond a basic idea and present a more complete financial case to lenders, investors, advisors, or partners.
Revenue Breakdown
The revenue breakdown section provides a more detailed view of how total sales are built across the coffee roasting business. While the revenue inputs section defines the assumptions, this component helps users analyze the resulting revenue by stream, product type, bag size, and sales channel. It can show how much revenue comes from direct-to-consumer sales, wholesale accounts, and subscriptions, allowing users to understand which parts of the business contribute most to growth and margin. This is valuable because not all coffee revenue behaves the same way. Wholesale may provide larger volume but lower margins, direct-to-consumer sales may support stronger pricing, and subscriptions may improve predictability and customer lifetime value. By separating revenue streams, the model helps users assess concentration risk, channel profitability, and scaling strategy. It also supports decision-making around marketing spend, wholesale outreach, product packaging, subscription promotions, and production planning. For funding discussions, the breakdown makes the revenue story clearer and helps stakeholders understand the logic behind projected growth.
KPI Dashboard
The KPI dashboard tracks performance metrics and benchmarks that help users evaluate the health of the coffee roasting business. This component is designed to go beyond standard financial statements by highlighting key indicators such as revenue growth, gross margin, EBITDA, net profit margin, cash balance, return metrics, payback timing, and other operating measures. In a roastery, KPIs are useful because the business must manage both production economics and sales channel performance. Users can review whether margins are strong enough to support overhead, whether revenue is growing in line with expectations, and whether cash flow remains healthy as production scales. The dashboard can also help compare the forecast against industry benchmarks or internal targets, making it easier to spot areas that need attention. For example, a user may identify that packaging costs are too high, payroll is growing faster than sales, or wholesale growth is improving volume but compressing margin. This component supports ongoing decision-making, investor communication, and performance monitoring as the business develops.
Startup Cost Breakdown
The startup cost breakdown section helps users estimate the initial investment required to launch or expand a coffee roasting operation. A roastery can require several categories of upfront spending, including a commercial roasting machine, green coffee inventory, packaging and sealing equipment, facility setup, deposits, licensing, branding, website development, initial marketing, software, furniture, and working capital. This component organizes those costs so users can understand how much funding may be needed before operations begin generating stable revenue. Inputs can be customized based on the user’s location, production scale, equipment choices, supplier quotes, and launch strategy. The outputs help calculate total startup funding needs and show how those investments flow into the broader financial forecast. This section is useful for business planning because underestimating startup costs can create cash pressure early in the launch. It is also important for fundraising because investors and lenders want to see a clear use of funds. By itemizing startup costs, the model helps users build a more credible budget and avoid overlooking essential pre-opening expenses.
Break-Even Analysis
The break-even analysis section helps users identify when the coffee roasting business is expected to cover its costs and begin generating profit. This component connects revenue assumptions, cost of goods sold, payroll, fixed operating expenses, variable costs, and gross margin to estimate the point at which the business moves from loss-making to profitable. For a coffee roastery, break-even depends on sales volume, pricing, channel mix, green coffee costs, packaging, fulfillment labor, rent, utilities, marketing, and staffing. Users can adjust these assumptions to test how changes in pricing, production volume, wholesale contracts, subscription growth, or cost control affect the break-even timeline. The output is useful because it gives founders and stakeholders a concrete target to manage toward. It can also show whether the business needs more startup capital to survive the ramp-up period or whether the planned sales strategy is sufficient to support fixed costs. For decision-making, break-even analysis helps users understand the minimum performance required, evaluate launch risk, and build a more realistic path to sustainable profitability.
File types:
Excel – Single-User: .xlsx
Excel – Multi-User: .xlsx
Similar ProductsOther customers were also interested in...


 HenrySheykin
Clothing Manufacturing Business Plan Financial Mod...
The Clothing Manufacturing Financial Model helps users turn a garment production concept into a stru... Read more
Diaper Manufacturing Business Plan Financial Model...
The Diaper Manufacturing Financial Model helps users turn a disposable diaper factory concept into a... Read more
Juice Production Business Plan Financial Model Exc...
The Fruit Juice Concentrate Production Financial Model helps users turn a capital-intensive beverage... Read more

 Excel Business Resou...
CBD Personal Care Financial Model and Valuation Te...
CBD Personal Care Financial Model and Valuation Template, a comprehensive solution tailored for entr... Read more
Grocery Store Financial Model Excel Template
The Grocery Store Financial Model helps entrepreneurs, founders, consultants, analysts, and retail b... Read more
Solar Panel Manufacturing Plant Business Plan Fina...
The Solar Panel Manufacturing Financial Model helps users turn a solar factory concept into a struct... Read more
Bakery Financial Model Excel Template
The Bakery Financial Model helps entrepreneurs, bakery owners, consultants, analysts, and business p... Read more
Clothing Store Financial Model Excel Template
The Clothing Store Financial Model helps turn a retail apparel concept into a structured financial f... Read more
Candy Store Financial Model Excel Template
The Candy Store Financial Model helps entrepreneurs and planners turn a retail confectionery concept... Read more
Food Production Financial Model Excel Template
The Food Manufacturing Financial Model helps entrepreneurs, founders, consultants, analysts, and bus... Read more
You must log in to submit a review.