
0 ITEMS

Juice Production Business Plan Financial Model Excel Template
The Fruit Juice Concentrate Production Financial Model helps users turn a capital-intensive beverage manufacturing idea into a structured, investor-ready forecast. Instead of relying on rough estimates, entrepreneurs, founders, business owners, consultants, and analysts can use this template to organize the major assumptions behind a fruit concentrate facility, including production volume, product pricing, raw material costs, operating expenses, payroll, startup investment, financing needs, cash flow, and profitability. It is designed for users preparing a business plan, loan application, investor presentation, feasibility study, or internal expansion plan. This financial model template is especially useful for planning a production business where revenue depends on multiple concentrate product lines and cost control depends on raw fruit inputs, direct labor, packaging, processing materials, plant overhead, and equipment utilization. Users can adjust revenue assumptions for apple, berry, citrus, grape, peach, or other concentrate lines, then see how those changes affect gross margin, EBITDA, net income, cash position, and long-term financial performance. The model also supports practical decision-making by linking sales growth, production costs, staffing, and capital expenditure into one connected planning framework. The template helps users estimate startup costs and ongoing operating expenses with more clarity before committing capital. It can be used to evaluate facility lease costs, equipment purchases, quality control requirements, administrative overhead, sales commissions, software costs, insurance, professional services, and payroll needs. By separating fixed costs from variable costs, the model gives a clearer view of how much revenue is required to support operations and how quickly the business may reach break-even. This is valuable for founders who need to understand funding requirements, working capital pressure, and the financial impact of scaling production over time. Built for financial planning and stakeholder communication, the Fruit Juice Concentrate Production Financial Model includes a clean structure for reviewing scenarios, cash flow, profitability, KPIs, revenue detail, and financial reports. It is fully editable, compatible with Microsoft Excel and Google Sheets, and ready to customize for a specific market, currency, production strategy, or funding plan. Whether the goal is to launch a new juice concentrate plant, expand an existing processing operation, compare assumptions, or prepare a lender-friendly financial package, this template provides a practical foundation for faster, more confident financial decision-making.


Financial Model Overview
The Fruit Juice Concentrate Production Financial Model is a ready-to-use financial model template built for planning, evaluating, and presenting the economics of a fruit juice concentrate manufacturing business. It gives entrepreneurs, operators, consultants, analysts, and funding teams a structured way to forecast revenue, production costs, operating expenses, payroll, capital investment, cash flow, profitability, and financial feasibility over a multi-year planning period. A juice concentrate facility can require significant upfront spending on extraction systems, evaporators, storage tanks, packaging equipment, quality control assets, staffing, raw materials, and working capital, so a clear financial model is essential before launching, expanding, or approaching investors. This template helps users replace guesswork with a connected planning tool where inputs flow into outputs, assumptions can be adjusted, and the financial impact of each decision can be reviewed. It is designed to support business planning, investor discussions, lender submissions, internal budgeting, and operational decision-making for a fruit concentrate production company.
All-in-One Dashboard
The all-in-one dashboard brings the core inputs and core outputs of the Fruit Juice Concentrate Production Financial Model into one central view, making it easier to understand the overall financial story without searching through every worksheet. This section is designed to summarize the most important assumptions and results, such as production volume, revenue, gross margin, operating expenses, EBITDA, net income, cash balance, funding requirement, and payback indicators. Users can update key assumptions related to pricing, sales quantities, cost of goods sold, payroll, facility overhead, capital expenditure, and financing, then review how those changes affect the main financial outputs. For a fruit juice concentrate production business, this is especially useful because management needs to monitor both manufacturing economics and cash requirements at the same time. The dashboard helps founders and advisors quickly see whether the business model is generating enough revenue to cover raw materials, direct production labor, packaging, processing costs, administrative overhead, and equipment investment. It also supports investor and lender conversations by presenting a clear summary of the business case in a format that is easier to interpret than a full spreadsheet workbook. By connecting operational assumptions with financial outcomes, the all-in-one dashboard becomes a practical control center for business planning, funding preparation, and strategic decision-making.
Low Base High Scenario Analysis
The low, base, and high scenario analysis section gives users a structured way to test different outcomes for the fruit juice concentrate production business. Instead of relying on one static forecast, the model allows users to compare conservative, expected, and optimistic cases based on changes in key drivers such as sales volume, product pricing, raw fruit costs, direct labor, variable expenses, overhead levels, and growth rates. This is important in fruit concentrate manufacturing because profitability can change significantly if production volumes ramp up slower than expected, if fruit prices rise, if customer demand varies by product line, or if the plant takes longer to reach efficient utilization. The low case can help users understand downside risk and minimum funding needs, while the base case can represent the most realistic operating plan, and the high case can show the potential upside if production and sales targets are exceeded. The outputs may include revenue, gross profit, EBITDA, net profit, cash flow, and return metrics under each scenario, helping users see how sensitive the business is to commercial and cost assumptions. For entrepreneurs preparing a business plan or funding package, this section is valuable because investors and lenders often want to understand not only the expected result, but also what happens if market conditions are less favorable. The scenario analysis improves decision-making by helping users prepare contingency plans, evaluate risk, and communicate a more balanced financial outlook.
Professional Charts
The professional charts section translates the financial model into presentation-ready visuals that help users communicate trends, performance, and business potential more clearly. A fruit juice concentrate production forecast can include many detailed calculations across revenue streams, cost categories, payroll, capital expenditure, working capital, profit and loss, balance sheet, and cash flow, but decision-makers often need a faster way to understand the direction of the business. This component may include visual summaries of revenue growth, expense trends, gross margin, EBITDA, net income, cash balance, funding requirements, and other key financial metrics over the forecast period. Charts are useful because they make patterns easier to identify, such as when revenue begins to scale, when margins improve from operating leverage, when cash flow turns positive, or when capital spending creates temporary liquidity pressure. For a beverage manufacturing business, visual reporting can also help compare product line performance and highlight how production growth affects profitability. These charts can be used in investor decks, loan packages, board discussions, management meetings, and internal planning documents. Because the template is editable, users can adjust assumptions and refresh the visuals to reflect their own plant capacity, pricing strategy, product mix, cost structure, and growth plan. This section helps turn a complex financial forecast into a more accessible story for stakeholders who need clarity before making funding or operational decisions.
ROE Components and DuPont Analysis
The ROE components and DuPont analysis section helps users evaluate the drivers behind return on equity rather than looking only at final profit figures. In a fruit juice concentrate production business, equity returns are influenced by margin performance, asset utilization, and the way the company is financed, especially because the business may require expensive equipment, facility setup, working capital, and inventory investment before it can operate at scale. This component breaks return on equity into underlying elements, allowing users to see whether projected returns are being driven by strong profitability, efficient use of assets, leverage, or a combination of factors. Inputs may include net income, revenue, total assets, equity investment, debt assumptions, retained earnings, and balance sheet values, while outputs may include profit margin, asset turnover, equity multiplier, and overall return on equity. The value of this section is that it helps users understand the quality and sustainability of returns. A high projected ROE may look attractive, but DuPont analysis can show whether it depends on aggressive leverage, unusually high margins, or rapid asset turnover that may require operational discipline. This is useful for investors, lenders, founders, and financial analysts who want to evaluate the business from a more advanced performance perspective. It also supports decision-making around funding structure, capital allocation, production expansion, and long-term growth planning by showing how operational and financing choices affect shareholder returns.
Revenue Inputs
The revenue inputs section is where users define the commercial assumptions that drive the top line of the Fruit Juice Concentrate Production Financial Model. For a concentrate manufacturing operation, revenue is typically built from units produced and sold across multiple product lines, selling prices, launch timing, annual growth rates, customer demand, and production capacity. The model can support distinct concentrate categories such as apple concentrate, berry concentrate, citrus concentrate, grape concentrate, peach concentrate, or other product lines that the user wants to include. Each revenue stream can be adjusted for unit volume and price, giving users a transparent way to calculate total sales instead of using a single broad revenue estimate. This is valuable because different concentrates may have different pricing, raw material requirements, customer demand, production yields, and margin profiles. By using structured revenue inputs, users can test how changes in product mix affect total revenue and profitability. For example, increasing a higher-margin concentrate line may improve EBITDA even if total units remain similar, while a lower-priced product may require higher volume to support fixed manufacturing overhead. This section also helps users prepare assumptions that can be explained clearly to investors, lenders, or internal stakeholders. Instead of presenting unsupported revenue targets, the model connects sales projections to measurable drivers, making the forecast more credible and easier to revise as market research, customer contracts, or production plans develop.
Bank-Ready Reports
The bank-ready reports section provides lender-friendly financial outputs that help users present the fruit juice concentrate production business in a professional and structured format. Banks and financing partners typically want to see clear financial statements, cash flow forecasts, debt service capacity, startup funding needs, profitability, and assumptions that explain how the business will generate enough cash to operate and repay financing. This component organizes the model’s results into formal reports that may include projected profit and loss statements, cash flow statements, balance sheets, financing summaries, and key metrics over the forecast period. For a juice concentrate facility, these reports are especially important because the business may need loans or equipment financing to fund extraction systems, evaporators, storage tanks, packaging lines, laboratory equipment, leasehold improvements, and working capital. The reports help users show how capital investment supports production capacity, how sales convert into cash, how operating expenses are managed, and how debt or equity funding affects the financial position. They also improve credibility by presenting financial information in a clean, consistent, and organized manner that lenders can review efficiently. Users can customize the assumptions to match their own financing structure, repayment terms, interest rates, cash reserves, and launch schedule. This section is useful for entrepreneurs applying for loans, consultants preparing funding documents, and business owners who need to communicate financial feasibility to banks, credit committees, grant providers, or other capital sources.
Revenue Breakdown
The revenue breakdown section gives users a detailed view of how total sales are generated across the different revenue streams in the fruit juice concentrate production business. While the revenue inputs define the assumptions, the revenue breakdown helps interpret the results by showing the contribution of each product line to total revenue over time. This may include apple concentrate, berry concentrate, citrus concentrate, grape concentrate, peach concentrate, or any customized product categories entered by the user. The section can show which product lines are expected to generate the largest sales, how revenue mix changes as production scales, and how pricing and volume assumptions affect the overall forecast. This is useful for planning because a manufacturing business rarely performs evenly across all products. Some concentrates may have stronger demand, higher selling prices, better margins, or more stable supply chains, while others may require more careful cost management or marketing support. By reviewing the revenue breakdown, users can identify which product lines deserve more production capacity, sales focus, or procurement attention. It can also help founders explain the business model to stakeholders by showing that revenue is not just one number, but a portfolio of concentrate products with specific assumptions behind each stream. For financial planning, this component supports product mix decisions, customer targeting, capacity planning, and profitability analysis. It also helps users test whether the company is too dependent on a single product line or whether revenue is diversified enough to support long-term growth.
KPI Dashboard
The KPI dashboard focuses on the performance metrics that help users evaluate whether the fruit juice concentrate production business is operating according to plan. Key performance indicators may include revenue growth, gross margin, EBITDA margin, net profit margin, operating expense ratio, cash balance, return on equity, payback period, break-even timing, and other benchmarks relevant to food processing and beverage manufacturing. This section is useful because it converts detailed financial calculations into a set of measurable indicators that can be reviewed regularly by owners, managers, investors, and advisors. For a production business, KPIs help users monitor both commercial progress and operational efficiency. Strong revenue growth may not be enough if raw material costs are rising, gross margin is falling, or cash is being consumed by inventory and equipment needs. Similarly, a profitable forecast may still require attention if the business has a low cash buffer during the production ramp-up. The KPI dashboard can also be used to compare projected performance against industry benchmarks, internal targets, or updated actual results as the business develops. By making financial performance easier to track, this section supports better decision-making around pricing, procurement, staffing, capacity utilization, cost control, and financing. It is particularly helpful for stakeholder reporting because it gives a concise view of business health without requiring every reader to analyze the full model in detail. For business planning and funding preparation, the KPI dashboard helps demonstrate that the forecast is being managed with clear financial discipline.
Startup Costs and Capital Expenditure Planning
The startup costs and capital expenditure planning section helps users estimate the upfront investment required to launch or expand a fruit juice concentrate production facility. This business idea often involves significant initial spending before revenue begins, including juice extraction systems, concentration evaporators, storage tanks and silos, packaging and filling lines, quality control laboratory equipment, installation costs, facility preparation, licenses, deposits, initial marketing, technology, and working capital reserves. This component allows users to organize these costs by category, timing, and amount so they can calculate the total funding needed before operations begin.
File types:
Excel – Single-User: .xlsx
Excel – Multi-User: .xlsx
Similar ProductsOther customers were also interested in...


 HenrySheykin
Micro Distillery Business Plan Financial Model Exc...
The Micro-Distillery Financial Model helps founders, operators, consultants, analysts, and business ... Read more
Diaper Manufacturing Business Plan Financial Model...
The Diaper Manufacturing Financial Model helps users turn a disposable diaper factory concept into a... Read more
Coffee Roasting Business Plan Financial Model Exce...
The Coffee Roasting Financial Model helps entrepreneurs, founders, business owners, consultants, and... Read more
Clothing Manufacturing Business Plan Financial Mod...
The Clothing Manufacturing Financial Model helps users turn a garment production concept into a stru... Read more
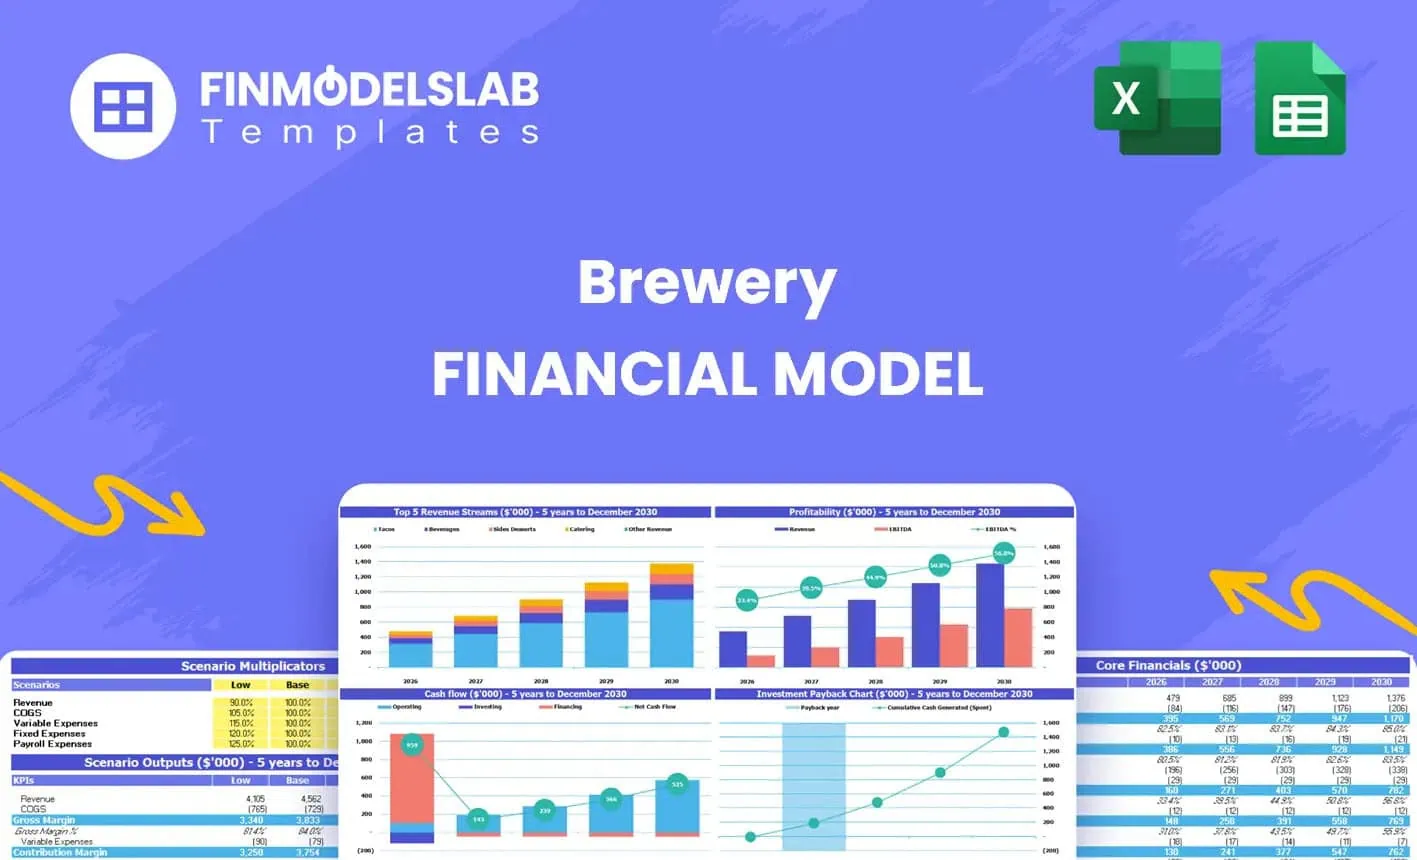
Brewery Business Plan Financial Model Excel Templa...
The Brewery Financial Model helps founders, brewery operators, consultants, and analysts turn a brew... Read more
 David
Manufacturing Startup/Existing Business Financial ...
3 statement 5 year rolling financial projection Excel model for a startup /existing manufacturing bu... Read more

 eFinancialModels
Liquor Distillery Financial Plan Template
Distilleries, with their rich history of crafting spirits, have experienced a resurgence in populari... Read more

 Giorgos
Mini Grocery Store Financial Model – Dynamic...
Financial Model providing a dynamic up to 10-year financial forecast for a startup or existing Mini ... Read more

Microbrewery – 10 Year Financial Model
Financial Model providing a dynamic up to 10-year financial forecast for a startup or existing Micro... Read more
Fruit Processing Facility – 10 Year Financia...
Financial Model providing a dynamic up to 10-year financial forecast for a startup Fruit Processing ... Read more
You must log in to submit a review.