
0 ITEMS

Micro Distillery Business Plan Financial Model Excel Template
The Micro-Distillery Financial Model helps founders, operators, consultants, analysts, and business plan writers turn a craft spirits concept into a structured financial forecast. Instead of relying on a generic spreadsheet, this financial model template is built around the economics of a small distillery, including production volumes, spirit pricing, tasting room activity, startup equipment, operating expenses, COGS, cash flow, and profitability. It gives users a practical way to evaluate whether a micro-distillery can support its cost structure, reach break-even, and generate sustainable returns over time. Designed for financial planning, funding preparation, and internal decision-making, the template helps users organize the assumptions that matter most for a distillery business. Users can model revenue assumptions for multiple product lines such as gin, vodka, whiskey, liqueurs, and tasting room tours, then connect those sales drivers to direct costs, payroll, fixed expenses, capital investment, and monthly cash flow. This makes it easier to understand how pricing, production volume, distribution mix, staffing levels, and operating costs influence profit margins and cash needs. The Micro-Distillery Financial Model is useful for entrepreneurs launching a new craft distillery, established owners planning expansion, consultants preparing client deliverables, and analysts building investment or lending cases. It supports business planning by showing how startup costs, equipment purchases, working capital, and operating expenses flow through the financial statements. It also helps users assess profitability, funding requirements, break-even timing, and performance under different scenarios before committing capital or presenting to stakeholders. With editable assumptions, pre-built formulas, visual dashboards, investor-ready reports, and five-year projections, the template saves time compared with building a model from scratch. It is structured to help non-financial users work through the key questions investors, lenders, and partners are likely to ask, while still giving experienced users enough flexibility to customize the forecast. Whether used for a distillery business plan, bank loan package, investor presentation, or management planning process, it provides a clear framework for testing ideas, reviewing outcomes, and making better financial decisions.
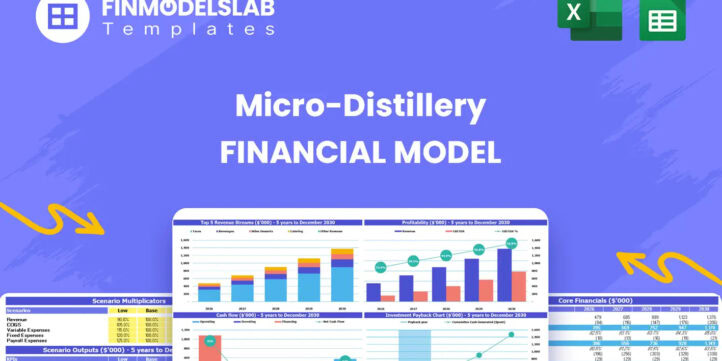


Financial Model Overview
The Micro-Distillery Financial Model is a ready-to-use financial model template designed specifically for the economics of a small craft distillery. It helps users forecast revenue, startup investment, operating costs, cash flow, profitability, investor returns, and business performance over a multi-year planning period. Unlike a generic spreadsheet, this model is structured around the way a distillery actually operates, including production batches, spirit sales, tasting room income, cost of goods sold, payroll, equipment purchases, barrel aging considerations, and working capital needs. Entrepreneurs can use it to evaluate a new launch, owners can use it to plan growth, consultants can use it to prepare client forecasts, and analysts can use it to support funding documents or investment reviews. The template is editable, presentation-ready, and built to connect the assumptions behind the business with the outputs that matter to lenders, investors, partners, and management teams.
All-in-One Dashboard
The all-in-one dashboard gives users a central view of the model’s most important inputs and outputs, making it easier to understand the financial story of the micro-distillery without searching through every worksheet. This section is useful for reviewing assumptions such as sales volume, average pricing, cost structure, payroll, startup investment, operating expenses, funding, and cash reserves, then seeing the resulting revenue, EBITDA, profit, cash balance, and return metrics in one place. For a distillery business, this is especially valuable because many financial drivers are connected, including production capacity, bottle sales, tasting room traffic, distribution mix, raw material costs, and equipment spending. The dashboard helps users quickly test whether the plan is financially realistic, whether the business can support its expense base, and whether projected margins are strong enough to justify the startup investment. It also provides a clean summary that can be shared with partners, lenders, investors, or internal teams during planning conversations.
Low, Base, and High Scenario Analysis
The low, base, and high scenario analysis section helps users plan for uncertainty by comparing how the micro-distillery may perform under different operating conditions. Instead of relying on a single forecast, users can test conservative, expected, and optimistic cases by adjusting assumptions such as production volume, bottle pricing, tasting room attendance, raw material costs, payroll levels, marketing spend, and operating expenses. The model then shows how those changes affect revenue, gross margin, EBITDA, cash flow, profitability, and funding needs. This is useful because a craft distillery can be affected by demand shifts, seasonality, distribution delays, aging inventory, supplier pricing, licensing timelines, and changes in direct-to-consumer sales. Scenario analysis helps founders and managers stress-test the plan before committing capital, prepare contingency plans, understand downside risk, and communicate a more credible range of outcomes to lenders or investors. It also supports better decision-making by showing which assumptions have the greatest impact on performance.
Professional Charts
The professional charts section turns the financial forecast into visual outputs that are easier to interpret and present. It may include charts for revenue growth, profitability, cash balance, operating expenses, EBITDA, gross margin, revenue mix, and other key performance trends over the forecast period. For a micro-distillery, visual reporting helps users explain how different revenue streams develop over time, how startup costs transition into operating activity, how cash flow improves as sales increase, and how margins evolve as the business scales. These charts are useful for investor decks, bank loan discussions, management meetings, and business plan presentations because they simplify complex financial data into clear trends. Rather than presenting only spreadsheet rows, the model allows users to show the financial path of the distillery in a more professional and stakeholder-friendly format. This can help build confidence in the forecast and make it easier for decision-makers to understand the opportunity, risks, and funding requirements.
ROE Components and DuPont Analysis
The ROE components and DuPont analysis section helps users understand what is driving return on equity rather than only viewing the final return figure. This component typically breaks return performance into underlying factors such as profit margin, asset turnover, and financial leverage, allowing users to see whether returns are being driven by operating profitability, efficient use of assets, or capital structure. For a micro-distillery, this is useful because the business often requires meaningful upfront investment in equipment, production assets, build-out, inventory, and working capital. A simple profit number may not fully explain whether the business is using its capital efficiently. By analyzing ROE components, users can evaluate whether higher margins, stronger sales productivity, better asset utilization, or different financing choices could improve overall returns. This section is particularly helpful for investors and owners who want to understand how the business converts capital investment into financial performance and whether the forecast supports an attractive long-term return profile.
Revenue Inputs
The revenue inputs section is where users define the core sales assumptions behind the Micro-Distillery Financial Model. It allows users to estimate sales by product line, production volume, unit pricing, and revenue stream, which may include artisanal gin, craft potato vodka, single malt whiskey, botanical liqueur, and on-site tasting room tours. These assumptions form the foundation of the entire forecast because they determine the sales that flow into profitability, cash flow, and valuation outputs. Users can adjust expected units sold, average selling prices, growth rates, launch timing, and channel mix to reflect their own distillery concept, market positioning, and go-to-market strategy. This is especially important for craft spirits because direct-to-consumer sales, wholesale distribution, tasting room traffic, seasonal releases, and premium products can have very different margins and cash flow profiles. A well-structured revenue input section helps users move from broad market ideas to measurable sales drivers, making the financial plan more credible and easier to defend.
Bank-Ready Reports
The bank-ready reports section organizes the model’s outputs into a format suitable for lenders, financing partners, and other stakeholders who need clear financial documentation. This component may include projected profit and loss statements, cash flow statements, balance sheets, debt service assumptions, funding requirements, capital expenditures, and summary metrics that support loan discussions or credit analysis. For a micro-distillery, this is important because lenders typically want to understand startup capital needs, equipment purchases, repayment capacity, projected profitability, operating cash flow, and the assumptions behind the forecast. The reports help users present the business in a structured and professional way rather than relying on disconnected estimates or informal budgets. They also make it easier to explain how funding will be used, how the business expects to generate cash, and whether the forecast can support ongoing obligations. This section is useful for bank loan applications, SBA-style financing preparation, investor discussions, and internal financial planning.
Revenue Breakdown
The revenue breakdown section gives users a detailed view of how total sales are built across the distillery’s different revenue streams. Instead of showing only one top-line revenue number, it separates income by product category, sales channel, or business activity, helping users understand which parts of the business contribute most to growth and margin. For a micro-distillery, this can include bottled spirit sales, tasting room tours, premium releases, limited batches, wholesale accounts, direct-to-consumer activity, and other revenue sources. The section may use assumptions such as units sold, average price, product mix, annual growth, and channel contribution to generate a clearer view of the business model. This is useful because a distillery’s profitability can vary significantly depending on whether revenue comes from high-margin tasting room sales or lower-margin distribution channels. A detailed revenue breakdown helps users identify the most valuable sales streams, prioritize marketing and production decisions, and explain the commercial strategy to investors or lenders.
KPI Dashboard
The KPI dashboard tracks the performance metrics that help users evaluate whether the micro-distillery is operating in line with the plan. This section may include revenue growth, gross margin, EBITDA margin, net profit margin, cash balance, burn rate, return on equity, internal rate of return, payback period, liquidity ratios, and other financial indicators. For a craft distillery, KPIs are important because the business combines manufacturing, hospitality, inventory management, and brand-building economics. The dashboard helps users monitor whether sales are scaling efficiently, whether COGS is under control, whether cash remains adequate, and whether profitability is improving as the business grows. It can also include benchmark-style comparisons so users can assess whether their assumptions are realistic relative to industry expectations. This component is valuable for management reviews, board updates, investor presentations, and ongoing planning because it turns the financial forecast into a practical performance management tool.
Startup Costs and CapEx Planning
The startup costs and CapEx planning section helps users estimate the upfront investment required to launch or expand a micro-distillery. This component may include equipment such as stills, fermentation tanks, bottling and labeling systems, barrel storage, tasting room build-out, production fixtures, leasehold improvements, licenses, deposits, initial marketing, technology, working capital, and other pre-opening expenses. These inputs help generate a clear picture of how much funding may be needed before the distillery can begin generating meaningful revenue. For a distillery business, this section is especially important because equipment and facility costs can be significant, and underestimating them can create early cash pressure. By separating one-time capital expenditures from recurring operating expenses, the model helps users build a more accurate funding plan and understand how startup spending affects depreciation, cash flow, and balance sheet projections. This component supports budgeting, financing discussions, investor planning, and launch readiness by showing exactly where the initial capital is expected to go.
Break-Even Analysis
The break-even analysis section helps users estimate when the micro-distillery’s revenue will be sufficient to cover its costs and begin generating profit. It connects revenue assumptions, gross margin, fixed operating expenses, payroll, COGS, and startup cost structure to determine the sales level or time period required to reach break-even. This is one of the most important planning outputs for a new distillery because it shows how quickly the business may move from launch investment to financial sustainability. Users can test how changes in pricing, product mix, production volume, tasting room sales, direct-to-consumer revenue, and operating expenses affect the break-even point. The section is useful for deciding how aggressively to scale production, how much cash reserve is needed, and whether the business model can support expected overhead. It also provides a clear answer to a common investor and lender question by showing when the business is projected to stop relying on startup capital and begin supporting itself through operations.
File types:
Excel – Single-User: .xlsx
Excel – Multi-User: .xlsx
Similar ProductsOther customers were also interested in...


 eFinancialModels
Liquor Distillery Financial Plan Template
Distilleries, with their rich history of crafting spirits, have experienced a resurgence in populari... Read more
 HenrySheykin
Brewery Business Plan Financial Model Excel Templa...
The Brewery Financial Model helps founders, brewery operators, consultants, and analysts turn a brew... Read more
Juice Production Business Plan Financial Model Exc...
The Fruit Juice Concentrate Production Financial Model helps users turn a capital-intensive beverage... Read more

 David
Manufacturing Startup/Existing Business Financial ...
3 statement 5 year rolling financial projection Excel model for a startup /existing manufacturing bu... Read more
 Giorgos
Fruit Processing Facility – 10 Year Financia...
Financial Model providing a dynamic up to 10-year financial forecast for a startup Fruit Processing ... Read more

Microbrewery – 10 Year Financial Model
Financial Model providing a dynamic up to 10-year financial forecast for a startup or existing Micro... Read more

 Jair
Brewery Financial Model and Budget Control
This Excel model is an advanced, user-friendly financial planning tool designed explicitly for start... Read more
Manufacturing Financial Model Templates Bundle
This is a collection of financial model templates in Excel for businesses in the Manufacturing indus... Read more
Solar Panel Manufacturing Plant Business Plan Fina...
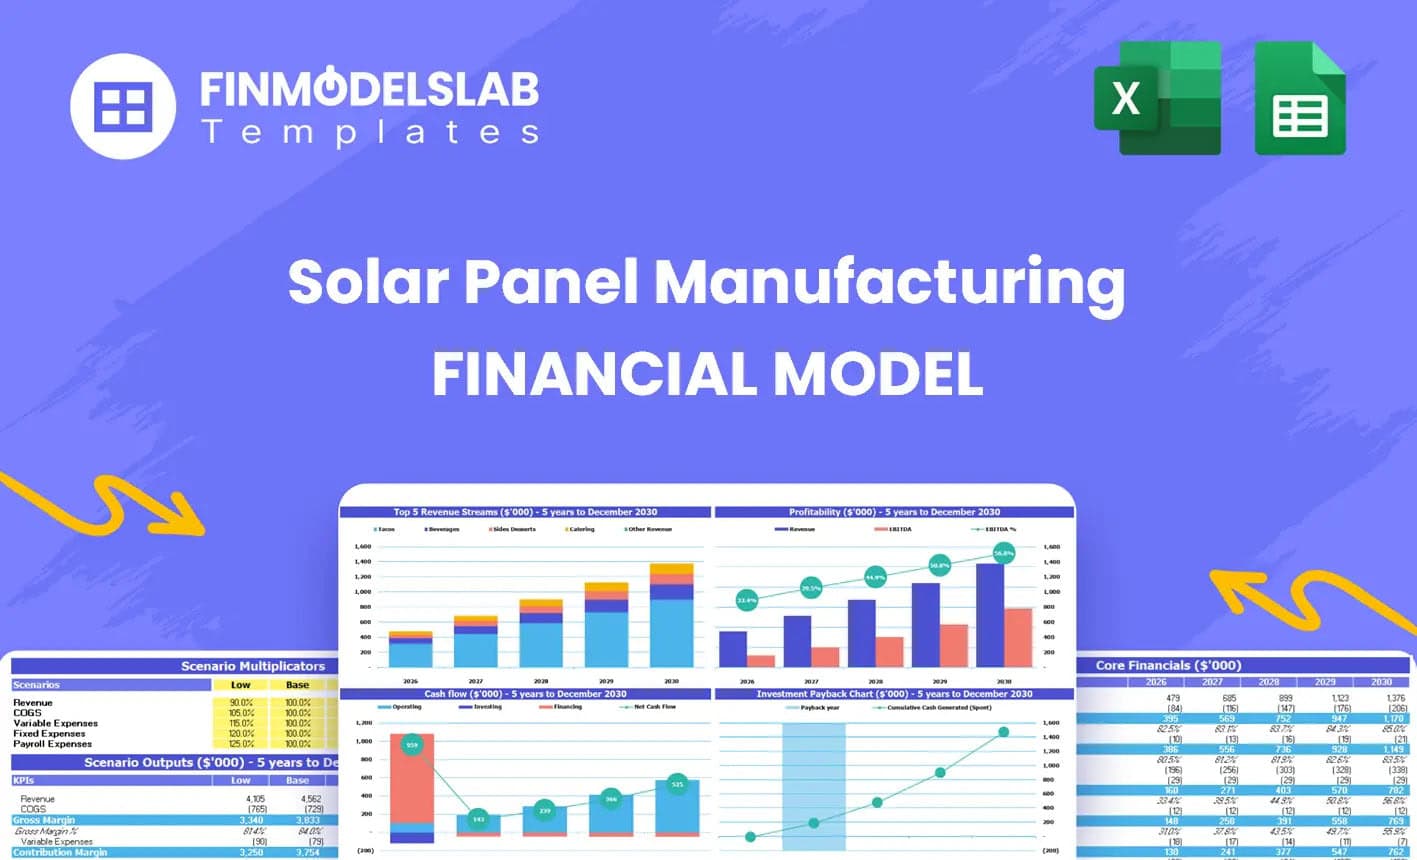
The Solar Panel Manufacturing Financial Model helps users turn a solar factory concept into a struct... Read more
Clothing Manufacturing Business Plan Financial Mod...
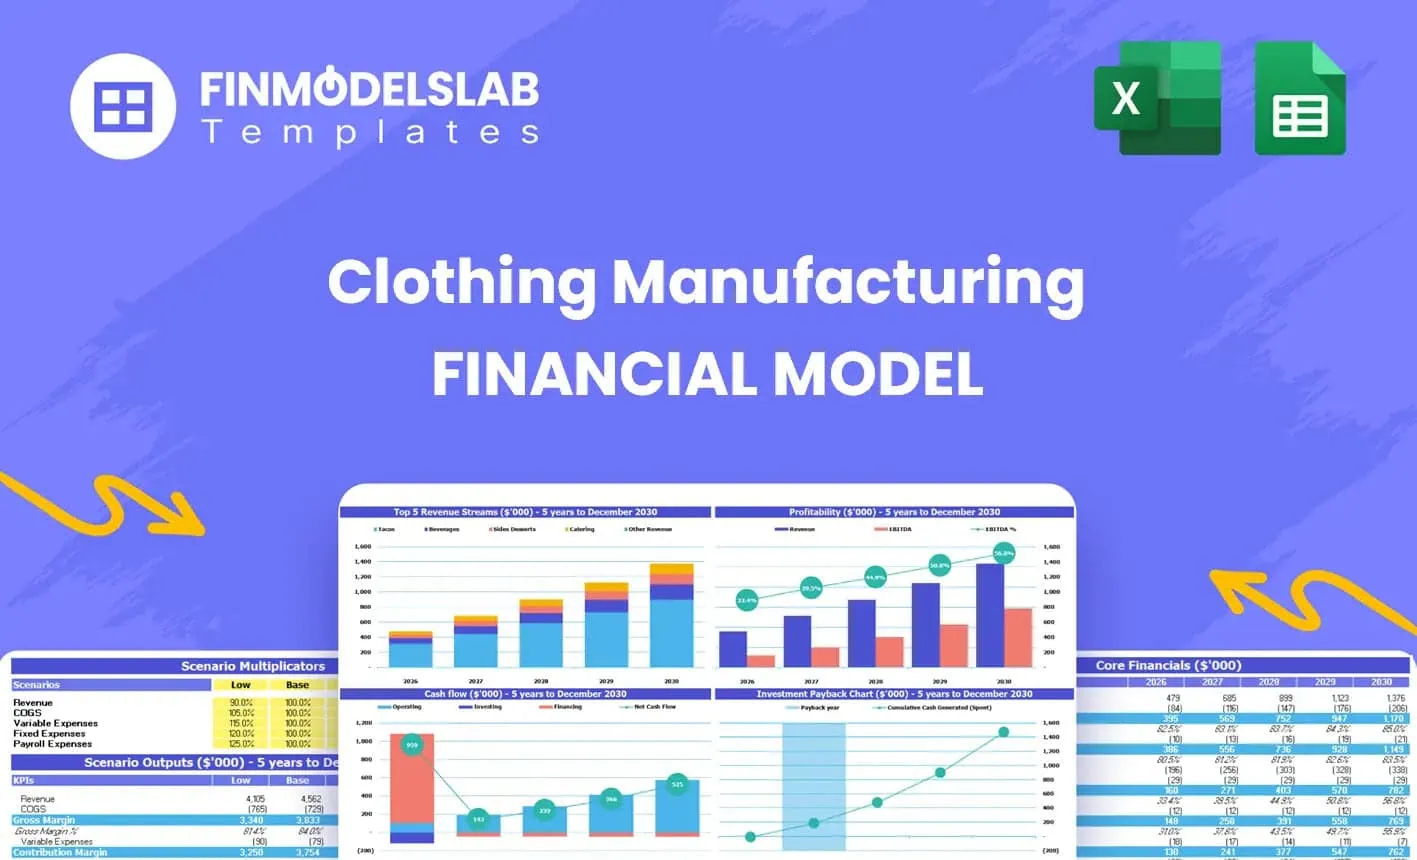
The Clothing Manufacturing Financial Model helps users turn a garment production concept into a stru... Read more
You must log in to submit a review.