
0 ITEMS

House Cleaning Subscription Financial Model Excel Template
The Cleaning Service Financial Model helps entrepreneurs, founders, consultants, analysts, and business owners turn a cleaning business idea into a structured financial forecast. Instead of starting from a blank spreadsheet, users can work from a ready-to-use financial model template designed around the economics of residential cleaning, commercial cleaning, recurring subscriptions, one-time deep cleans, staffing needs, marketing spend, and operating costs. It gives buyers a practical way to estimate startup costs, revenue assumptions, payroll, expenses, profitability, cash flow, and funding needs before launching, expanding, or presenting the business to stakeholders. This template is built for business planning, funding preparation, internal budgeting, and strategic decision-making. Users can customize key assumptions such as monthly residential subscription pricing, commercial contract values, customer acquisition cost, marketing budget, service mix, staffing levels, supply costs, equipment needs, and payment timing. The model connects those assumptions to projected revenue, cost structure, cash flow movement, profit and loss performance, and longer-term growth expectations, helping users understand whether the cleaning service can scale sustainably. For new cleaning service startups, the model helps clarify how much capital may be required before the business becomes self-sustaining. For existing cleaning companies, it can support expansion planning, hiring decisions, pricing updates, new service line evaluation, or investor and lender discussions. The model is also useful for consultants and advisors preparing financial planning documents, business plans, pitch materials, loan packages, or feasibility studies for clients in the cleaning services sector. The Cleaning Service Financial Model is fully editable and designed to save time while still allowing detailed customization. Users can review revenue potential, startup investment, operating expenses, payroll requirements, cash flow dynamics, profitability, break-even analysis, investor returns, scenario outcomes, and performance metrics in one organized file. With pre-built formulas, professional formatting, visual outputs, and compatibility with Excel and Google Sheets, the template helps users make clearer decisions, communicate financial expectations more confidently, and plan a cleaning service business with greater discipline.


Financial Model Overview
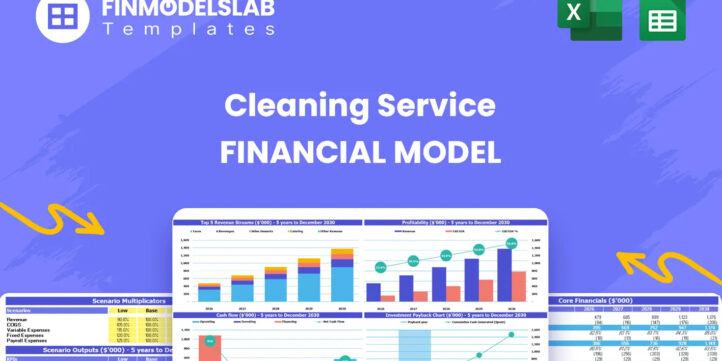
The Cleaning Service Financial Model is a ready-to-use financial model template designed to help entrepreneurs, business owners, consultants, analysts, and founders plan the financial performance of a residential and commercial cleaning business. A cleaning service can look simple from the outside, but the financial drivers can become complex quickly once customer acquisition, recurring subscriptions, one-time deep cleans, commercial contracts, staffing, travel time, supplies, equipment, payroll, marketing, and cash flow timing are considered together. This template organizes those drivers into a structured planning tool so users can forecast revenue, estimate startup costs, project operating expenses, evaluate profitability, assess funding needs, and prepare lender or investor-ready outputs. It is useful for launching a new cleaning company, expanding an existing operation, preparing a business plan, testing a pricing strategy, reviewing growth scenarios, or building financial projections for funding discussions. Because the model is editable, users can replace default assumptions with their own local pricing, staffing structure, service mix, marketing plan, and expense expectations while relying on pre-built formulas and organized outputs to speed up the planning process.
All-in-One Dashboard
The all-in-one dashboard gives users a central view of the most important inputs and outputs in the Cleaning Service Financial Model. Instead of searching across multiple tabs to understand how the business is performing, users can review core assumptions and high-level forecast results in one place. This component may include key inputs such as customer growth assumptions, service pricing, marketing spend, customer acquisition cost, staffing levels, cost assumptions, and funding requirements, then connect those inputs to outputs such as revenue, EBITDA, net income, cash balance, payback timing, and profitability metrics. For a cleaning service, this is especially useful because many decisions are connected: a change in marketing spend affects customer volume, which affects cleaner staffing, supplies, payroll, revenue, and cash requirements. The dashboard helps users see those relationships quickly and make better decisions about launch timing, service capacity, hiring plans, pricing changes, and growth strategy. It also gives founders and managers a practical overview they can use in planning meetings, investor conversations, and internal reviews without needing to interpret every detailed schedule separately.
Low, Base, and High Scenario Analysis
The Low, Base, and High scenario analysis component helps users test how different operating conditions could affect the cleaning service forecast. A single forecast is rarely enough for a service business because actual results may vary depending on customer acquisition, retention, pricing, labor availability, route efficiency, supply costs, and demand from residential or commercial clients. This section allows users to compare conservative, expected, and optimistic cases by adjusting key assumptions such as monthly subscription prices, commercial contract values, number of new customers, customer acquisition cost, marketing spend, churn, payroll levels, or operating expense growth. The outputs help show how revenue, profitability, cash flow, funding needs, and return metrics may change under each scenario. For planning and funding, this is valuable because it makes the model more realistic and resilient. A founder can use the low case to prepare for slower growth or higher costs, the base case to define the main operating plan, and the high case to understand upside potential if marketing performs well or commercial contracts scale faster than expected. This makes the financial plan more useful for decision-making because it shows not only what the business hopes will happen, but also what could happen if conditions improve or deteriorate.
Professional Charts
The professional charts component translates the financial forecast into visual outputs that are easier to understand and present. Cleaning service projections often include many moving parts, including revenue by service type, customer growth, payroll, expenses, EBITDA, cash balance, break-even timing, and return metrics. Charts help convert those calculations into visual trends that can be reviewed quickly by business owners, advisors, lenders, investors, and team members. This section may display revenue growth over time, expense trends, profitability improvement, cash flow movement, customer acquisition trends, service mix, margin progression, or other key financial indicators. The inputs come from the model’s underlying assumptions and forecast schedules, while the outputs provide presentation-ready visuals that can support business plans, pitch decks, internal planning documents, and lender packages. For a cleaning service business, these visuals are useful because they help stakeholders see the operating story more clearly: early investment in marketing and staff may create short-term losses, while recurring customers and commercial contracts may support long-term revenue growth and margin improvement. By including clean, professional charts, the template helps users communicate financial expectations more confidently and avoid relying only on dense spreadsheets.
ROE Components and DuPont Analysis
The ROE components and DuPont analysis section helps users evaluate return on equity by breaking it into the underlying financial drivers that influence shareholder returns. Instead of looking only at a single return number, this component helps users understand whether return performance is being driven by profit margins, asset efficiency, or financial leverage. For a cleaning service, this can be useful because the business may have relatively limited fixed assets compared with some industries, but it can still require upfront investment in equipment, vehicles, technology, working capital, marketing, and staff ramp-up. Inputs may include net income, revenue, total assets, equity investment, liabilities, and forecast balance sheet values. Outputs may include return on equity and related DuPont components, giving users a clearer view of whether profitability, asset utilization, or capital structure is helping or hurting returns. This section is especially relevant for investors and founders evaluating whether the business can produce an acceptable return over time. If ROE is weak, the model can help identify whether the issue is low margins, slow revenue growth, high operating expenses, inefficient asset use, or too much capital tied up in the business. That insight supports better decisions about pricing, staffing, funding, and growth strategy.
Revenue Inputs
The revenue inputs section is where users define the assumptions that drive the cleaning service’s sales forecast. This component is critical because revenue in a cleaning business can come from multiple sources, including residential subscriptions, commercial subscriptions, one-time deep cleans, add-on services, special projects, or recurring contracts. Users can customize assumptions such as monthly price per residential client, monthly commercial contract value, number of new customers, customer acquisition cost, marketing budget, conversion rates, retention, service frequency, and service mix. The model then uses these assumptions to calculate projected revenue over time and show how the business may scale as customer acquisition improves or pricing changes. For a cleaning service startup, this is useful because it forces the user to think through the relationship between marketing spend and customer growth rather than simply entering a revenue target. For an existing cleaning company, it can help evaluate new pricing, expanded service areas, or a shift toward higher-margin commercial clients. By documenting revenue assumptions clearly, this section also improves credibility with lenders and investors, who often want to see the logic behind sales projections rather than only the final revenue number.
Bank-Ready Reports
The bank-ready reports component organizes the model’s financial outputs into a format that can support lender discussions, loan applications, investor reviews, or formal business planning. Banks and funding partners typically want to understand whether a business can generate enough revenue and cash flow to cover expenses, repay debt, maintain liquidity, and operate sustainably. This section may include summarized profit and loss projections, cash flow forecasts, balance sheet outputs, funding needs, debt assumptions, repayment capacity, profitability metrics, and key financial indicators. Inputs may come from revenue schedules, payroll assumptions, operating expenses, startup costs, financing assumptions, and working capital timing. Outputs help present the cleaning service’s financial story in a structured and professional way, showing how the business expects to move from startup investment to operating stability and eventual profitability. For cleaning service founders, this component is valuable because it reduces the time required to prepare financial materials for banks or stakeholders. It also helps users answer practical funding questions, such as how much capital is needed, how long the runway should be, when cash balances may be tight, and whether projected earnings can support obligations. A lender-friendly financial output can make the planning process more organized and the funding conversation more credible.
Revenue Breakdown
The revenue breakdown component provides a detailed view of how total sales are generated across different cleaning service revenue streams. Rather than treating revenue as one broad number, this section separates income by service category, such as residential subscriptions, commercial subscriptions, and one-time deep cleaning work. It may also support additional service categories depending on how the user customizes the model. Inputs may include service pricing, customer counts, contract volume, retention, frequency of service, one-time job volume, upsell rates, or growth assumptions by segment. Outputs may show monthly and annual revenue by stream, the percentage contribution of each category, revenue growth trends, and changes in the service mix over time. This is useful because different cleaning services often have different margins, staffing needs, customer acquisition costs, and stability levels. Residential subscriptions may provide recurring demand, commercial contracts may offer larger monthly values, and one-time deep cleans may create flexible revenue opportunities but less predictability. By analyzing revenue at this level, users can decide which services deserve more marketing focus, whether prices should be adjusted, whether commercial accounts should be prioritized, and how changes in service mix may affect profitability and cash flow.
KPI Dashboard
The KPI dashboard component helps users track the key performance indicators that matter most for operating and scaling a cleaning service business. Financial statements show the end result, but KPIs help explain why those results are happening. This section may include metrics related to customer acquisition cost, customer growth, average revenue per customer, recurring revenue, gross margin, EBITDA margin, payroll as a percentage of revenue, marketing efficiency, cash balance, break-even timing, payback period, and return metrics. Inputs come from the model’s revenue, expense, staffing, marketing, and cash flow assumptions, while the outputs provide benchmark-style indicators that make performance easier to assess. For a cleaning service, KPIs are useful because management decisions often depend on operational efficiency. If customer acquisition cost is too high, marketing strategy may need adjustment. If payroll is rising faster than revenue, routing, scheduling, pricing, or staffing assumptions may need review. If recurring revenue is growing but cash flow remains weak, payment terms or working capital may require attention. The KPI dashboard gives users a practical way to monitor performance, compare projected results against goals, and communicate the business’s financial health to partners, investors, lenders, or internal teams.
Startup Cost Planning
The startup cost planning component helps users estimate the initial investment required to launch or prepare the cleaning service for operations. A cleaning business may require spending before revenue begins, including cleaning equipment, supply inventory, uniforms, insurance deposits, licensing, website development, booking software, marketing setup, office setup, vehicle-related costs, training, initial hiring, working capital, and any specialized technology or pilot programs. This section allows users to enter or edit one-time startup expenses and understand how those costs affect funding needs and cash runway. Outputs may include total initial capital required, startup cost categories, timing of cash outflows, and the relationship between launch spending and available cash. This is useful because underestimating startup costs can create liquidity problems before the business has enough recurring revenue to support itself. For founders preparing a business plan or loan application, this section provides a clearer explanation of where funds will be used. For established cleaning companies expanding into a new market or service line, it can help budget for equipment, staffing, marketing, and setup costs before expansion begins. By separating startup costs from ongoing operating expenses, the model makes it easier to understand the true capital needed to launch responsibly.
Break-Even Analysis
The break-even analysis component helps users estimate when the cleaning service may reach the point where revenue is sufficient to cover its costs. This is one of the most important planning outputs for a service business because early-stage cleaning companies often face upfront marketing spend, staffing investment, equipment purchases, and operating costs before recurring revenue reaches a sustainable level. Inputs may include fixed operating expenses, variable costs, payroll, gross margin, service pricing, customer volume, startup costs, and revenue growth assumptions. Outputs may show the break-even month, the revenue level needed to cover expenses, the customer base required to support the cost structure, and the time needed to recover early losses or initial investment. This section is useful for planning because it gives founders a realistic profitability milestone and helps them understand what must happen operationally to achieve it.
File types:
Excel – Single-User: .xlsx
Excel – Multi-User: .xlsx
Similar ProductsOther customers were also interested in...


 HenrySheykin
Vitamins Subscription Box Financial Model Excel Te...
The Vitamin Subscription Box Financial Model helps entrepreneurs, founders, consultants, analysts, a... Read more
Monthly Recurring Revenue SaaS Financial Model Exc...
The SaaS Business Financial Model helps founders, entrepreneurs, consultants, analysts, and business... Read more
SaaS Actuals Opt-In Financial Model Excel Template
The SaaS Business Financial Model helps founders, entrepreneurs, consultants, analysts, and business... Read more

Beauty Subscription Box Financial Model Excel Temp...
The Beauty Subscription Box Financial Model helps founders, entrepreneurs, consultants, analysts, an... Read more
SaaS Financial Model Excel Template
The SaaS Business Financial Model helps founders, entrepreneurs, consultants, analysts, and business... Read more
SaaS Freemium Financial Model Excel Template
The SaaS Business Financial Model helps founders, entrepreneurs, consultants, analysts, and business... Read more
SaaS Application Freetrial Financial Model Excel T...
The SaaS Business Financial Model helps founders, entrepreneurs, consultants, analysts, and business... Read more
CRM Software Financial Model Excel Template
The CRM Software Financial Model is a ready-to-use financial model template designed to help founder... Read more

Online Classes Subscription Financial Model Excel ...
The Online Class Subscription Financial Model helps entrepreneurs, founders, consultants, analysts, ... Read more

Fresh Flowers Subscription Financial Model Excel T...
The Subscription Box Financial Model Template helps entrepreneurs, founders, analysts, consultants, ... Read more
You must log in to submit a review.