
0 ITEMS

Software Development Financial Model Excel Template
The Software Development Financial Model Template helps founders, entrepreneurs, consultants, analysts, and business owners turn a software development agency or technology services concept into a structured financial forecast. Instead of starting with a blank spreadsheet, users can work from a ready-to-use model designed around the economics of project-based development, application module work, recurring maintenance contracts, technical staffing, operating expenses, and scalable service delivery. It gives buyers a practical way to organize financial planning assumptions, estimate startup costs, forecast revenue, understand cost structure, and evaluate profitability over a multi-year period. This template is useful for business plans, investor discussions, loan applications, internal strategy reviews, and management decision-making. Users can enter their own assumptions for pricing, project volume, contract mix, payroll, direct costs, operating expenses, capital expenditures, financing, and growth timing, then review how those assumptions flow through the model. The result is a clearer view of projected revenue, gross margin, EBITDA, net income, cash flow, balance sheet movement, break-even timing, and runway. For a software development business, where staffing decisions, client acquisition, project scope, and recurring support income can significantly affect financial outcomes, having these assumptions connected in one model can save time and reduce planning errors. The Software Development Financial Model is built to support both early-stage planning and growth-stage forecasting. A founder preparing to launch can use it to estimate initial investment needs, workstation and infrastructure costs, payroll requirements, working capital, and expected sales ramp-up. An established agency can adapt the model to evaluate expansion, new service lines, hiring plans, margin improvement, or funding needs. Consultants and financial analysts can also customize the model for client projects, investor materials, or feasibility studies without rebuilding formulas from scratch. With editable inputs, integrated financial statements, scenario analysis, charts, performance dashboards, and investor-friendly outputs, the template helps users move from assumptions to decisions. It supports a disciplined planning process by making it easier to compare revenue assumptions against expenses, test low and high cases, understand break-even requirements, and communicate results clearly to partners, lenders, investors, and internal teams. The model is compatible with Excel and Google Sheets, making it accessible for individual users and collaborative teams.
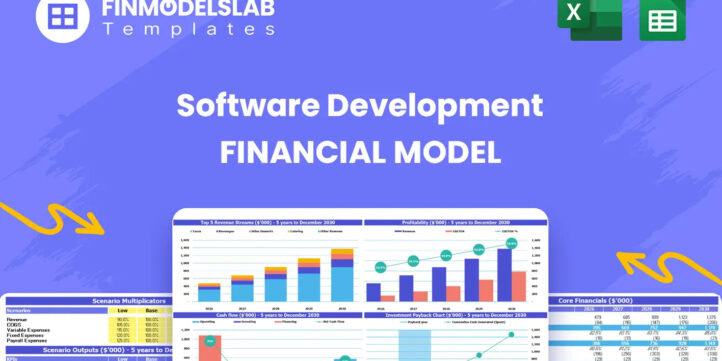


Financial Model Overview
The Software Development Financial Model is a ready-to-use financial model template created for founders, entrepreneurs, consultants, analysts, and business owners planning or managing a software development agency, technology services firm, or custom application development business. It brings the major financial drivers of the business into one connected forecast, including project-based revenue, recurring support contracts, direct delivery costs, payroll, operating expenses, capital expenditures, financing, profitability, cash flow, and investor metrics. The model is designed to help users replace rough estimates with a structured planning tool that can support business plans, funding discussions, bank submissions, internal budgeting, and strategic decision-making. By entering assumptions into editable input areas, users can see how pricing, project volume, staffing, startup investment, overhead, and growth targets affect the income statement, cash flow, balance sheet, break-even position, and long-term financial performance. For a software development business, where margins can look attractive but cash flow may depend on project timing, deposits, hiring pace, and client payment terms, this type of model is especially useful. It gives users a practical framework for testing whether the business can scale profitably, maintain adequate liquidity, and present a credible financial story to stakeholders.
All-in-One Dashboard
The all-in-one dashboard gives users a central place to review the most important inputs and outputs of the Software Development Financial Model without moving through every worksheet in detail. It is designed to summarize the financial plan in a practical, decision-ready format, combining core assumptions with key forecast results such as revenue, costs, profitability, cash position, break-even timing, and runway. Users can use this section to quickly check whether their input assumptions are producing a realistic business outlook and whether the financial model is aligned with their growth strategy. For example, if projected revenue increases but cash flow weakens because payroll or capital spending rises too quickly, the dashboard helps highlight that relationship. This component is especially useful for founders and managers who need an at-a-glance view before discussing the plan with partners, investors, lenders, or internal teams. It also helps reduce the risk of relying on isolated numbers by showing the broader financial picture in one connected summary. Instead of manually pulling figures from several worksheets, users can rely on the dashboard to provide a fast review of projected performance and guide deeper analysis where needed.
Low Base High Scenario Analysis
The low, base, and high scenario analysis component helps users understand how the software development business may perform under different market and operating conditions. A base case can represent the expected business plan, while the low case can reflect slower client acquisition, smaller contract values, longer sales cycles, higher costs, or delayed hiring, and the high case can show the impact of stronger demand, larger projects, better utilization, or faster recurring support contract growth. This section may use assumptions such as project volume, average development fees, maintenance contract adoption, payroll growth, cost ratios, payment timing, and operating expense changes to generate alternative financial outcomes. The outputs help users compare revenue, margins, EBITDA, net profit, cash flow, and funding needs across multiple possibilities. This is valuable because software development businesses often face uncertainty around deal flow, delivery capacity, client retention, and project timing. By stress-testing the plan, users can identify which assumptions carry the most risk and which commercial levers have the greatest upside. Scenario analysis also strengthens investor and lender conversations because it shows that management has considered more than one outcome and has a plan for downside protection as well as growth opportunities.
Professional Charts
The professional charts component converts the financial forecast into clear visual outputs that can be used for presentations, reports, investor updates, and management reviews. Rather than forcing users to interpret long rows of numbers, the charts help communicate revenue trends, profitability movement, cash balance changes, cost composition, and other key financial metrics in a format that is easier to understand. Inputs and calculations from the model flow into visual displays, allowing users to see how the software development business is expected to grow over time and how financial performance changes across months or years. This is particularly useful when presenting to stakeholders who need a clear summary of the business plan but may not want to review the full spreadsheet in detail. For a software development firm, charts can help illustrate the ramp-up of core platform projects, application module work, and maintenance support revenue, as well as the relationship between payroll, operating expenses, and profit margins. Professional visual reporting also supports better internal decision-making because it makes trends easier to spot, such as declining margins, increasing burn, improving cash flow, or a widening gap between revenue growth and expense growth. The result is a more polished and practical forecast that can support both strategic planning and external communication.
ROE Components and DuPont Analysis
The ROE components and DuPont analysis section helps users understand the drivers behind return on equity rather than viewing ROE as a single isolated result. This component breaks the return profile into underlying factors that may include profitability, asset efficiency, and financial leverage, allowing users to see how operational performance and capital structure influence shareholder returns. In a software development business, where assets may be lighter than in many physical industries but payroll, working capital, and growth investments can still be significant, this analysis can help clarify whether returns are being driven by strong margins, efficient use of resources, or financing decisions. Users may adjust assumptions related to revenue, costs, equity investment, debt, capital expenditures, and retained earnings, then review how those changes affect ROE and related performance indicators. This is useful for investors and business owners because it helps explain not only whether the company is generating returns, but why those returns are occurring. It can also support decisions about whether to reinvest profits, raise additional equity, use debt financing, expand capacity, or maintain a leaner operating structure. By including DuPont-style analysis, the model provides a more sophisticated view of financial performance that can strengthen funding materials and strategic discussions.
Revenue Inputs
The revenue inputs component gives users a structured area to define the commercial assumptions that drive the software development financial forecast. Instead of using a single generic revenue line, the model is designed around the types of revenue a software development agency may generate, such as core platform development projects, application module builds, maintenance support contracts, and other service-based or recurring income streams. Users can edit assumptions for pricing, number of projects, contract timing, growth rates, service mix, and recurring support adoption to reflect their own business plan. These inputs then feed into the forecast, helping generate monthly and annual revenue projections over the model period. This component is important because revenue assumptions are often the most sensitive part of a software development forecast. A small change in average project value, sales conversion, client retention, or support contract penetration can significantly affect profitability and cash flow. By separating the revenue drivers clearly, the model helps users build a more credible and transparent forecast. It also allows founders and consultants to explain how the business will generate income, what services will contribute most to growth, and how recurring revenue may improve stability over time.
Bank-Ready Reports
The bank-ready reports component organizes the financial outputs in a format that is suitable for lenders, credit reviewers, financial advisors, and other stakeholders who need a clear view of the company’s ability to operate and repay obligations. This section typically brings together core statements and metrics such as revenue, expenses, profit, cash flow, balance sheet position, debt assumptions, capital needs, and repayment capacity. For a software development business seeking a loan, line of credit, equipment financing, or working capital facility, lenders will usually want to understand not only growth potential but also cash stability, expense discipline, and the timing of inflows and outflows. The reports help users present this information in a structured and professional way. Inputs from revenue, payroll, operating expenses, startup costs, and financing assumptions flow into summarized outputs that can support loan applications or banking discussions. This component is also useful for internal planning because it encourages users to think in lender-friendly terms, such as whether the business can maintain positive cash balances, cover fixed costs, and support any debt service. By including bank-ready financial outputs, the Software Development Financial Model helps users communicate their forecast with clarity and credibility.
Revenue Breakdown
The revenue breakdown component provides a detailed view of how total revenue is built from individual revenue streams, making it easier to understand which services or contracts contribute most to the forecast. For a software development business, this may include core platform development, application module development, maintenance support contracts, custom integrations, technical consulting, support retainers, or other service categories that the user chooses to model. The purpose of this section is to move beyond a single top-line revenue number and show the composition of sales over time. Users can enter assumptions for each revenue stream, such as number of clients, number of projects, average contract value, recurring fees, renewal timing, and expected growth. The model then helps calculate the contribution of each stream to total revenue and allows users to see how the mix changes as the company scales. This is valuable for decision-making because a business that depends heavily on large one-time projects may have different risks than one with a stronger base of recurring maintenance contracts. The breakdown can also help identify high-margin opportunities, pricing gaps, concentration risk, and areas where sales and marketing efforts should be focused. For investors and lenders, a clear revenue breakdown makes the business model easier to understand and evaluate.
KPI Dashboard
The KPI dashboard gives users a focused view of the performance metrics that matter most for managing and evaluating a software development business. While financial statements show the accounting results, KPIs help explain operational performance and business quality. This section may include metrics such as revenue growth, gross margin, EBITDA margin, net profit margin, cash runway, burn rate, return on equity, payback period, break-even timing, cost ratios, and other benchmarks relevant to the company’s stage and strategy. Users can review how these indicators change over the forecast period and compare them against internal targets or industry expectations. This component is useful because software development businesses must balance growth, delivery capacity, staffing efficiency, client acquisition, and profitability. A company may show increasing revenue, but KPIs can reveal whether margins are improving, whether payroll is scaling responsibly, or whether cash reserves are sufficient to support expansion. The KPI dashboard also makes it easier to communicate performance to stakeholders in a concise way. Founders can use it for board updates, consultants can use it in client deliverables, and analysts can use it to identify areas requiring deeper review. By consolidating key metrics, the dashboard supports faster decisions and more disciplined financial management.
Startup Costs and CAPEX Planning
The startup costs and CAPEX planning component helps users estimate the initial investment required to launch or expand the software development business before meaningful revenue is generated. For a technology services firm, startup costs may include high-performance workstations, laptops, office furniture, networking equipment, server infrastructure, software licenses, security tools, legal setup, branding, website development, deposits, initial marketing, recruiting expenses, and working capital reserves. This section allows users to itemize these costs and understand how much funding may be needed at the start of operations. The model can then connect these assumptions to cash flow, balance sheet, depreciation, and funding requirements, helping users see the impact of upfront spending over time. This is especially important for software development companies because the business may appear asset-light, but professional delivery still requires reliable equipment, collaboration tools, development environments, and enough cash to support payroll before client payments arrive. By separating one-time startup expenses from ongoing operating costs, the model helps users avoid underestimating launch requirements. It also supports funding discussions by showing exactly where initial capital will be used and how those investments support the company’s ability to deliver services, attract clients, and scale operations.
Cash Flow Runway and Break-Even Planning
The cash flow runway and break-even planning component helps users evaluate whether the software development business can maintain enough liquidity while it grows and when it is expected to become profitable. This section connects revenue timing, client payment behavior, payroll, operating expenses, capital expenditures, financing, taxes, and working capital assumptions to show monthly and annual cash movement. It can help users identify periods when cash may tighten, estimate how long available funds will last, and determine whether additional financing or cost control may be needed. Break-even planning adds another layer of insight by showing the point at which revenue is sufficient to cover fixed and variable costs.
File types:
Excel – Single-User: .xlsx
Excel – Multi-User: .xlsx
Similar ProductsOther customers were also interested in...

 HenrySheykin
E-Commerce Software Financial Model Excel Template
The E-Commerce Platform Financial Model Financial Model Template helps founders, entrepreneurs, cons... Read more
Data Analytics Software Financial Model Excel Temp...
The Data Analytics Software Financial Model helps users build a structured financial forecast for a ... Read more
Customer Service Software Financial Model Excel Te...
The Customer Service Software Financial Model helps founders, operators, consultants, and analysts t... Read more
Equipment Rental Subscription Financial Model Exce...
The Equipment Rental Subscription Financial Model helps users turn an equipment-as-a-service busines... Read more
CRM Software Financial Model Excel Template
The CRM Software Financial Model is a ready-to-use financial model template designed to help founder... Read more
Fresh Flowers Subscription Financial Model Excel T...
The Subscription Box Financial Model Template helps entrepreneurs, founders, analysts, consultants, ... Read more
Procurement Software Financial Model Excel Templat...
The Procurement Software Financial Model helps founders, entrepreneurs, consultants, analysts, and b... Read more
Accounting Software Financial Model Excel Template
The Accounting Software Financial Model helps founders, entrepreneurs, consultants, analysts, and bu... Read more
SaaS Actuals Opt-In Financial Model Excel Template
The SaaS Business Financial Model helps founders, entrepreneurs, consultants, analysts, and business... Read more
Human Resource Software Financial Model Excel Temp...
The HR Software Financial Model Financial Model Template helps founders, business owners, consultant... Read more
Reviews
 Software development in finance
Useful post, thanks! This financial plan template offers a comprehensive and well-structured framework to help entrepreneurs and business owners effectively plan and forecast their financials.
448 of 882 people found this review helpful.
Help other customers find the most helpful reviews
Did you find this review helpful?
You must log in to submit a review.