
0 ITEMS

Mastering CVP Analysis Excel: A Step-By-Step Guide
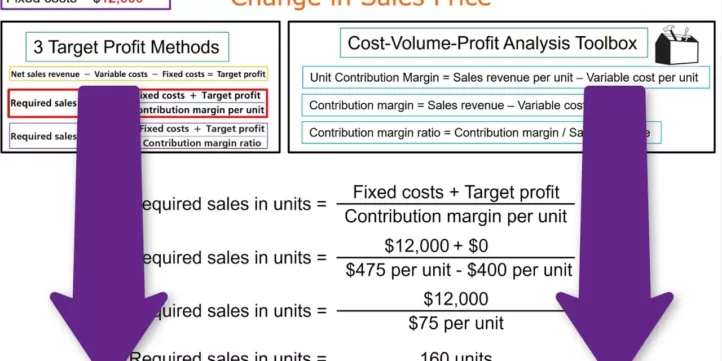
CVP analysis in Excel helps businesses understand how costs, sales volume, and pricing influence profitability.
- It involves key concepts like fixed costs, variable costs, contribution margin, and breakeven points.
- Setting up an effective Excel model allows for quick calculation of profit targets and cost analysis.
- Visual tools like charts make it easier to interpret data and identify trends.
- Sensitivity analysis with Excel scenarios tests how changes in inputs impact profits.
- Accurate data organization and use of formulas can streamline decision-making and strategic planning.
This guide provides practical steps to master CVP analysis in Excel and improve business financial strategies.
Introduction To CVP Analysis In Excel
Welcome to the fascinating world of financial analysis through Excel! Today’s journey unravels the mysteries behind CVP Analysis in Excel, a technique that uncovers how changes in costs, sales volume, and prices impact a business’s profits. Understanding and mastering this skill is crucial for anyone aspiring to excel in the financial and business management arena.
The Importance Of Cost-volume-profit Analysis
Cost-Volume-Profit Analysis, or CVP, is a powerful financial tool. It helps businesses make informed decisions. It does this by showing how changes in production costs, sales volume, and price affect profit. With CVP, businesses set better prices, choose the best product mix, and plan for profit targets.
- Set accurate sales targets – Know how many products to sell for profit.
- Make pricing decisions – Find the right price for products or services.
- Plan for changes – Adjust plans if costs or market conditions change.
Excel As A Tool For Financial Modeling
In the realm of financial modeling, Excel stands out. It’s a versatile platform that can handle complex CVP Analysis with ease. With Excel’s formulas and tables, you can create dynamic models that respond instantly to new data. Financial modeling in Excel makes complex calculations simple and accessible.
| Excel Features for CVP Analysis | Benefits |
|---|---|
| Formulas | Automate calculations and updates. |
| Charts | Visualize data for easy insights. |
| Tables | Organize data and perform what-if analysis. |
Fundamentals Of CVP Analysis
The success of your business relies on understanding how your costs, sales, and profit interact—welcome to the world of Cost-Volume-Profit (CVP) Analysis. Mastering CVP in Excel can empower you with insightful data. Let’s dive into the fundamentals of this powerful tool, and see how it can predict the profitability of your business.
Key Concepts And Terms
- Fixed Costs: These stay the same regardless of how much you sell.
- Variable Costs: These change directly with sales volume.
- Sales Price per Unit: The selling price for each item or service.
- Contribution Margin: Sales revenue minus variable costs.
- Contribution Margin Ratio: The portion of sales revenue left over after variable costs.
At its core, CVP links:
| Sales Volume | Sales Price | Fixed Costs | Variable Costs | Profit |
|---|
These elements work together to paint a clear picture of your financial status and highlight pathways to profit.
Understanding Breakeven Points
The breakeven point is where total costs equal total revenue—no loss, no gain. It’s critical for decision-making and planning future growth. To pinpoint this key benchmark in Excel, use this formula:
=Fixed Costs / (Sales Price per Unit – Variable Cost per Unit)
This formula calculates how many units you need to sell to cover all costs. Knowing this number gives a clear target to aim for in sales strategies.
Setting Up Your Excel Workspace
Mastering Cost-Volume-Profit (CVP) analysis in Excel begins with setting up your workspace correctly. This ensures a smooth workflow and accurate results. Let’s make Excel work for your CVP needs.
Essential Excel Features And Functions
To jumpstart your CVP analysis, understanding Excel’s tools is key. Focus on these features:
- Data input cells: Designate areas to enter variable costs, fixed costs, and sales price.
- Formulas: Automate calculations with functions like
=SUM()and=AVERAGE(). - Charts: Visualize results with Pie charts and Line graphs.
- What-If Analysis: Use Scenario Manager to see different outcomes.
Master shortcuts like Ctrl+C (copy), Ctrl+V (paste), and Alt+= (auto sum). These save time and effort.
Organizing Data For CVP Analysis
Proper organization is the backbone of effective CVP analysis. Begin with these steps:
- Set up columns for each variable: Quantity Sold, Sales Revenue, Variable Costs, and Fixed Costs.
- Segment your data: Group similar expenses together for clarity.
- Label each row and column: This prevents confusion and errors.
- Utilize Excel’s table feature
(>Insert > Table)for a neat, organized look.
Remember to check formatting: Align decimals and use currency symbols for clear financial data.
| Product | Quantity Sold | Sales Revenue | Variable Costs | Fixed Costs |
|---|---|---|---|---|
| Product A | 100 | $1,000 | $500 | $300 |
| Product B | 150 | $1,500 | $750 | $300 |
Keep cell formats consistent: Use conditional formatting to highlight key figures, like break-even points.
Inputting Basic Financial Data
A deep dive into CVP (Cost-Volume-Profit) analysis in Excel starts with data entry. Begin by setting up your spreadsheet with all necessary financial data. This solid foundation will help you envision the impact of volume changes on costs and profits.
Variable Costs And Fixed Costs
Two vital types of costs affect profitability. It’s crucial to distinguish between them:
- Variable Costs: These change with sales volume. Include materials and labor.
- Fixed Costs: They remain constant regardless of sales. Examples are rent and salaries.
| Cost Type | Description | Examples |
|---|---|---|
| Variable Costs | Costs changing with production volume | Raw materials, direct labor |
| Fixed Costs | Costs constant at different sales levels | Rent, insurance, salaries |
Enter your variable costs per unit and total fixed costs into designated Excel cells for accuracy and ease of analysis.
Sales And Revenue Data Integration
Accurate sales data ensures meaningful CVP results. Here’s how to integrate sales and revenue data:
- Collect historical sales figures if available.
- Input the selling price per unit in Excel.
- Enter projected units sold to forecast revenues.
By organizing this data in Excel, you can easily explore different sales scenarios and their possible outcomes. This hands-on exercise aids in strategic planning and decision-making.
Calculating Breakeven And Target Profits
As the cornerstone of effective financial planning, understanding how to utilize Cvp (Cost-Volume-Profit) Analysis in Excel is essential. With the right steps, accurately calculating breakeven points and setting solid profit targets becomes clear. These pivotal figures reveal when a business will start to profit and how to plan for financial growth.
Using Formulas To Determine Breakeven
To pinpoint where costs and revenues break even, Excel simplifies the math.
- First, input fixed costs, variable costs per unit, and price per unit into separate cells.
- Next, use the formula:
=Fixed Costs / (Price per Unit - Variable Cost per Unit). This calculation will yield the number of units needed to cover all costs. - Review the result to understand exactly how many sales are needed to breakeven.
It’s often beneficial to visually analyze this point through charts available in Excel.
Setting And Achieving Profit Goals
After knowing the breakeven point, setting profit goals is the next step.
- Determine the desired profit margin to set a specific target revenue.
- Add the target profit to fixed costs within the same breakeven formula:
= (Fixed Costs + Desired Profit) / (Price per Unit - Variable Cost per Unit). - This adjusted formula reveals the number of units needed to reach the profit goals.
With this systematic approach, achieve financial targets and strategize for success.
Regularly adjusting and monitoring these calculations ensures staying on track toward business objectives.
Visualizing Data With Excel Charts
Visualizing data with Excel charts transforms complex CVP (Cost-Volume-Profit) analysis into easily understandable graphics. Excel’s charting capabilities allow us to spot trends, patterns, and outliers in data. In mastering CVP analysis, visualization is key. Charts make the link between numbers and business decisions clearer.
Constructing Graphs For CVP Analysis
Creating graphs for CVP analysis in Excel involves a few structured steps:
- Select data that represents variable and fixed costs, as well as sales data.
- Under the Insert tab, choose the right chart type, often a line or scatter plot.
- Format the graph by adding titles, axis labels, and legends for clarity.
With these steps, users build a break-even chart that shows the point where total costs equal total revenue.
Interpreting Data Through Visualization
Excel graphs provide visual summaries of complex data. This helps in:
- Identifying the break-even point at a glance.
- Observing the impact of changing costs or prices on profits.
- Comparing multiple product lines to make informed decisions.
Excel charts bring data to life, making the interpretation of CVP elements such as the margin of safety, and the degree of operating leverage, intuitive and actionable.
Sensitivity Analysis With Excel Scenarios
Welcome to the insightful world of Sensitivity Analysis using Excel Scenarios!
Mastering the art of sensitivity analysis in Excel allows businesses and financial analysts to predict outcomes in a dynamic financial landscape. Excel’s Scenario Manager is a powerful tool to handle such analyses with competency.
Adjusting Inputs To Test Outcomes
Testing outcomes involve changing key variables to see various possible results. This method helps in understanding the resilience of business strategies under different conditions.
- Select your variables like sales volume, cost of goods sold, or pricing.
- Create scenarios for best-case, worst-case, and most-likely outcomes.
- Analyze how these adjustments affect the bottom line.
Analyzing Impact On Profits
Profit impacts from each scenario unveil the financial health of a project.
- Feed the data into Excel’s Scenario Manager.
- Compare results side by side.
- Identify the most sensitive inputs affecting profits.
Graphs and charts highlight these impacts visually, helping to understand complex data effortlessly.
Advanced Excel Techniques
Excel’s advanced features can turn CVP analysis into a powerful tool for your business. Techniques like macros and PivotTables bring efficiency and depth. Learn to use them well, and you will master Excel.
Automating Calculations With Macros
Macros in Excel can do hard work for you. Think of them as custom commands that handle repetitive tasks. Use them right, and they can do calculations fast, with no mistakes. Here’s how to set up a macro for your CVP analysis:
- Open Excel’s Developer tab.
- Click on Record Macro.
- Perform your CVP calculations as you normally would.
- Click Stop Recording when done.
- Assign a button to your macro. Now, one click does all the math.
To run your macro, just click the button you created. Excel does the rest. Save time and reduce errors in your CVP analysis.
Using Pivottables For Data Analysis
PivotTables organize large data sets with ease. They sort, count, and total your data fast. For CVP analysis, they can show insights you might miss. Follow these steps to start:
- Select your data range.
- Go to Insert and pick PivotTable.
- Choose where you want the PivotTable.
- Drag and drop fields to customize.
With PivotTables, you can compare products, check sales trends, and more. They make complex data easy to handle. Use them to power up your analysis.
Tips For Accurate CVP Modeling
Mastering CVP Analysis Excel can transform your business planning and forecasting. Yet accuracy is the linchpin of effective CVP modeling. Let’s explore solid tips to keep your CVP Analysis precise and powerful.
Avoiding Common Mistakes
To ensure your CVP Analysis doesn’t derail, sidestep these common errors:
- Not updating variables: Costs and prices change. Regular updates are vital.
- Mixing up fixed and variable costs: Be crystal-clear on what costs don’t change with volume.
- Ignoring the break-even point: Know when revenues cover all expenses. It’s critical.
Cross-checking Results For Reliability
Trust in your CVP Analysis emerges from rigorous checking. Try these checks:
- Use a different method: Confirm results with another calculation or software.
- Double-check formulas: Even small errors in Excel formulas can skew results.
- Sensitivity analysis: See how results shift with changes in key variables.
Always compare with past data to spot potential discrepancies.
Applying CVP Analysis To Business Decisions
Cost-Volume-Profit (CVP) analysis is a powerful tool for businesses.
It helps understand how changes in costs and volume affect profits. This guide will show how to apply CVP analysis in Excel to make informed decisions.
Strategic Planning Using CVP
CVP analysis shapes strategic business planning. It explores scenarios and sets targets.
- Breakeven Points: Find the sales volume where profits hit zero.
- Profit Goals: Identify sales needed for desired profits.
- Cost Control: See how cost changes impact the bottom line.
- Price Setting: Decide on pricing strategies to optimize profit.
Excel makes this simple. Create a table with fixed costs, variable costs per unit, and sales price.
| Fixed Costs | Variable Costs per Unit | Sales Price per Unit |
|---|---|---|
| $10,000 | $5 | $20 |
Next, use Excel formulas to calculate the breakeven point and target profit volumes.
Real-world Examples Of CVP At Work
Businesses use CVP to guide key decisions.
A coffee shop might use CVP to choose between two coffee beans.
| Bean A | Bean B |
|---|---|
| Lower cost, higher volume | Higher cost, lower volume |
Analysis shows Bean A maximizes profit with their customer base.
In manufacturing, CVP helps decide whether to buy new equipment.
| Current Equipment | New Equipment |
|---|---|
| Higher variable costs | Lower variable costs |
Despite the higher fixed cost of new equipment, CVP analysis could show long-term savings.
CVP analysis in Excel is a clear way to visualize impacts on profit.
Frequently Asked Questions
How Do I Create A CVP Chart In Excel?
Open Excel and input your variable costs, fixed costs, and sales data. Select the data and insert a line chart for visual representation. Customize the chart by adding a title, labels, and a break-even point to finalize your CVP chart.
What Are The Three Methods Used To Study CVP Analysis?
The three methods to study CVP analysis are the equation method, the contribution margin method, and the graphical method.
Is CVP Analysis Easy To Calculate?
CVP analysis can be straightforward if you understand the basic concepts and have accurate data. It involves simple calculations around costs, volume, and profit.
What Are The 3 Elements Of CVP Analysis?
The three elements of Cost-Volume-Profit (CVP) analysis are sales price per unit, variable cost per unit, and total fixed costs.
Conclusion
Mastering CVP analysis in Excel can dramatically refine your business strategies. With clear, actionable steps, you’ve gained invaluable insight. Implement what you’ve learned; the results will speak for themselves. Let this guide be your roadmap to making informed, data-driven decisions.
Excel at your financial insights, starting now.
























































You might also like:
- 10 Tips to Develop a First Class Business Valuation Report
- 10 Main Elements of a Business Plan
- 5 Practical Tips to Help Raise Funds For Startups
- How to Calculate Net Present Value (NPV)?
- How to Prepare a Financial Feasibility Study?
- Understanding the Debt Service Coverage Ratio: An Essential Metric for Financial Analysis
- Importance of Cash Flow Analysis in Business Planning
- Mastering the Art of IRR Calculation: A Comprehensive Guide for Investors
- Financial Modeling for Startups and Small Businesses
- Break-Even Analysis
- 3D Printing
- Agriculture
- Real Estate Valuation
- Business Valuation
- Financial Planning for Gym Startups
- Financial Modeling with Excel: Fundraising Plan Tactics
- Financial Model Templates Easy to Use
- Residential Properties
- 10-Step Financial Planning Checklist for Smart Executives
- How Contribution Margin Analysis Can Drive Your Business to Financial Success


