
0 ITEMS

Dump Truck Financial Model Excel Template
The Dump Truck Company Financial Model helps turn a hauling business idea into a structured, editable financial forecast. Built for dump truck operators, transportation entrepreneurs, consultants, analysts, and founders preparing business plans or funding documents, the template gives users a practical way to estimate revenue assumptions, startup costs, operating expenses, payroll, cash flow, and profitability before committing capital to trucks, equipment, hiring, and depot setup. This financial model template is designed around the realities of a capital-intensive hauling business. Users can plan revenue from hourly hauling, per-load hauling, material sales, debris removal, and other service lines while connecting those assumptions to customer growth, billable hours, pricing, fuel usage, maintenance, insurance, staffing, and equipment needs. Instead of relying on scattered estimates, the model organizes key business drivers in one place so users can understand how operational decisions affect monthly and annual financial performance. The template is especially useful for evaluating whether a dump truck company can support its cost structure, reach break-even, manage early cash shortages, and move toward sustainable profitability. It helps users review the impact of startup investment, recurring expenses, payroll planning, fleet expansion, and financing decisions over a multi-year projection period. With built-in financial statements, cash flow forecasting, profitability analysis, and visual reporting, it supports both internal decision-making and external presentations to lenders, investors, partners, or advisors. Whether you are launching a new dump truck company, expanding an existing hauling operation, or preparing a transportation business forecast for a client, this ready-to-use model saves time compared with building a spreadsheet from scratch. It provides a professional framework that can be customized to your own assumptions, service mix, local pricing, equipment costs, and growth strategy, helping you test scenarios, evaluate risks, and make more confident financial decisions.
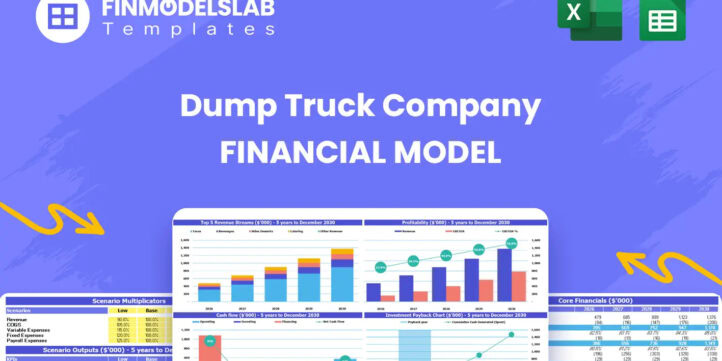


Financial Model Overview
The Dump Truck Company Financial Model is a ready-to-use financial model template built to help entrepreneurs, operators, consultants, and analysts plan the financial performance of a dump truck and hauling business. A dump truck company often requires meaningful upfront investment in trucks, loaders, depot improvements, insurance, maintenance systems, and working capital before revenue becomes stable, so a structured forecast is essential for understanding funding needs and long-term viability.
This template brings the main drivers of the business into one connected model, including service revenue, customer growth, billable hours, pricing, operating expenses, payroll, capital expenditures, financing, cash flow, profitability, and investor-ready outputs. Instead of creating complex formulas and reports from scratch, users can begin with an organized framework that is editable and suitable for business planning, lender discussions, investor presentations, internal budgeting, and strategic decision-making.
The model is designed to help users see how a dump truck company may perform over time, where cash pressure may occur, when the business could become profitable, and which assumptions have the greatest impact on the financial outcome.
All-in-One Dashboard
The all-in-one dashboard gives users a central view of the most important inputs and outputs in the Dump Truck Company Financial Model. It is designed to simplify the planning process by placing core assumptions, summary results, and high-level financial metrics in one accessible area, so users do not have to search through multiple tabs to understand the overall picture. Typical inputs may include revenue drivers, customer assumptions, pricing, growth rates, equipment investment, operating cost assumptions, payroll levels, and financing needs.
The dashboard then helps summarize outputs such as projected revenue, gross margin, EBITDA, net profit, cash position, capital requirements, and other decision-making metrics. For a dump truck company, this is especially useful because the business depends on several connected variables, including truck utilization, billable hours, fuel expense, maintenance costs, debt service, and customer acquisition. The dashboard allows owners and planners to quickly see whether their assumptions are producing a financially workable plan and whether additional changes are needed before launching, expanding, or presenting the forecast to stakeholders.
Low, Base, and High Scenario Analysis
The low, base, and high scenario analysis section helps users evaluate how the dump truck company may perform under different business conditions. Instead of relying on a single forecast, the model lets users compare conservative, expected, and optimistic cases to understand risk and upside potential. Inputs that may vary across scenarios include customer acquisition cost, customer growth, average billable hours, hourly rates, per-load pricing, job volume, fuel costs, maintenance intensity, payroll growth, financing costs, and fleet utilization. The outputs help show how each scenario affects revenue, operating profit, cash flow, funding needs, break-even timing, and return metrics.
This component is valuable because hauling businesses can be influenced by construction cycles, weather patterns, project delays, fuel price volatility, competitive pricing, and local demand. A low case can help users understand how much cash runway may be needed if growth is slower than planned, while a high case can show the financial upside of stronger demand or improved truck utilization. For lenders, investors, and internal decision-makers, scenario analysis demonstrates that the plan has been stress-tested rather than built around only one assumption set.
Professional Charts
The professional charts section converts the financial forecast into visual outputs that are easier to review, interpret, and present. A dump truck company forecast can involve many moving parts, including revenue by service line, expense categories, cash balances, EBITDA, net income, capital expenditures, and growth trends. Charts help translate those figures into a clearer story by showing trends over time and highlighting important financial patterns. Users may use this section to visualize monthly or annual revenue growth, profitability improvement, cash flow movement, expense ratios, debt repayment, break-even progress, and changes in key operating metrics.
This is useful for business plans and funding discussions because stakeholders often want to understand the financial direction of the business quickly before reviewing detailed spreadsheets. Well-structured charts can make it easier to explain why early losses may occur, how equipment investment supports future revenue, when cash shortages may appear, and how the company expects to scale. For entrepreneurs and consultants, presentation-ready visuals also save time when building pitch decks, lender packages, internal reports, or management updates.
ROE Components and DuPont Analysis
The ROE components and DuPont analysis section helps users understand what is driving owner returns in the dump truck company. Return on equity is especially important in a capital-intensive business because owners and investors need to know whether the capital invested in trucks, equipment, and working capital is producing acceptable returns. DuPont analysis breaks return on equity into underlying components, usually showing how profitability, asset efficiency, and leverage combine to create the final return.
In practical terms, this allows users to see whether returns are being driven by healthy operating margins, better utilization of trucks and equipment, or the use of debt financing. Inputs may include net income, equity investment, total assets, revenue, expenses, and financing structure, while outputs help show return on equity and the factors influencing it. For a dump truck company, this analysis can reveal whether the business is using its fleet productively, whether margins are strong enough after fuel and maintenance costs, and whether leverage is helping or creating unnecessary risk. This section is useful for founders, owners, and investors who want more than a basic profit forecast and need a deeper view of financial performance quality.
Revenue Inputs
The revenue inputs section is where users define the commercial assumptions that drive the financial forecast. For a dump truck company, revenue is typically connected to active customers, service type, pricing method, billable hours, load volume, job frequency, and customer acquisition. This section may include assumptions for hourly hauling, per-load hauling, material sales, debris removal, or other hauling services that fit the user’s business model. Users can adjust hourly rates, average billable hours per customer, number of customers, customer growth, marketing budget, customer acquisition cost, and service mix to reflect their local market and strategy.
These assumptions flow through the model to calculate projected monthly and annual revenue, helping users understand how much sales activity is needed to cover operating expenses and equipment costs. This component is useful because revenue planning for dump truck companies should not be based on a simple top-line guess. By linking revenue to specific drivers such as pricing, utilization, customer volume, and service categories, the model helps users create a more defensible forecast for business planning, funding applications, and operational goal setting.
Bank-Ready Reports
The bank-ready reports section provides structured financial outputs that can support lender conversations, investor reviews, and formal business planning. Dump truck companies often require financing for vehicles, equipment, depot improvements, working capital, and insurance deposits, so lenders usually want to see organized projections that demonstrate repayment capacity and financial discipline.
This component helps present the forecast through clean financial statements and summaries, including projected profit and loss, cash flow, balance sheet, funding needs, and key performance measures. Inputs from the rest of the model, such as revenue assumptions, operating expenses, payroll, capital expenditures, and financing terms, flow into these reports automatically so the outputs remain connected and consistent.
This section is useful because it helps users move beyond informal estimates and present a more professional financial package. A lender or investor can review projected sales, margins, cash balances, debt obligations, and profitability in a clear format, while the business owner can use the same reports to monitor whether the plan is realistic. For entrepreneurs preparing loan applications, investor updates, or partner discussions, bank-ready reporting can improve credibility and reduce the time needed to assemble financial documentation.
Revenue Breakdown
The revenue breakdown section gives users a more detailed view of where sales are expected to come from across the dump truck company’s different service lines. Instead of showing only one total revenue figure, the model separates income sources such as hourly hauling, per-load hauling, material sales, debris removal, or other user-defined services.
Each revenue stream can be supported by its own assumptions, such as number of customers, price per hour, hours per customer, loads per month, average revenue per load, material margins, or job frequency. The outputs help users see which services contribute most to total revenue, which lines may have stronger margins, and how the business mix changes over time. This is important because not all hauling revenue is equal.
Some services may generate consistent recurring work but lower margins, while others may be more project-based but more profitable. By reviewing the revenue breakdown, users can decide where to focus sales efforts, how to price services, and whether the business should prioritize construction hauling, debris removal, aggregate delivery, or other hauling opportunities. This section supports better forecasting, budgeting, and strategic planning because it connects service-level assumptions to the overall financial performance of the company.
KPI Dashboard
The KPI dashboard section tracks the key performance indicators that matter most for evaluating a dump truck company’s progress. Financial statements are important, but operators also need quick visibility into the operating and financial metrics that explain performance. This dashboard may summarize revenue growth, customer growth, average revenue per customer, gross margin, EBITDA margin, cash balance, burn rate, fleet utilization, break-even progress, return measures, and other relevant indicators. The inputs come from the detailed forecast assumptions and financial calculations, while the outputs give users a concise performance snapshot for management review and stakeholder updates.
For a dump truck business, KPI tracking is useful because small changes in utilization, pricing, fuel cost, or maintenance expense can meaningfully affect profitability. A dashboard helps users identify whether the company is generating enough billable activity per truck, whether operating costs are moving in line with revenue, and whether cash reserves are sufficient to support growth. It also helps simplify decision-making by turning detailed spreadsheet calculations into practical metrics that can be reviewed monthly, shared with advisors, or used in investor and lender presentations.
Startup and Capital Cost Planning
The startup and capital cost planning section helps users estimate the initial investment required to launch or expand a dump truck company. This is a critical component because hauling businesses often require major upfront spending before consistent revenue is generated. Inputs may include dump truck purchases, loaders or skid steers, trailers, yard or depot improvements, office setup, maintenance tools, technology systems, licenses, permits, insurance deposits, branding, initial marketing, legal costs, accounting support, and opening working capital.
The model can separate one-time launch costs from ongoing operating expenses, helping users understand how much funding is needed before the business can operate effectively. Outputs may include total startup investment, timing of capital expenditures, depreciation assumptions, financing needs, and the effect of equipment purchases on cash flow and the balance sheet.
This section is useful for planning because underestimating startup costs can create cash shortages that limit the company’s ability to take jobs, maintain equipment, or pay drivers. By laying out capital requirements clearly, users can decide whether to buy or lease equipment, how much owner investment may be required, what loan amount to request, and how the initial fleet plan affects long-term profitability.
Break-Even Analysis
The break-even analysis section helps users identify when the dump truck company’s revenue is expected to cover its fixed and variable costs. This is one of the most important planning tools for a hauling business because early months may involve high equipment costs, fuel spending, insurance, payroll, maintenance, and debt service while the customer base is still developing. Inputs may include monthly fixed overhead, payroll, equipment payments, fuel and maintenance costs, cost of goods sold, pricing, gross margin, and expected revenue volume. The outputs can show the break-even month, required revenue level, required job volume, and the gap between current projected performance and profitability.
This component is valuable because it translates the forecast into a clear milestone that owners, lenders, and investors can understand. It can also help users evaluate what changes would accelerate break-even, such as increasing billable hours, improving dispatch efficiency, securing recurring contracts, raising prices, reducing idle time, or adjusting the service mix toward higher-margin work. For business planning and decision-making, break-even analysis provides a practical view of how much operating activity is needed to make the company financially sustainable.
File types:
Excel – Single-User: .xlsx
Excel – Multi-User: .xlsx
Similar ProductsOther customers were also interested in...


 HenrySheykin
Freight Brokerage Financial Model Excel Template
The Freight Brokerage Financial Model Financial Model Template helps entrepreneurs, founders, busine... Read more

Tow Truck Financial Model Excel Template
This Tow Truck Service Financial Model Template helps users turn a towing business idea into a struc... Read more
Trucking Service Financial Model Excel Template
The Trucking Service Financial Model helps entrepreneurs, fleet owners, consultants, analysts, and b... Read more

 Pushkar
Online Car Rental – 3 Statement Financial Mo...
Online Car Rental Platform Business Plan Model is a perfect tool for a feasibility study on launchin... Read more

 eFinancialModels
Crane Rental Company Financial Model
Dive into the financial planning of your Crane Rental Company with our comprehensive 10-year monthly... Read more
 Giorgos
Trucking Company – 10 Year Financial Model
Financial Model providing a dynamic up to 10-year financial forecast for a startup or existing Truck... Read more
Car Rental Financial Model Excel Template
The Car Rental Financial Model helps entrepreneurs, founders, business owners, consultants, and anal... Read more
Delivery Service Financial Model Excel Template
The Delivery Service Financial Model Financial Model Template helps founders, operators, consultants... Read more

Ambulance Service Financial Model Excel Template
The Ambulance Service Financial Model is a ready-to-use financial model template designed to help en... Read more
Limousine Taxi Financial Model Excel Template
The Limousine Service Financial Model helps entrepreneurs, operators, consultants, analysts, and fou... Read more
You must log in to submit a review.