
0 ITEMS

Delivery Service Financial Model Excel Template
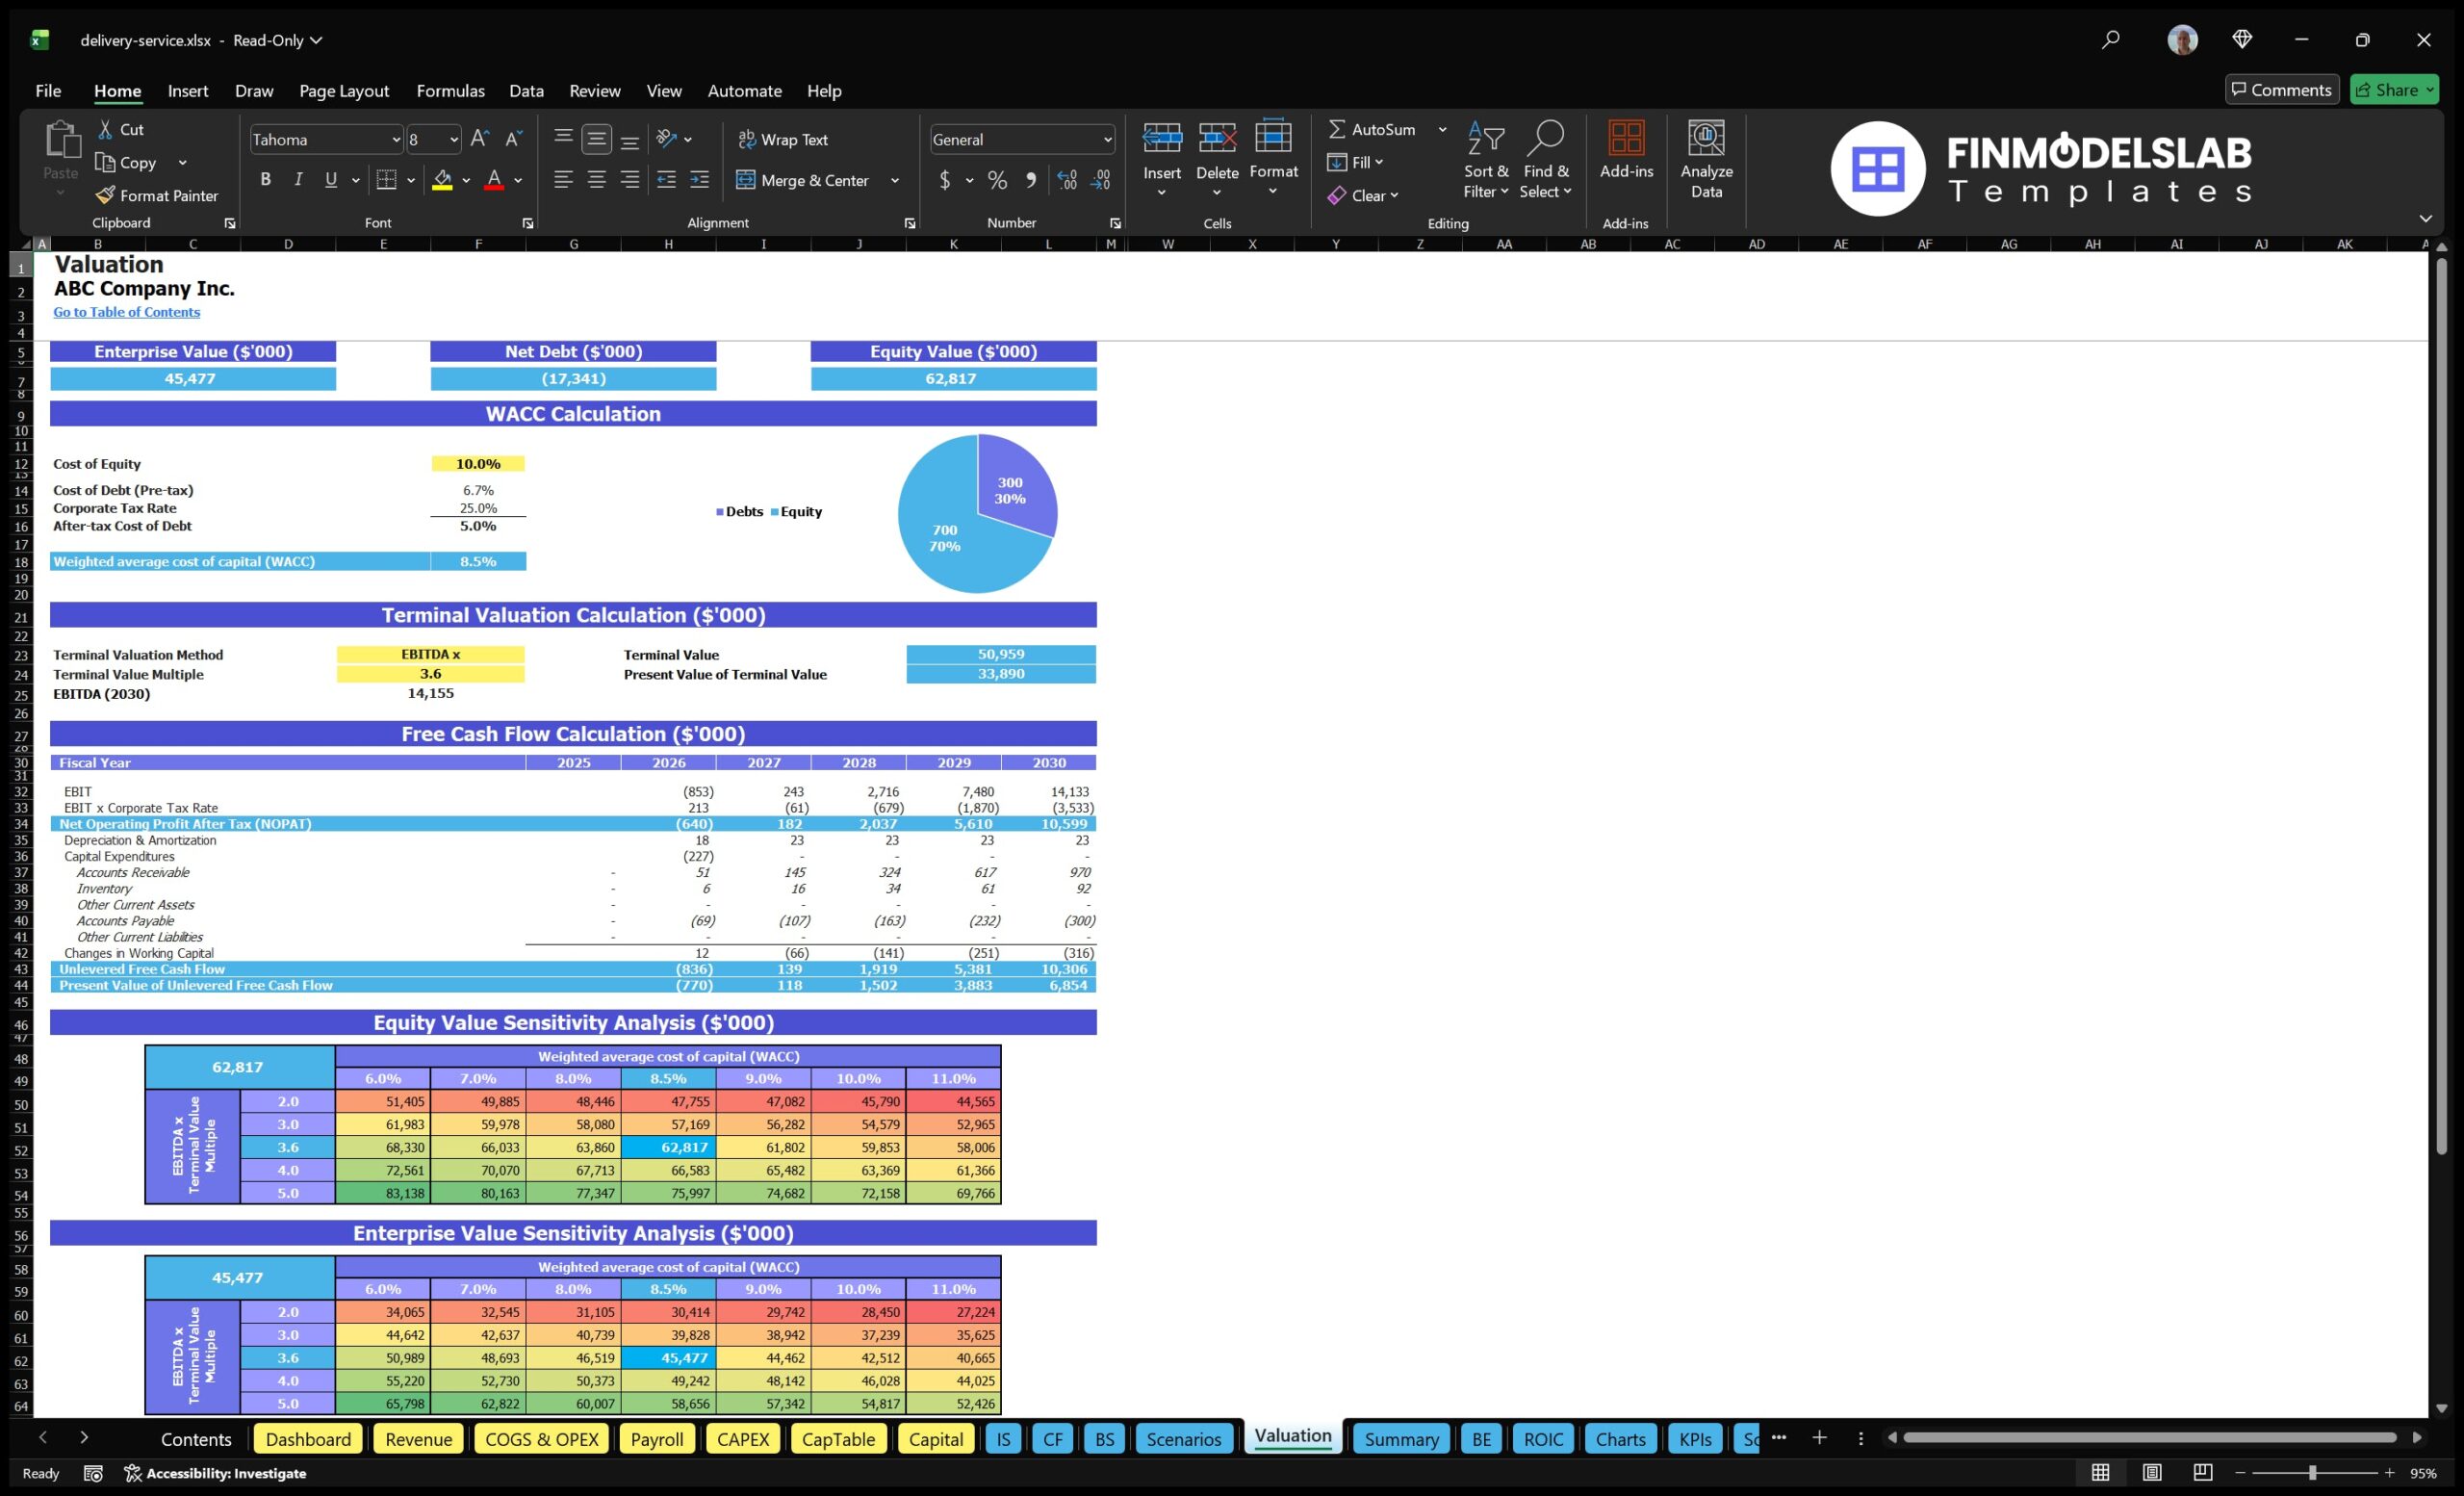
The Delivery Service Financial Model Financial Model Template helps founders, operators, consultants, and analysts turn a delivery business idea into a structured five-year financial forecast. Instead of starting with a blank spreadsheet, users can work from an editable model designed around the economics of a delivery platform, courier service, or last-mile logistics operation. The template helps organize financial planning around revenue assumptions, order volume, commission rates, subscription income, seller fees, customer acquisition, operating expenses, payroll, startup costs, and cash flow so the business can be evaluated before launch, expansion, fundraising, or strategic decision-making. This template is especially useful for entrepreneurs preparing a business plan, founders seeking investment, business owners reviewing growth options, consultants building client forecasts, and finance teams preparing budgets or lender-ready documents. It allows users to enter their own assumptions and see how those inputs flow through revenue projections, expense forecasts, profit and loss statements, cash flow projections, balance sheet outputs, break-even timing, and key performance indicators. By connecting commercial assumptions with financial outputs, the model helps users understand whether the delivery service can scale profitably and what level of funding may be required to support early-stage losses. The model is designed to reflect the practical realities of a delivery service business, where revenue growth depends on order frequency, average order value, customer acquisition, seller participation, subscription plans, and service fees, while costs may include staff salaries, marketing spend, software, infrastructure, delivery operations, office setup, technology tools, and administrative overhead. Users can adjust assumptions for different scenarios, compare low, base, and high cases, review profitability drivers, and evaluate how changes in pricing, user growth, or cost structure affect long-term performance. With built-in dashboards, visual charts, financial statements, KPI tracking, and investor-ready reports, the Delivery Service Financial Model supports both internal planning and external presentations. It helps users identify cash flow pressure points, estimate startup funding needs, monitor profitability, calculate break-even timing, and make more informed decisions about hiring, marketing, pricing, expansion, and capital raising. The template is fully customizable and ready to use in Excel or Google Sheets, making it a practical tool for building a credible delivery service forecast without hiring a consultant or building a model from scratch.
Financial Model Overview
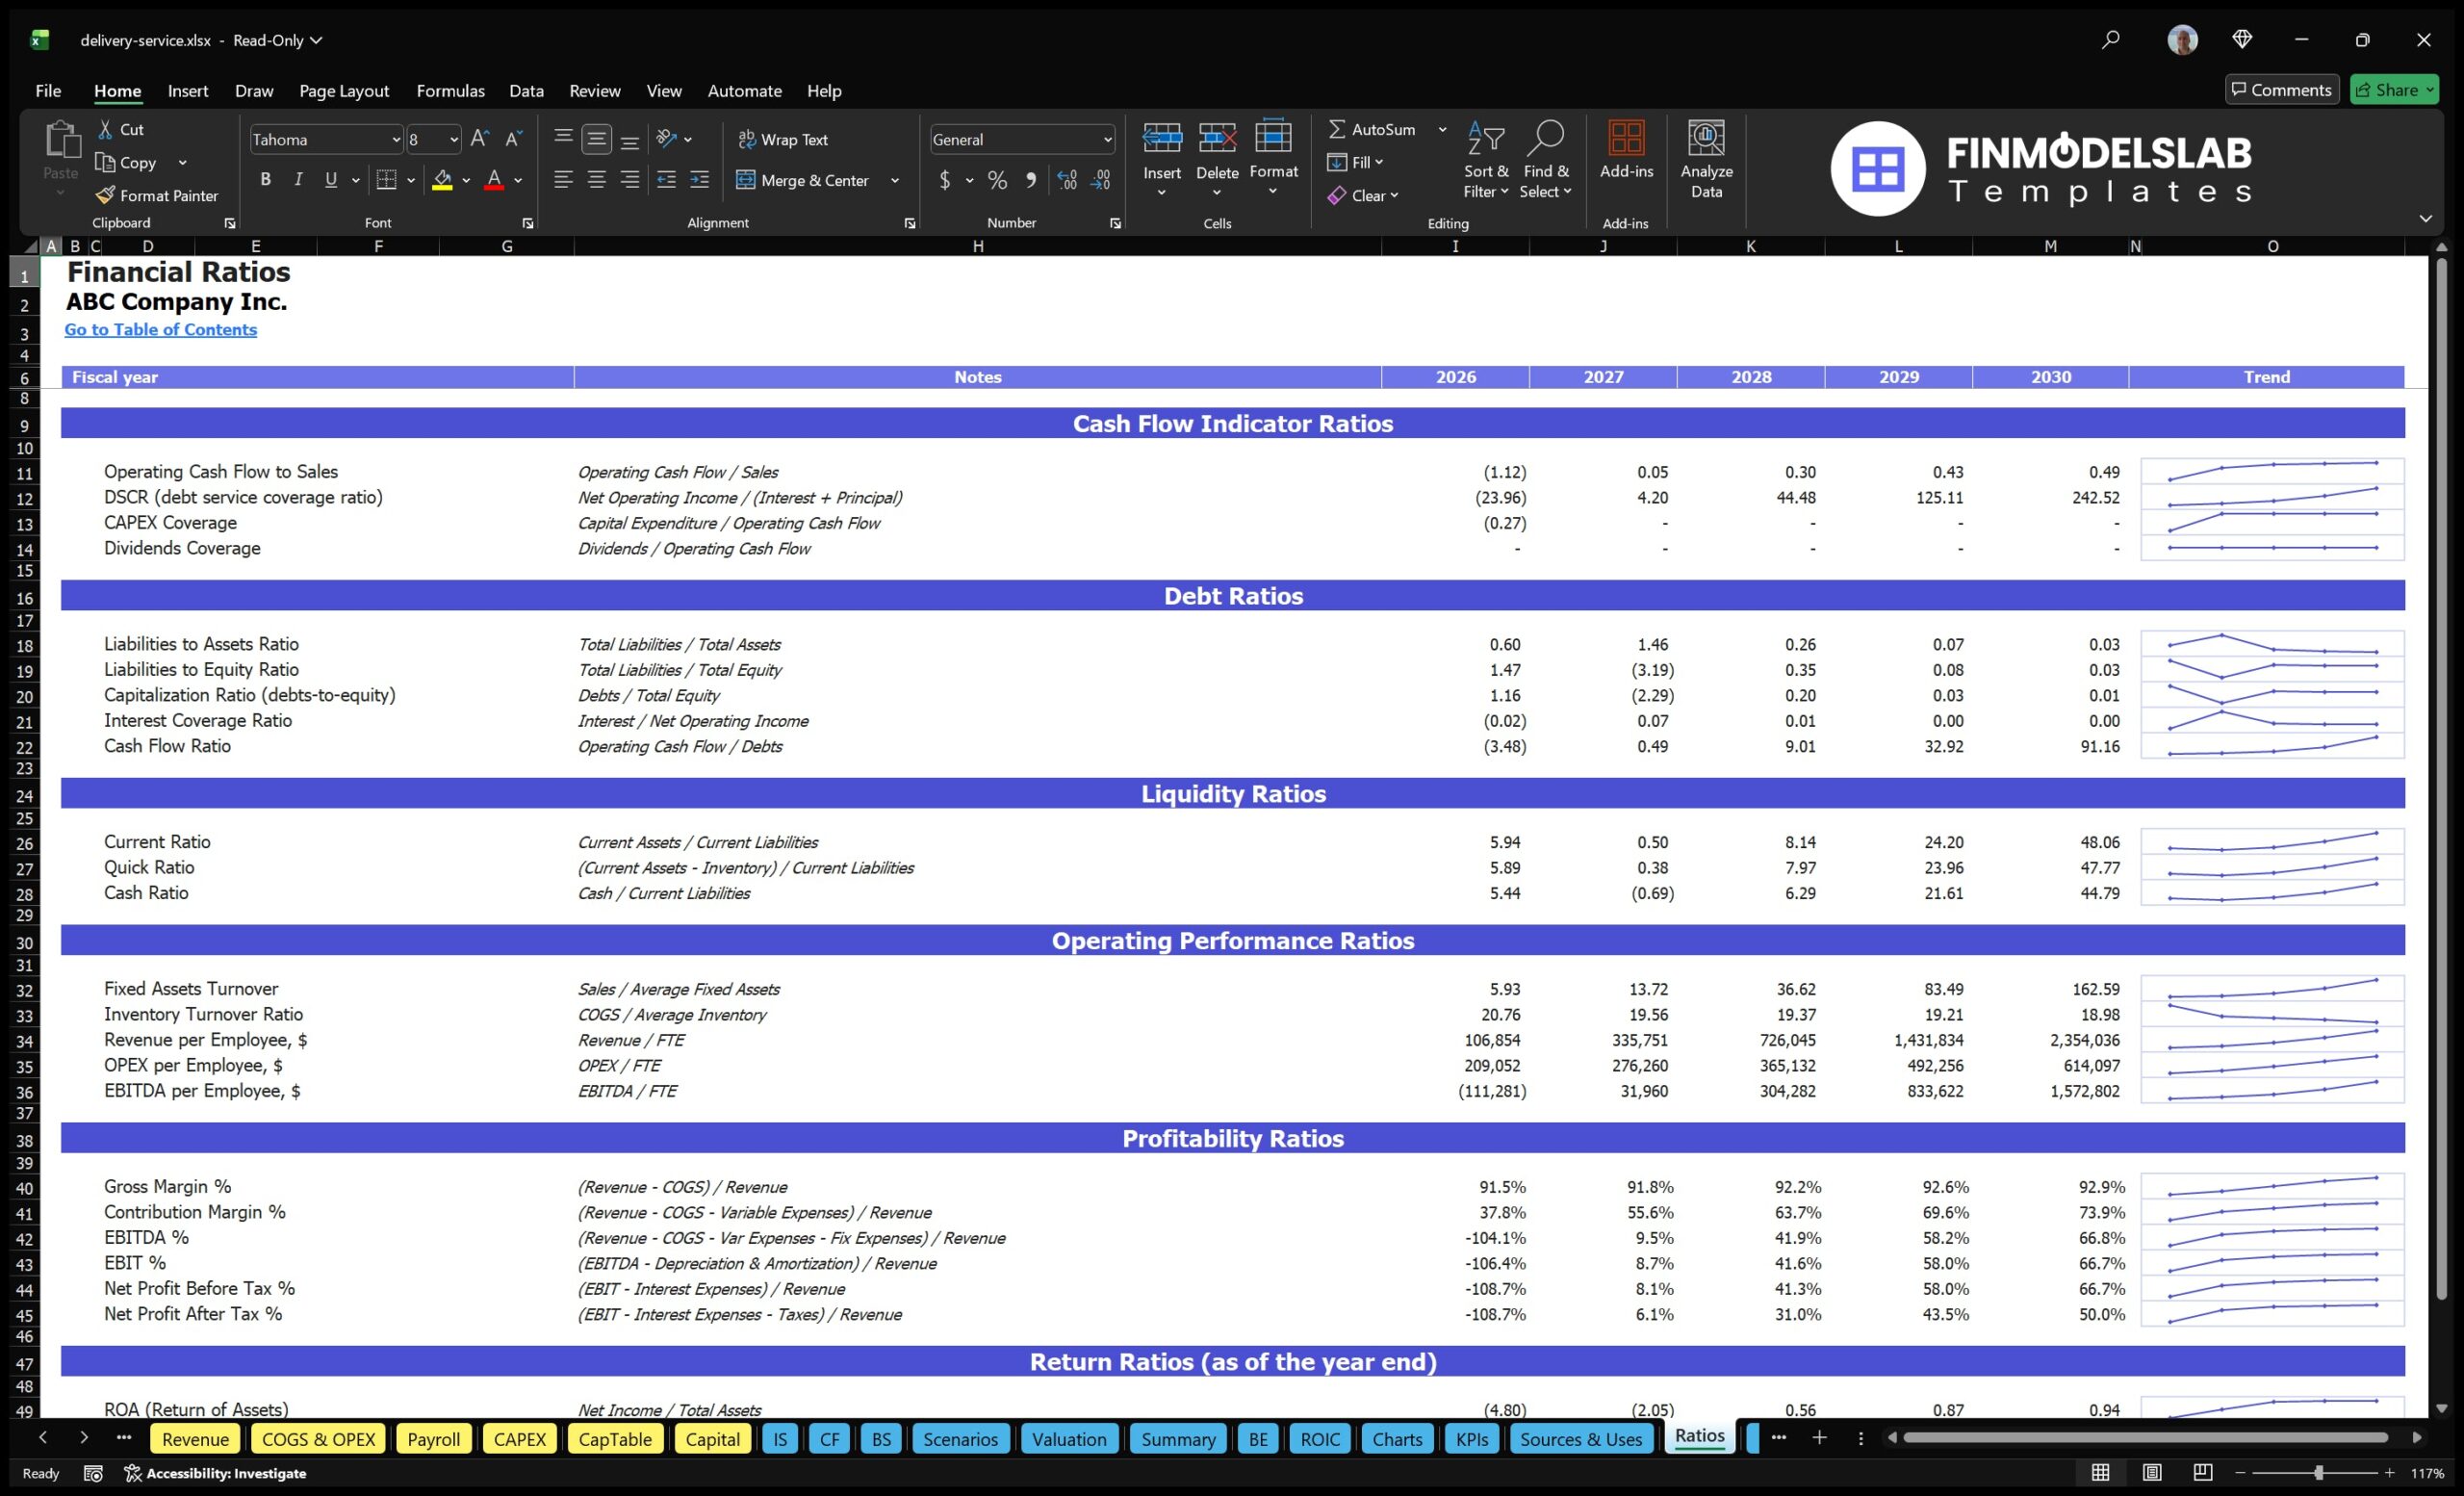
The Delivery Service Financial Model Financial Model Template gives entrepreneurs, business owners, consultants, and analysts a structured way to forecast the financial performance of a delivery service, courier platform, or last-mile logistics business. It is designed to help users move from business concept to actionable financial plan by connecting revenue assumptions, startup investment, operating costs, payroll, cash flow, profitability, and funding needs in one editable model. A delivery service often has several moving parts, including customer acquisition, seller or merchant onboarding, order frequency, average order value, commission rates, subscription plans, delivery-related costs, platform infrastructure, and staff hiring. This template brings those assumptions together so users can test whether the business can grow, reach break-even, manage early cash burn, and generate sustainable profit over a five-year forecast period. It is useful for business planning, investor presentations, bank discussions, internal budgeting, scenario testing, and strategic decision-making because it turns key operational assumptions into clear financial outputs that can be reviewed, updated, and shared.
All-in-One Dashboard
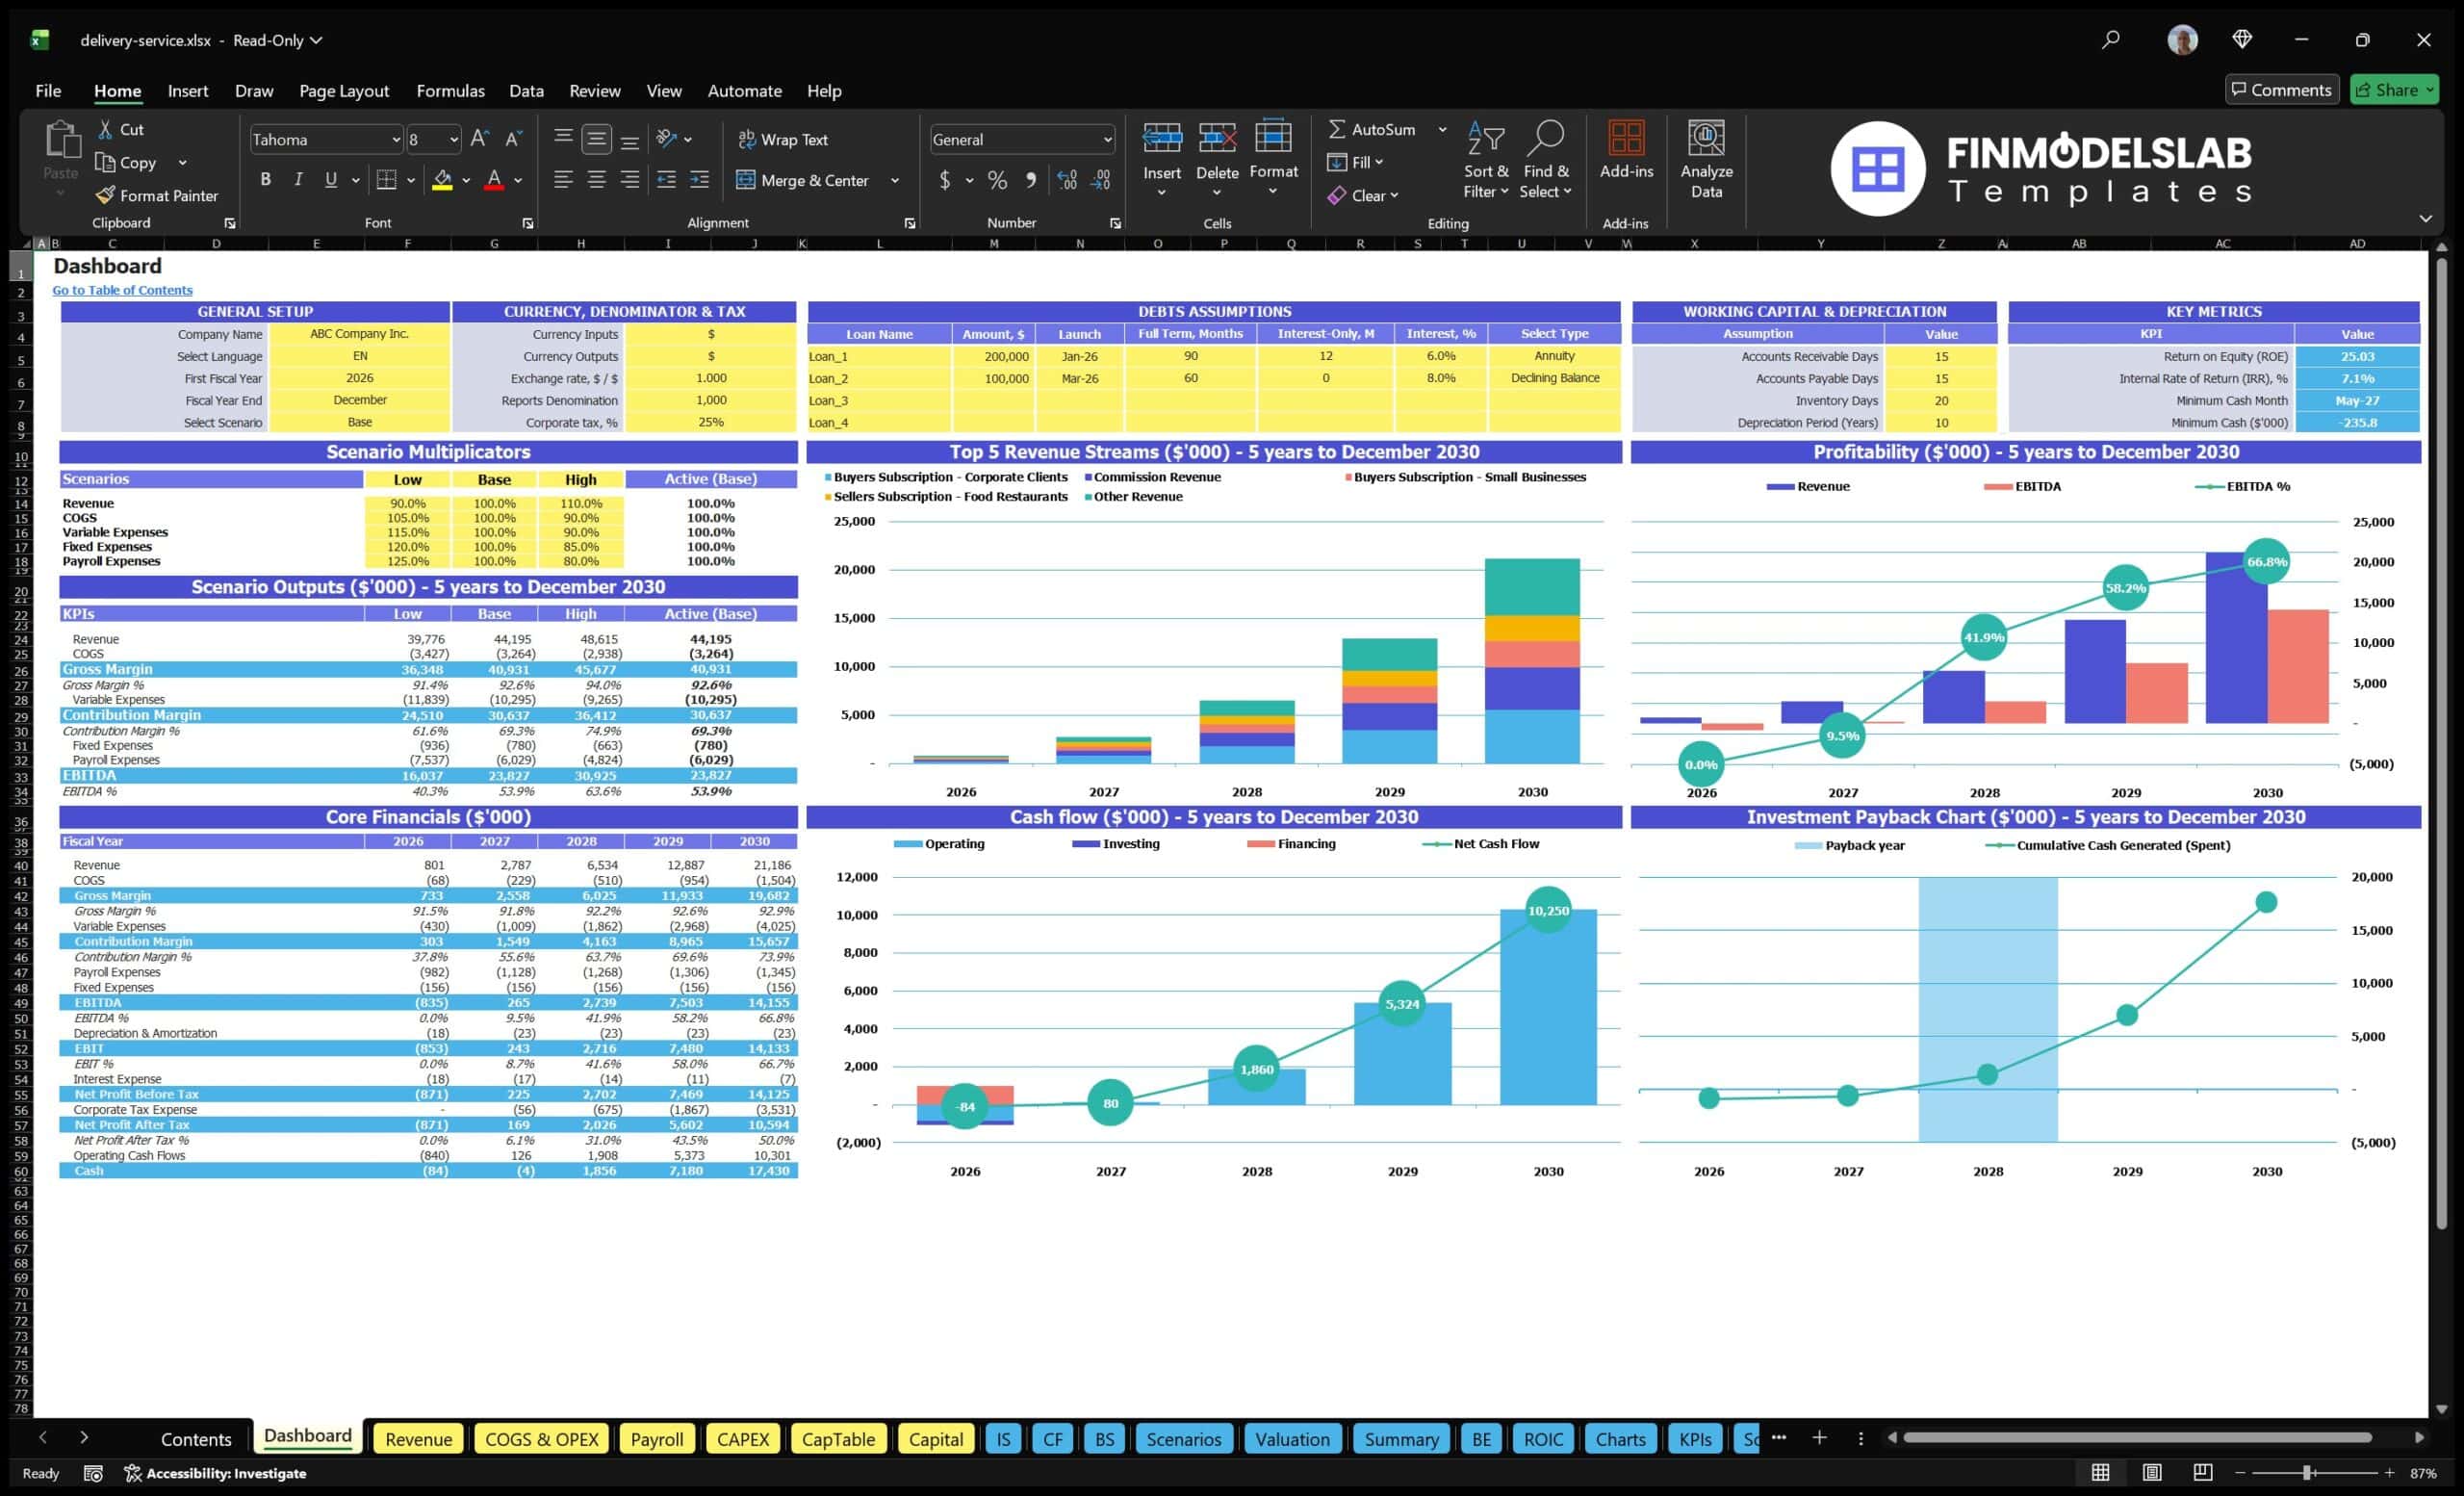
The all-in-one dashboard gives users a central view of the most important inputs and outputs in the Delivery Service Financial Model. Instead of searching through multiple tabs to understand the business forecast, users can quickly review high-level financial metrics, growth assumptions, revenue results, expense trends, cash flow movement, profitability, and key decision points from one consolidated area. For a delivery service, this is especially useful because performance depends on several connected drivers, such as active users, order volume, average order value, commission take rate, subscription fees, seller extras, marketing spend, staffing levels, and infrastructure costs. The dashboard helps translate these moving parts into a more digestible management view, making it easier to evaluate whether the current assumptions support a viable business model. Users can adjust inputs in the model and see how the financial story changes across revenue, profit, cash position, and funding requirements. This component is valuable for founders preparing for investor meetings, operators monitoring business performance, and consultants presenting financial scenarios to clients because it provides a clean, professional snapshot of the delivery service forecast.
Low/Base/High Scenario Analysis
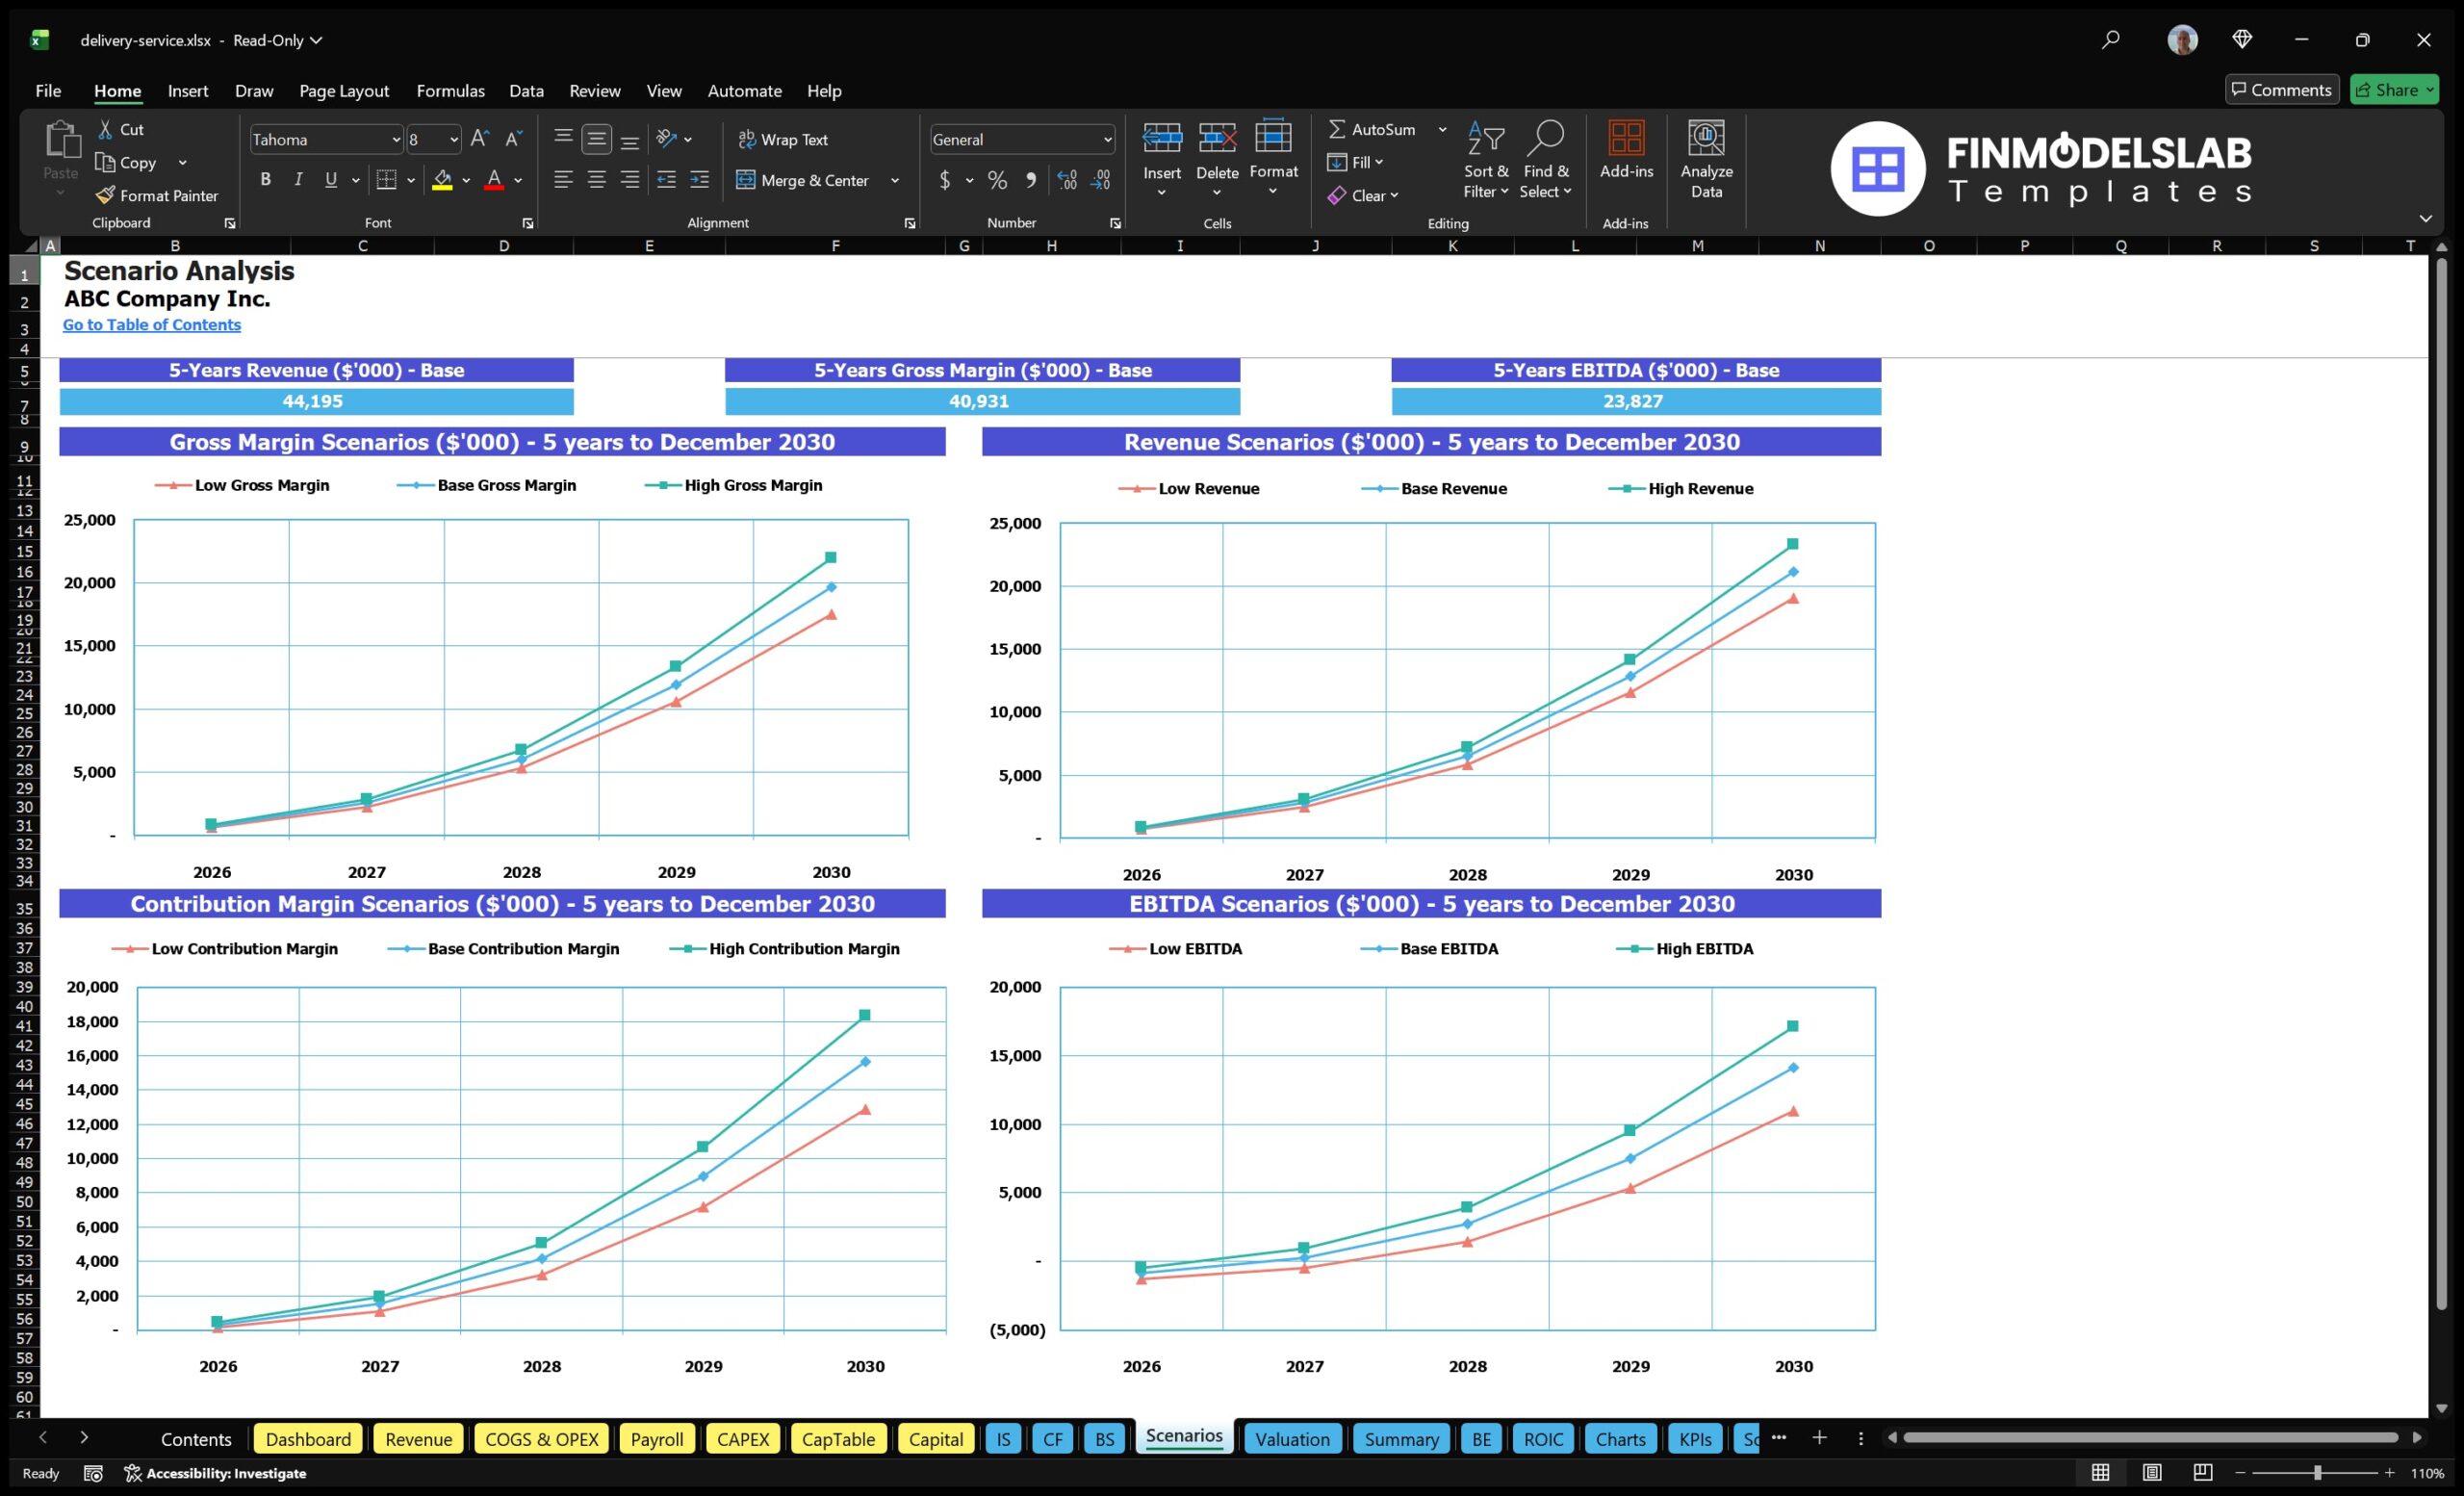
The low, base, and high scenario analysis component allows users to compare different versions of the delivery service forecast under changing business conditions. A delivery business can perform very differently depending on customer acquisition cost, order density, seller participation, pricing, average order value, commission percentage, marketing efficiency, retention, and payroll timing. This section helps users test conservative, expected, and optimistic cases without rebuilding the financial model from scratch. In a low case, users may assume slower user growth, lower order frequency, weaker subscription adoption, or higher operating costs. In a base case, they can use the most realistic planning assumptions. In a high case, they can evaluate the upside from stronger demand, better unit economics, improved courier efficiency, or faster market expansion. The output helps users understand risk, funding needs, cash flow pressure, and profitability under multiple conditions. This is useful for investor discussions because stakeholders often want to see how resilient the business is if growth takes longer than expected or costs run higher than planned. It also supports better internal decision-making by showing which assumptions have the greatest impact on long-term results.
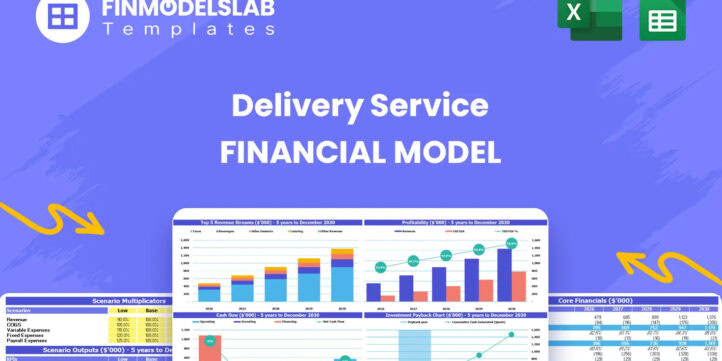
Professional Charts
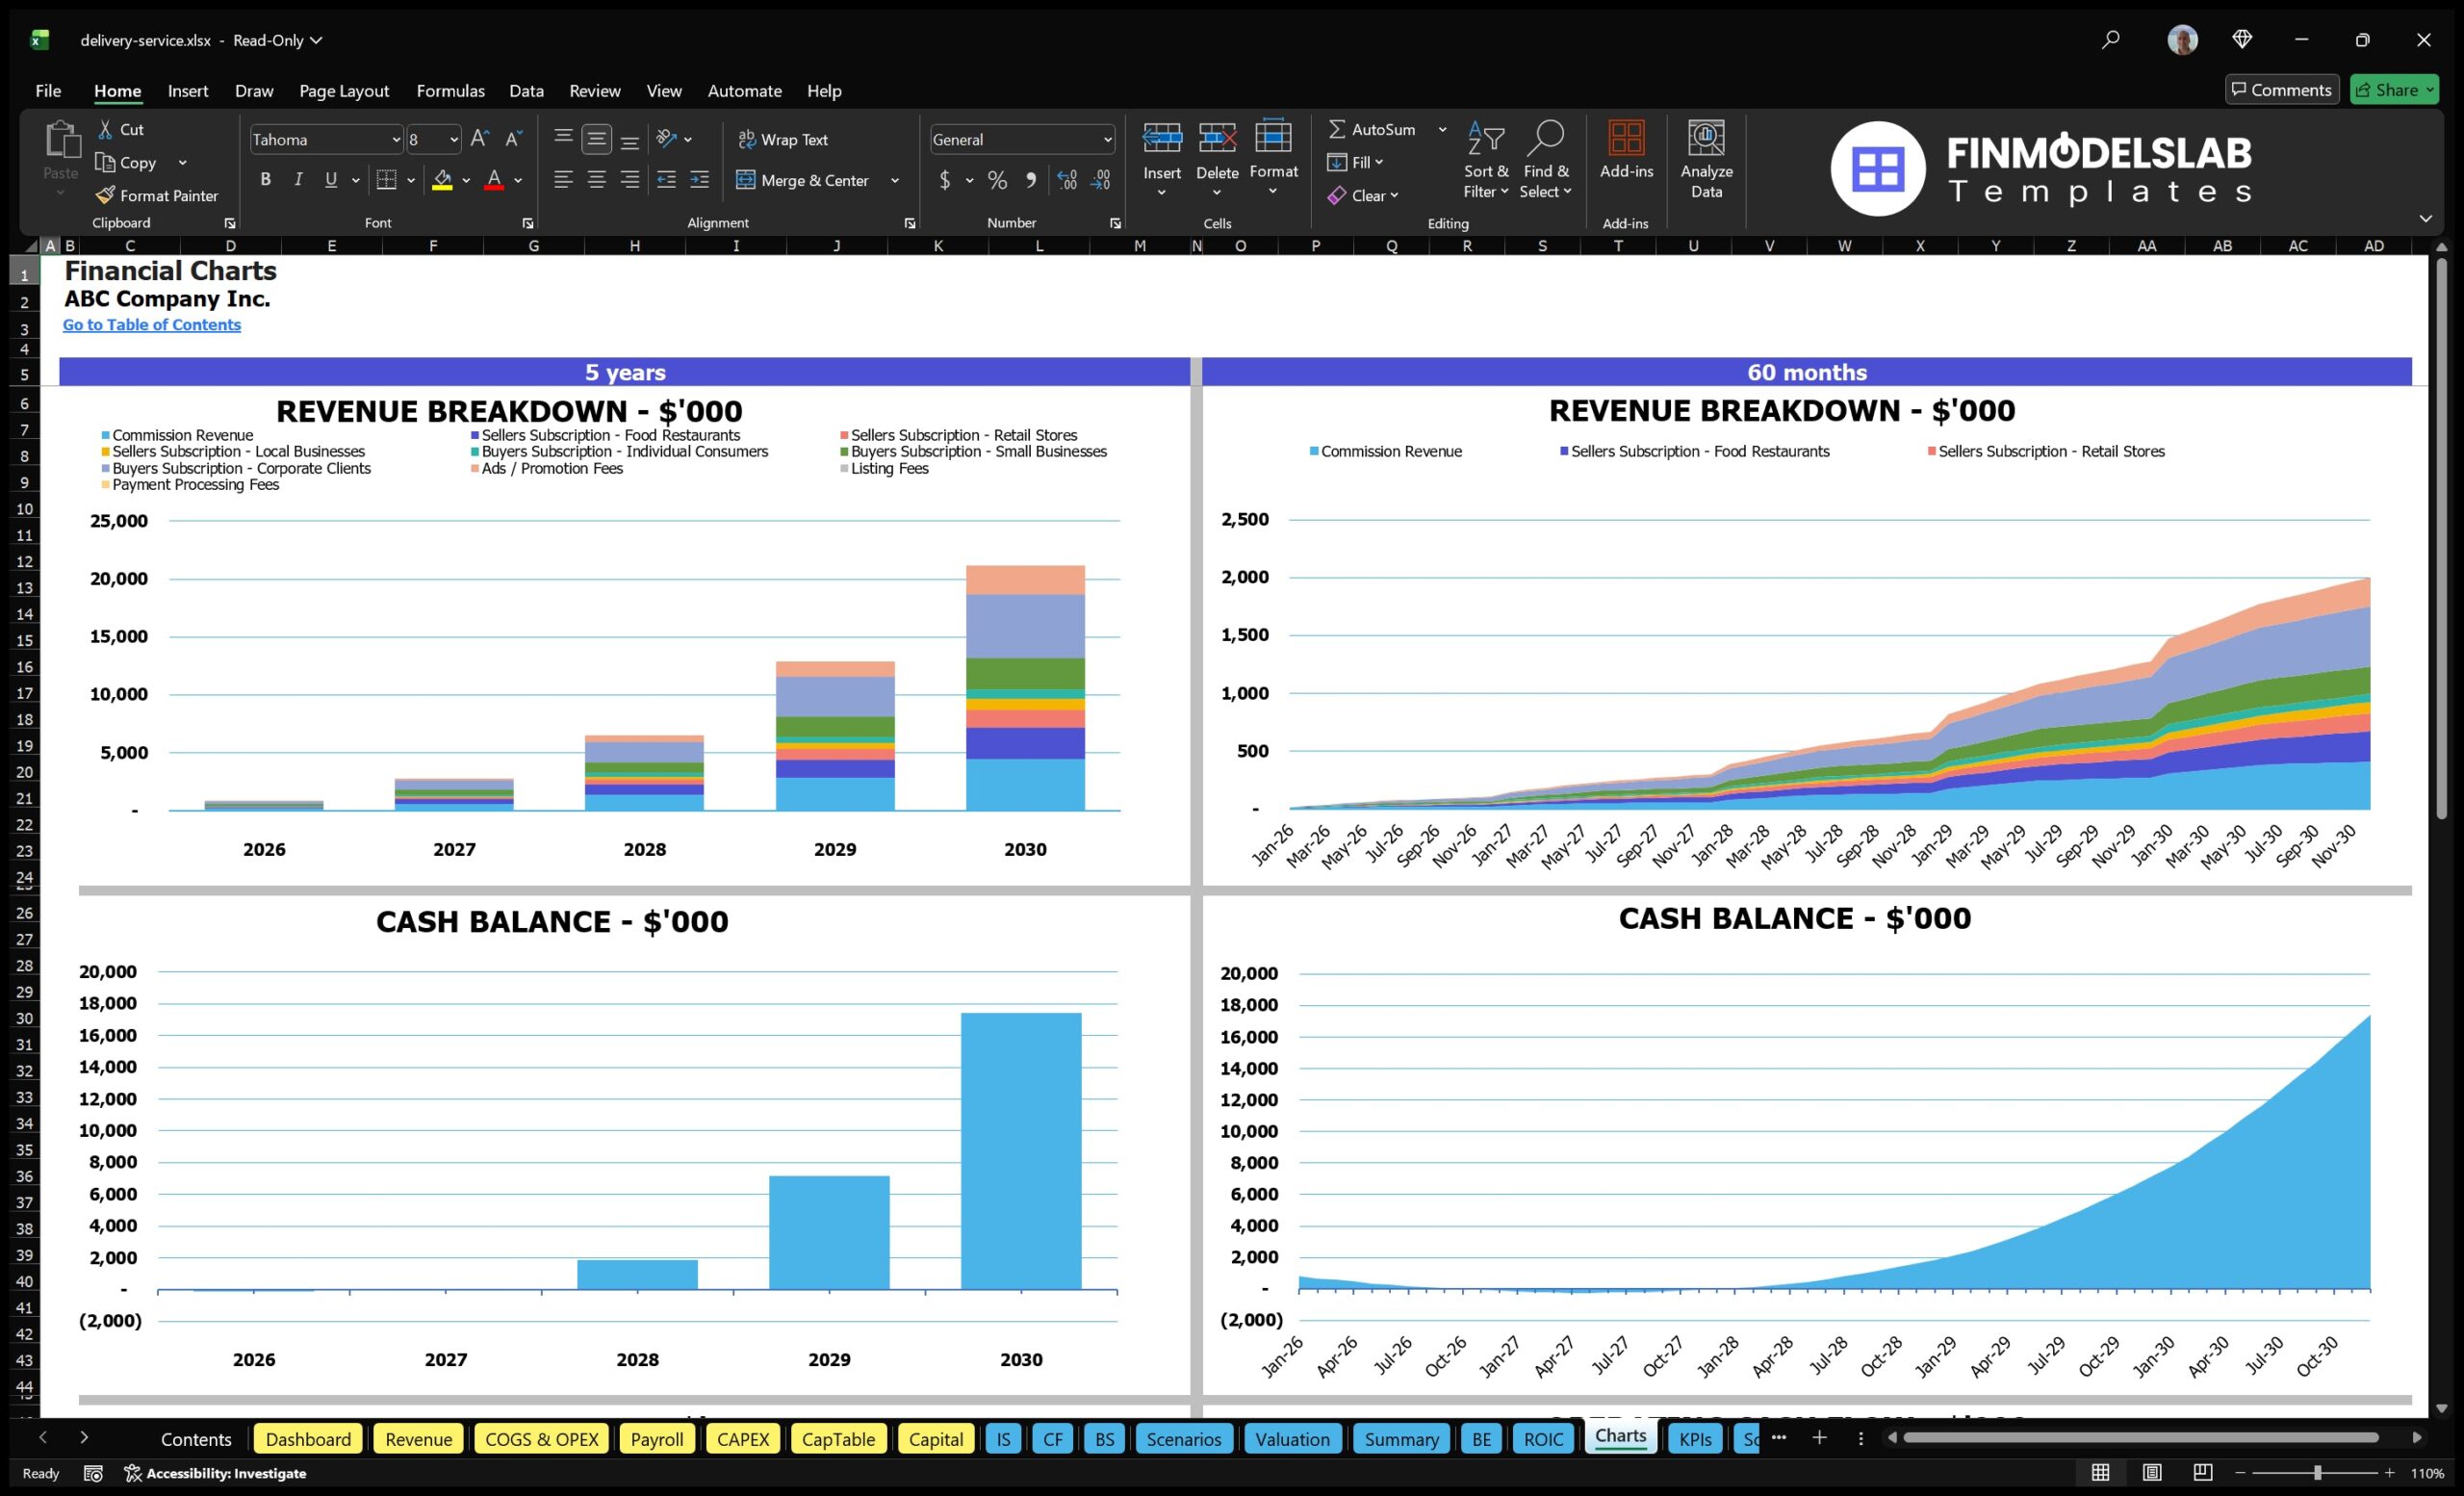
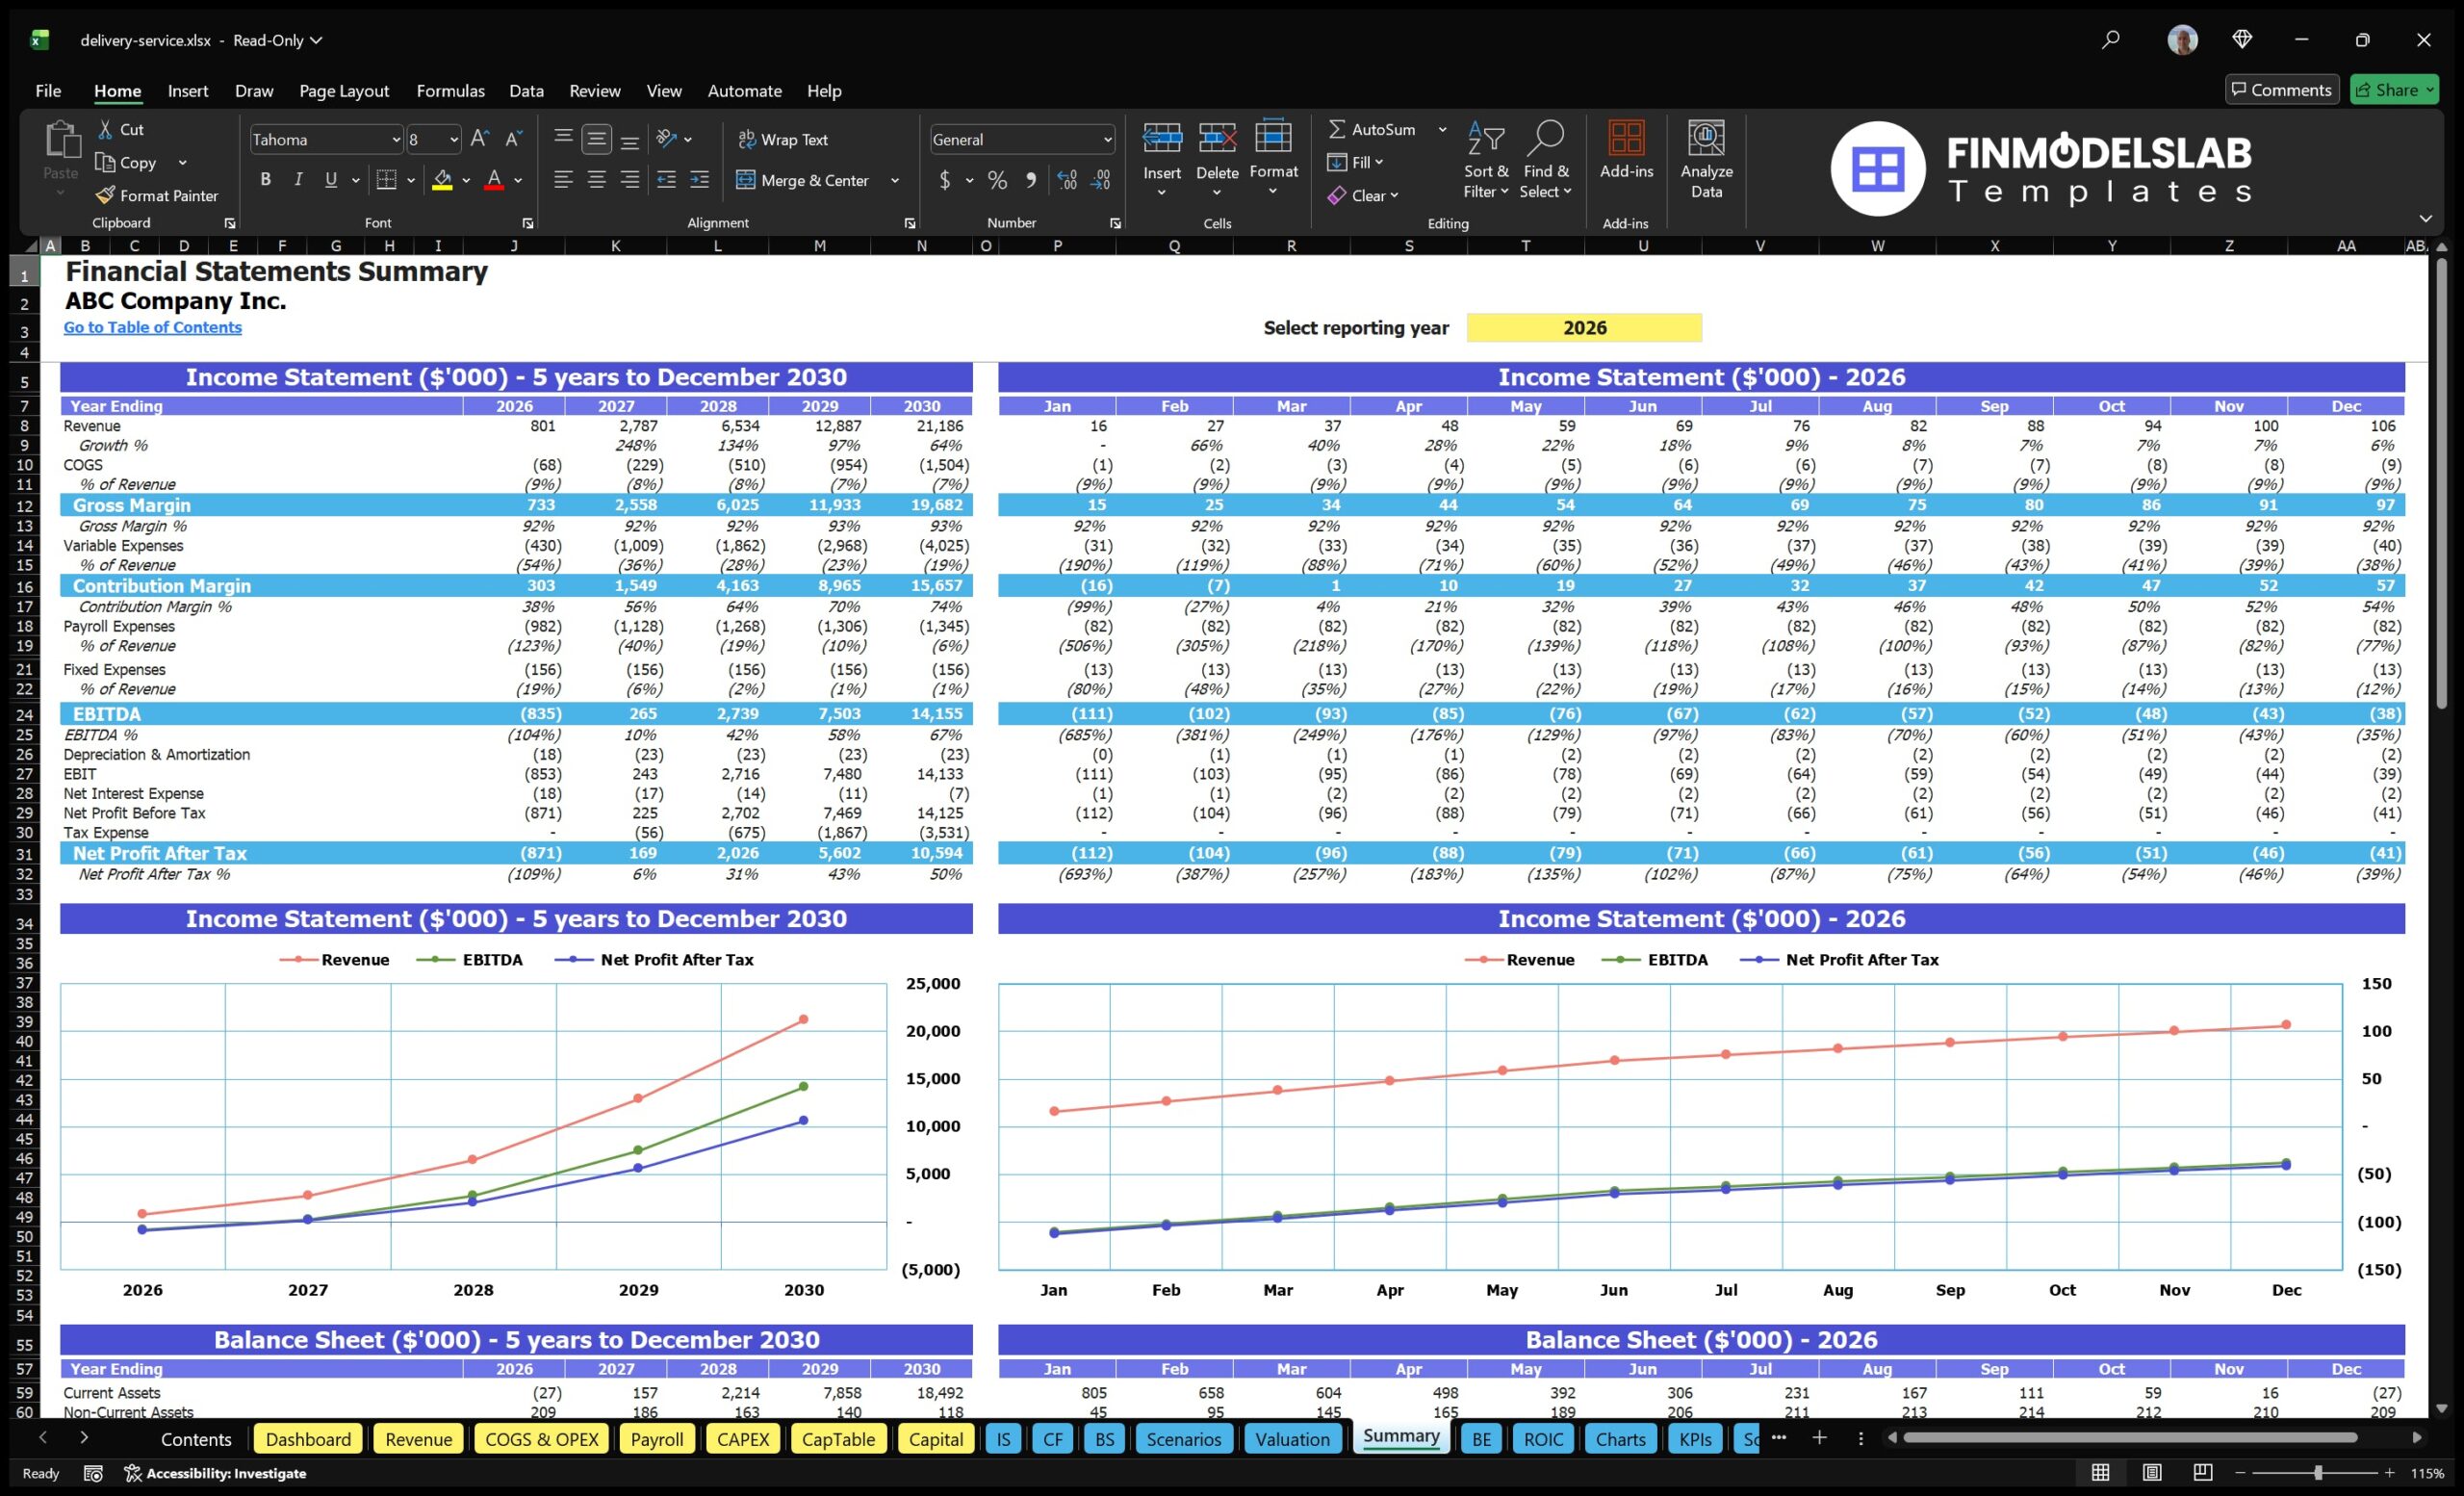
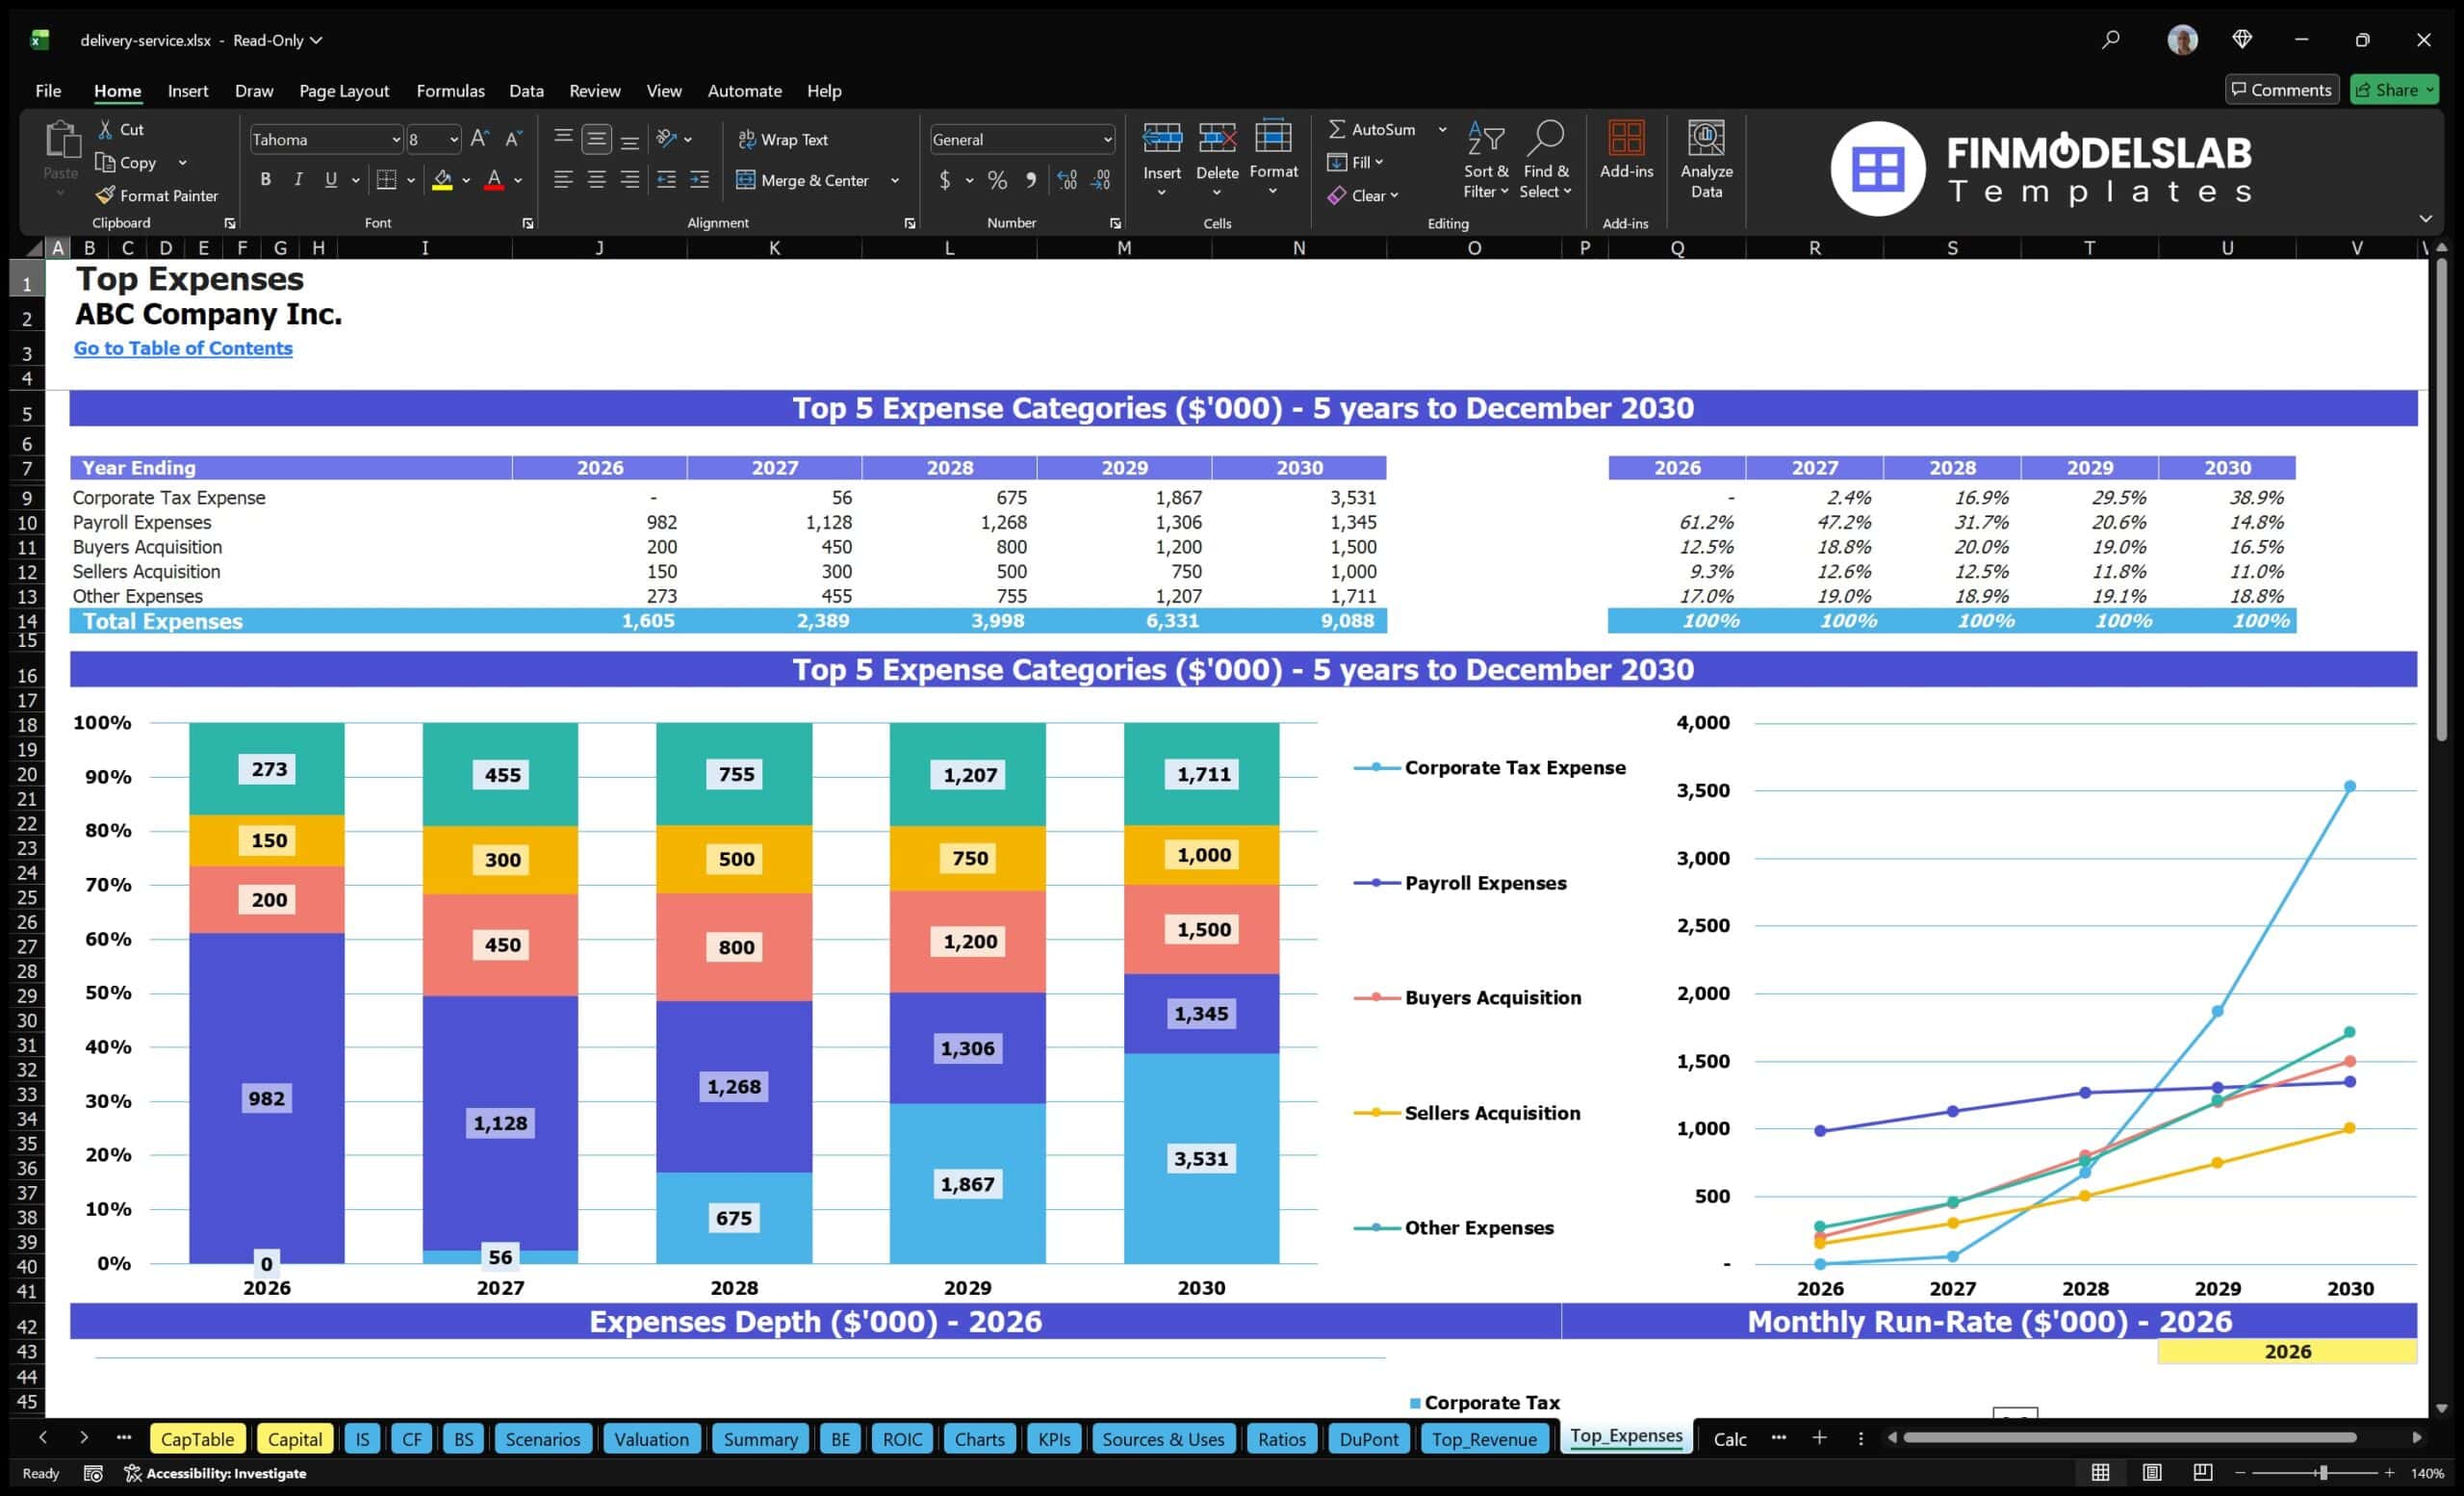
The professional charts component turns the financial projections into visual outputs that are easier to interpret, present, and discuss. Delivery service forecasts can include many detailed calculations, including revenue by stream, operating expenses, payroll, cash flow, EBITDA, net profit, funding needs, and growth trends. Charts help make these outputs more accessible by showing the direction and scale of the business over time. Users can use the visual reports to identify revenue growth patterns, expense pressure, profitability milestones, cash balance trends, and performance changes across the forecast period. This is particularly helpful when preparing investor presentations, lender packages, management updates, board materials, or business plan documents because visuals can communicate the financial story faster than rows of numbers alone. The charts are also useful for spotting issues, such as revenue growth that does not keep pace with staffing costs, marketing spend that creates a delayed payback, or a cash shortfall before the business reaches break-even. By giving users presentation-ready visuals, this component improves the clarity and professionalism of the financial model while supporting more confident stakeholder communication.
ROE Components and DuPont Analysis
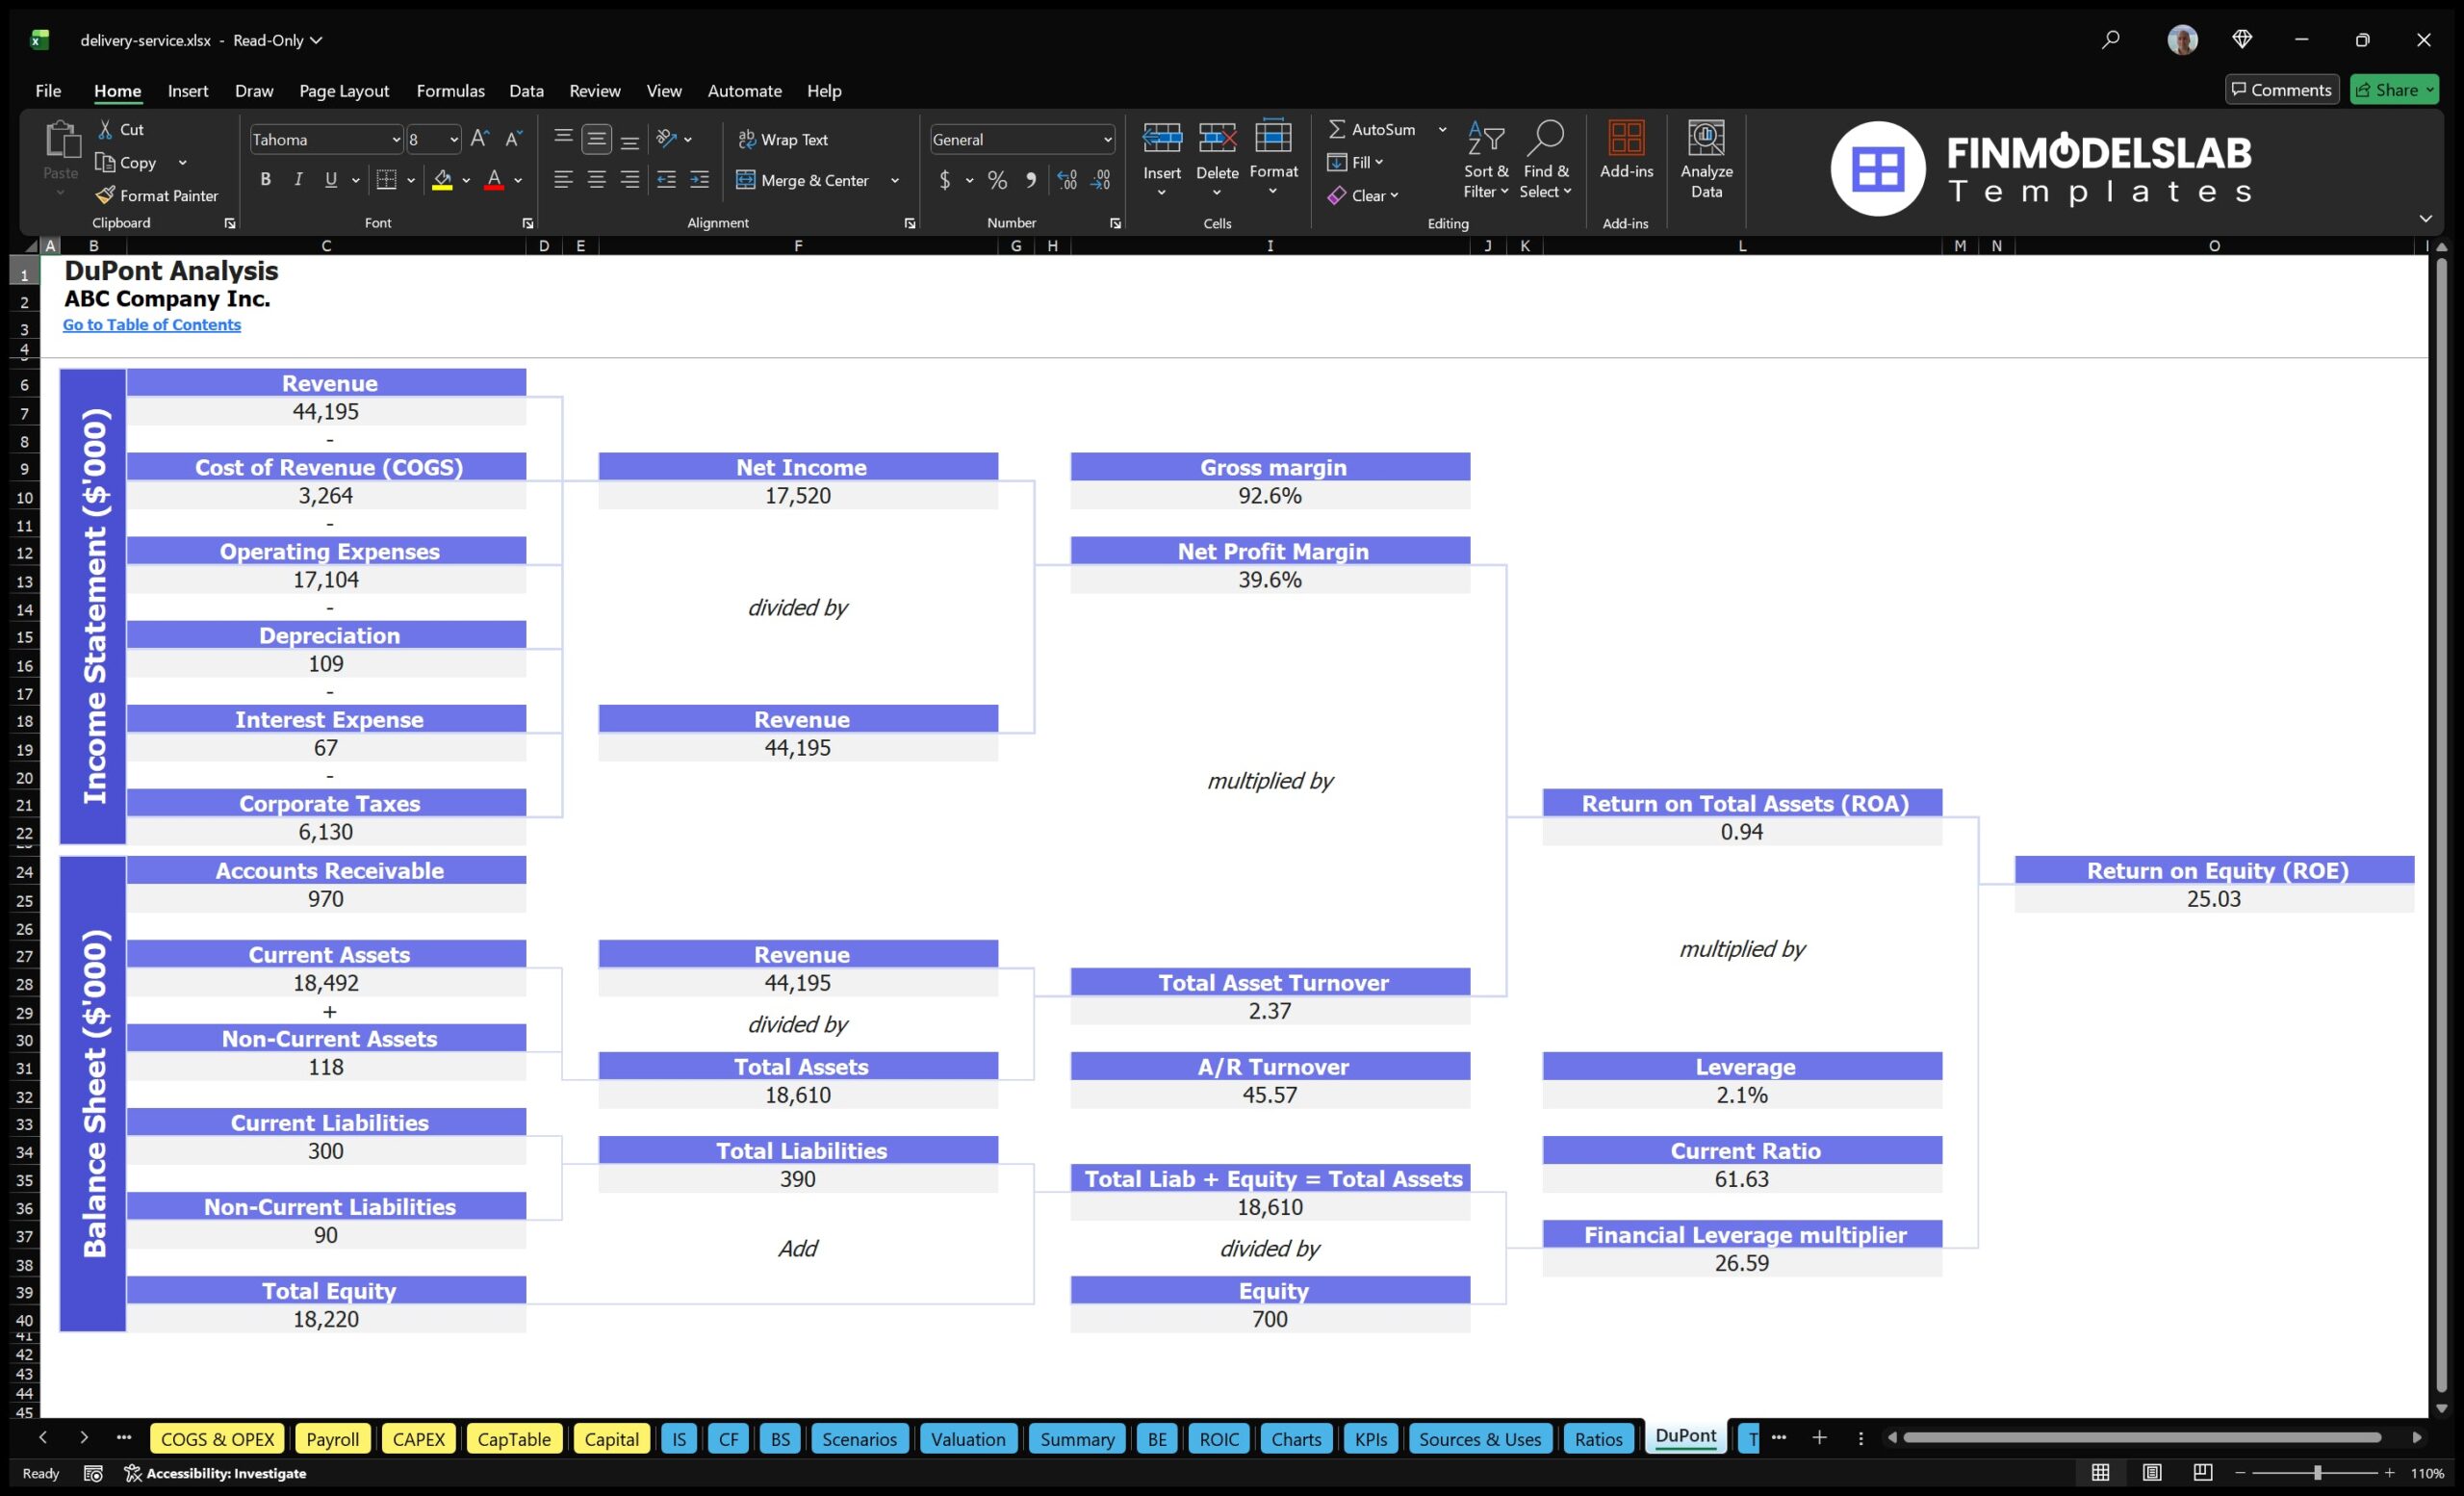
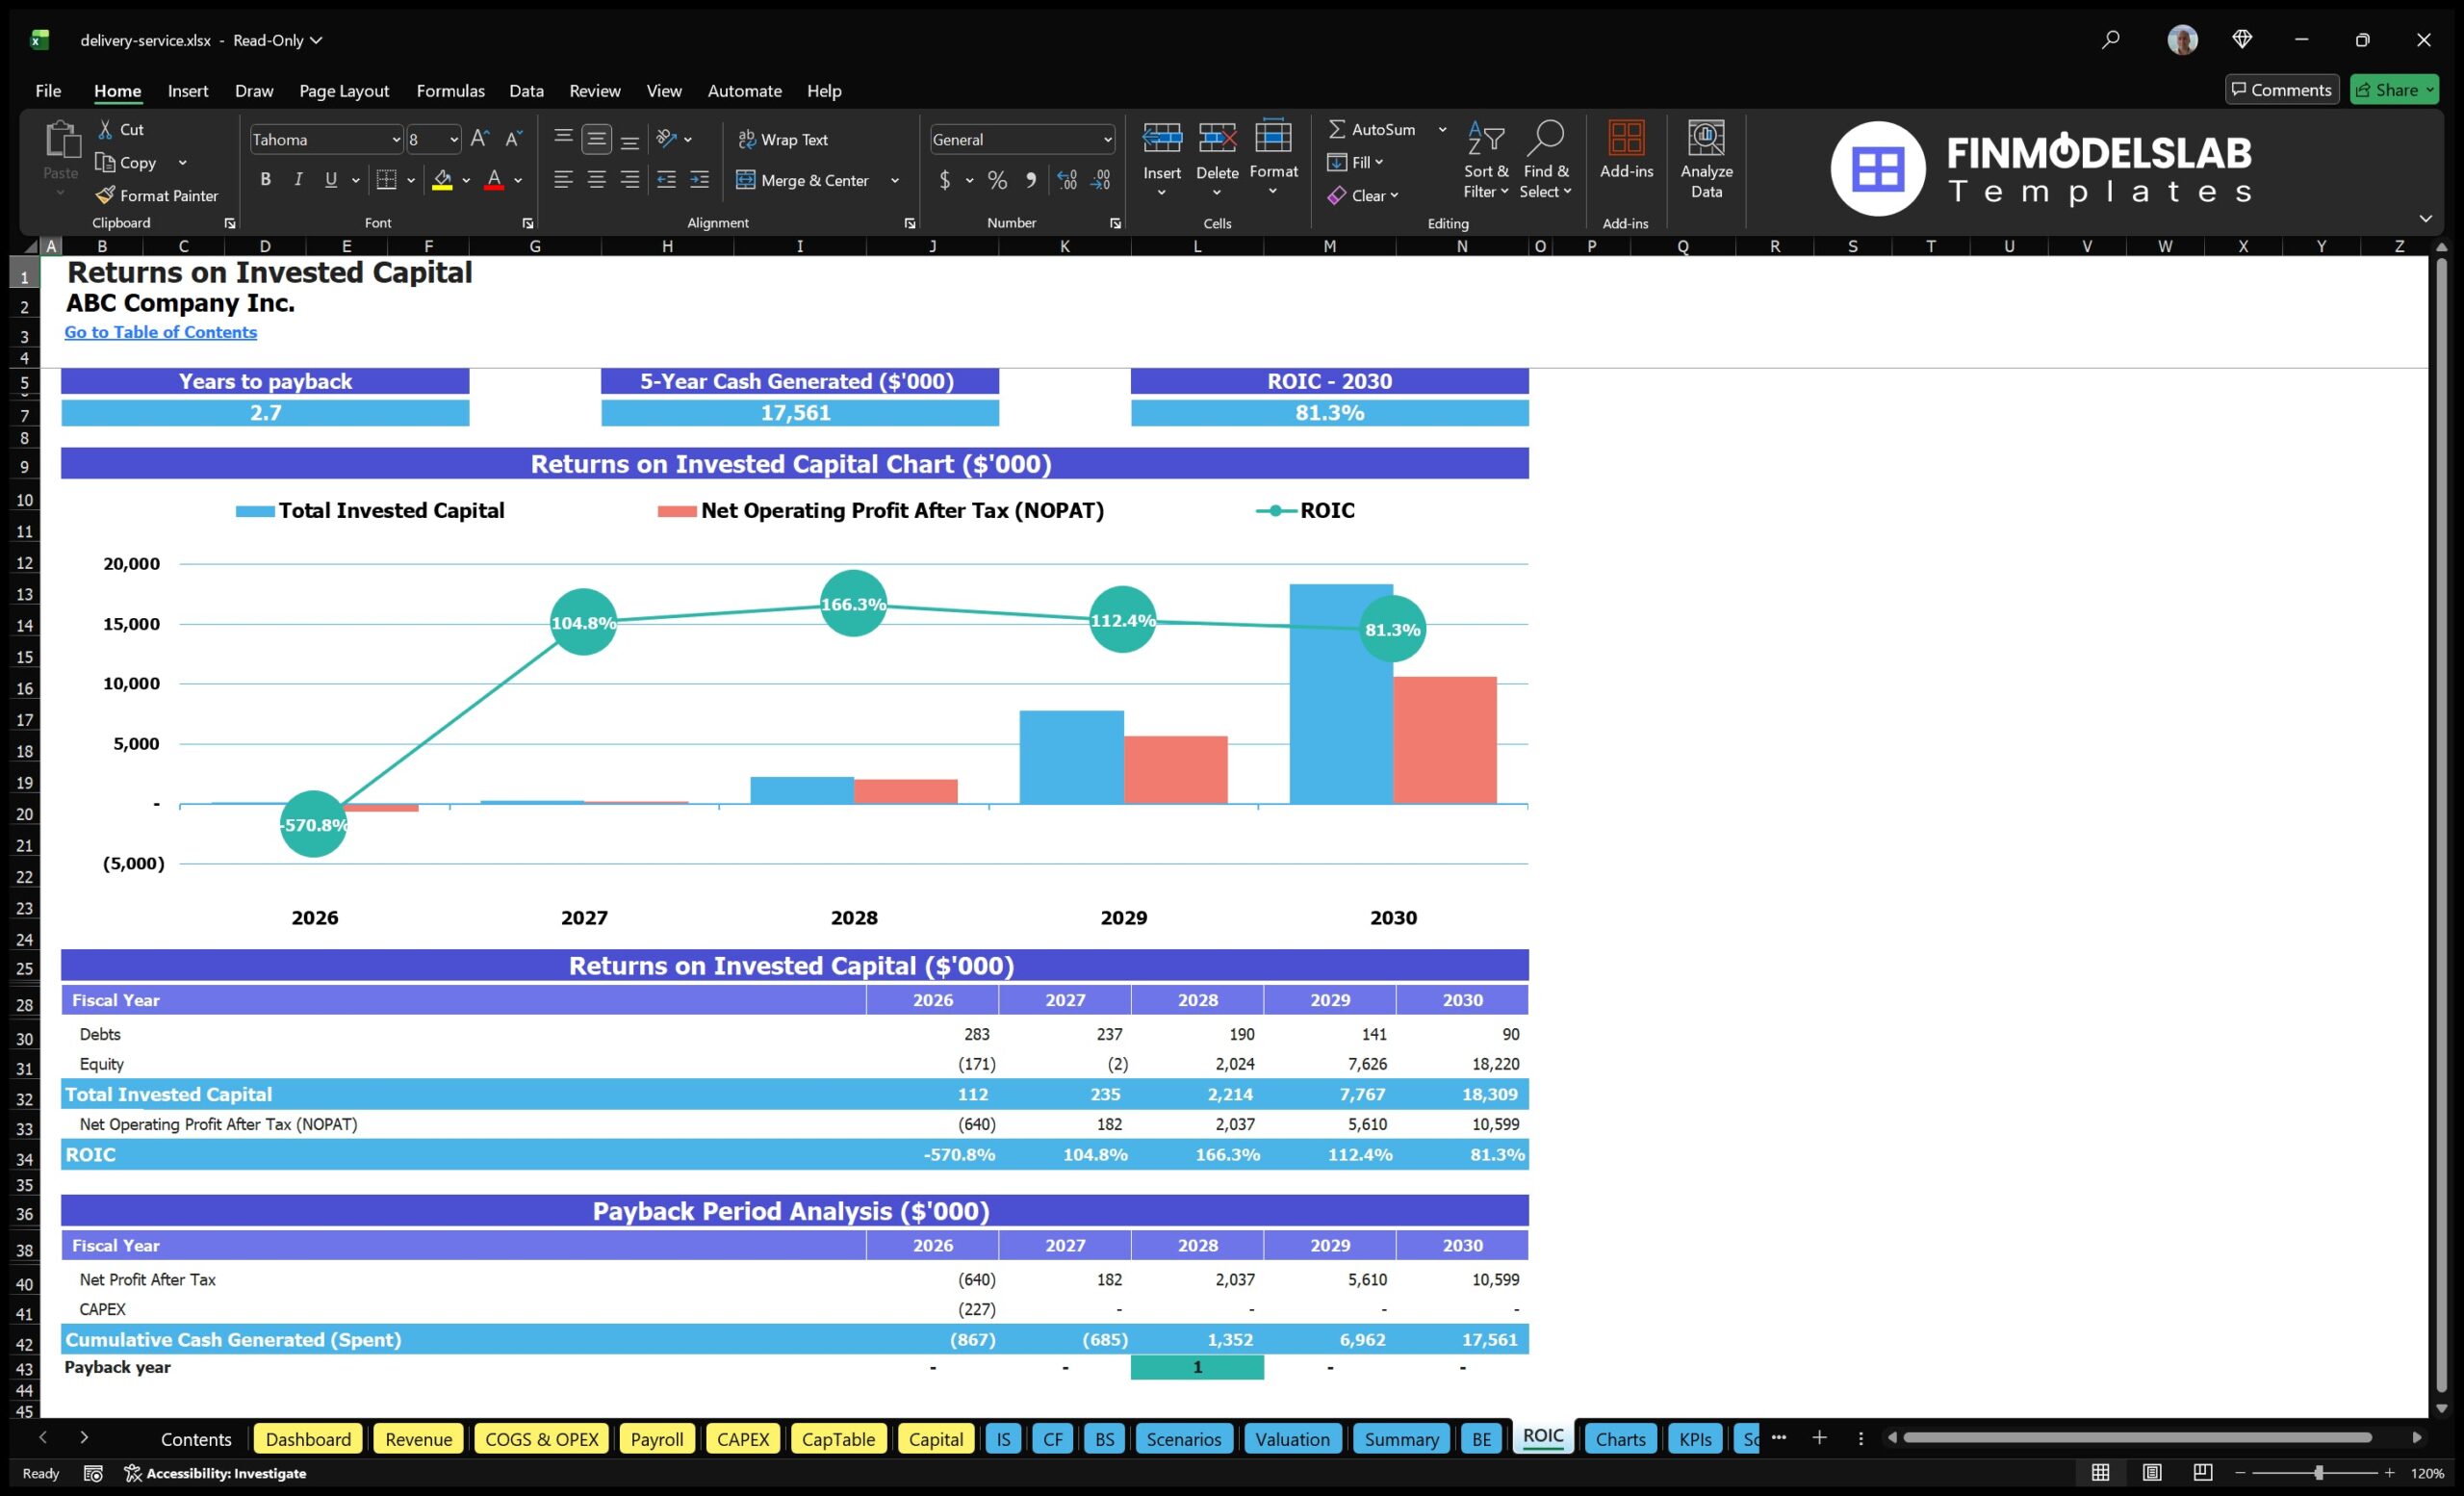
The ROE components section uses DuPont-style analysis to help users understand the deeper drivers behind return on equity rather than viewing profitability as a single summary number. For a delivery service, return on equity can be affected by operating margin, asset efficiency, financing structure, growth investment, and the ability to convert revenue into sustainable profit. This component breaks the return profile into more meaningful parts so users can see whether performance is being driven by margin improvement, better use of invested capital, stronger revenue productivity, or leverage in the business model. Inputs may include net income, revenue, assets, equity, and related financial statement outputs generated elsewhere in the model. The analysis helps founders and investors evaluate whether the delivery service is creating attractive returns relative to the capital invested. It can also highlight weaknesses in the financial structure, such as high operating costs, underutilized assets, or heavy funding requirements that dilute returns. This is valuable for strategic planning, investor due diligence, and long-term capital allocation because it explains not only whether the business becomes profitable, but how efficiently it turns shareholder investment into financial returns.
Revenue Inputs
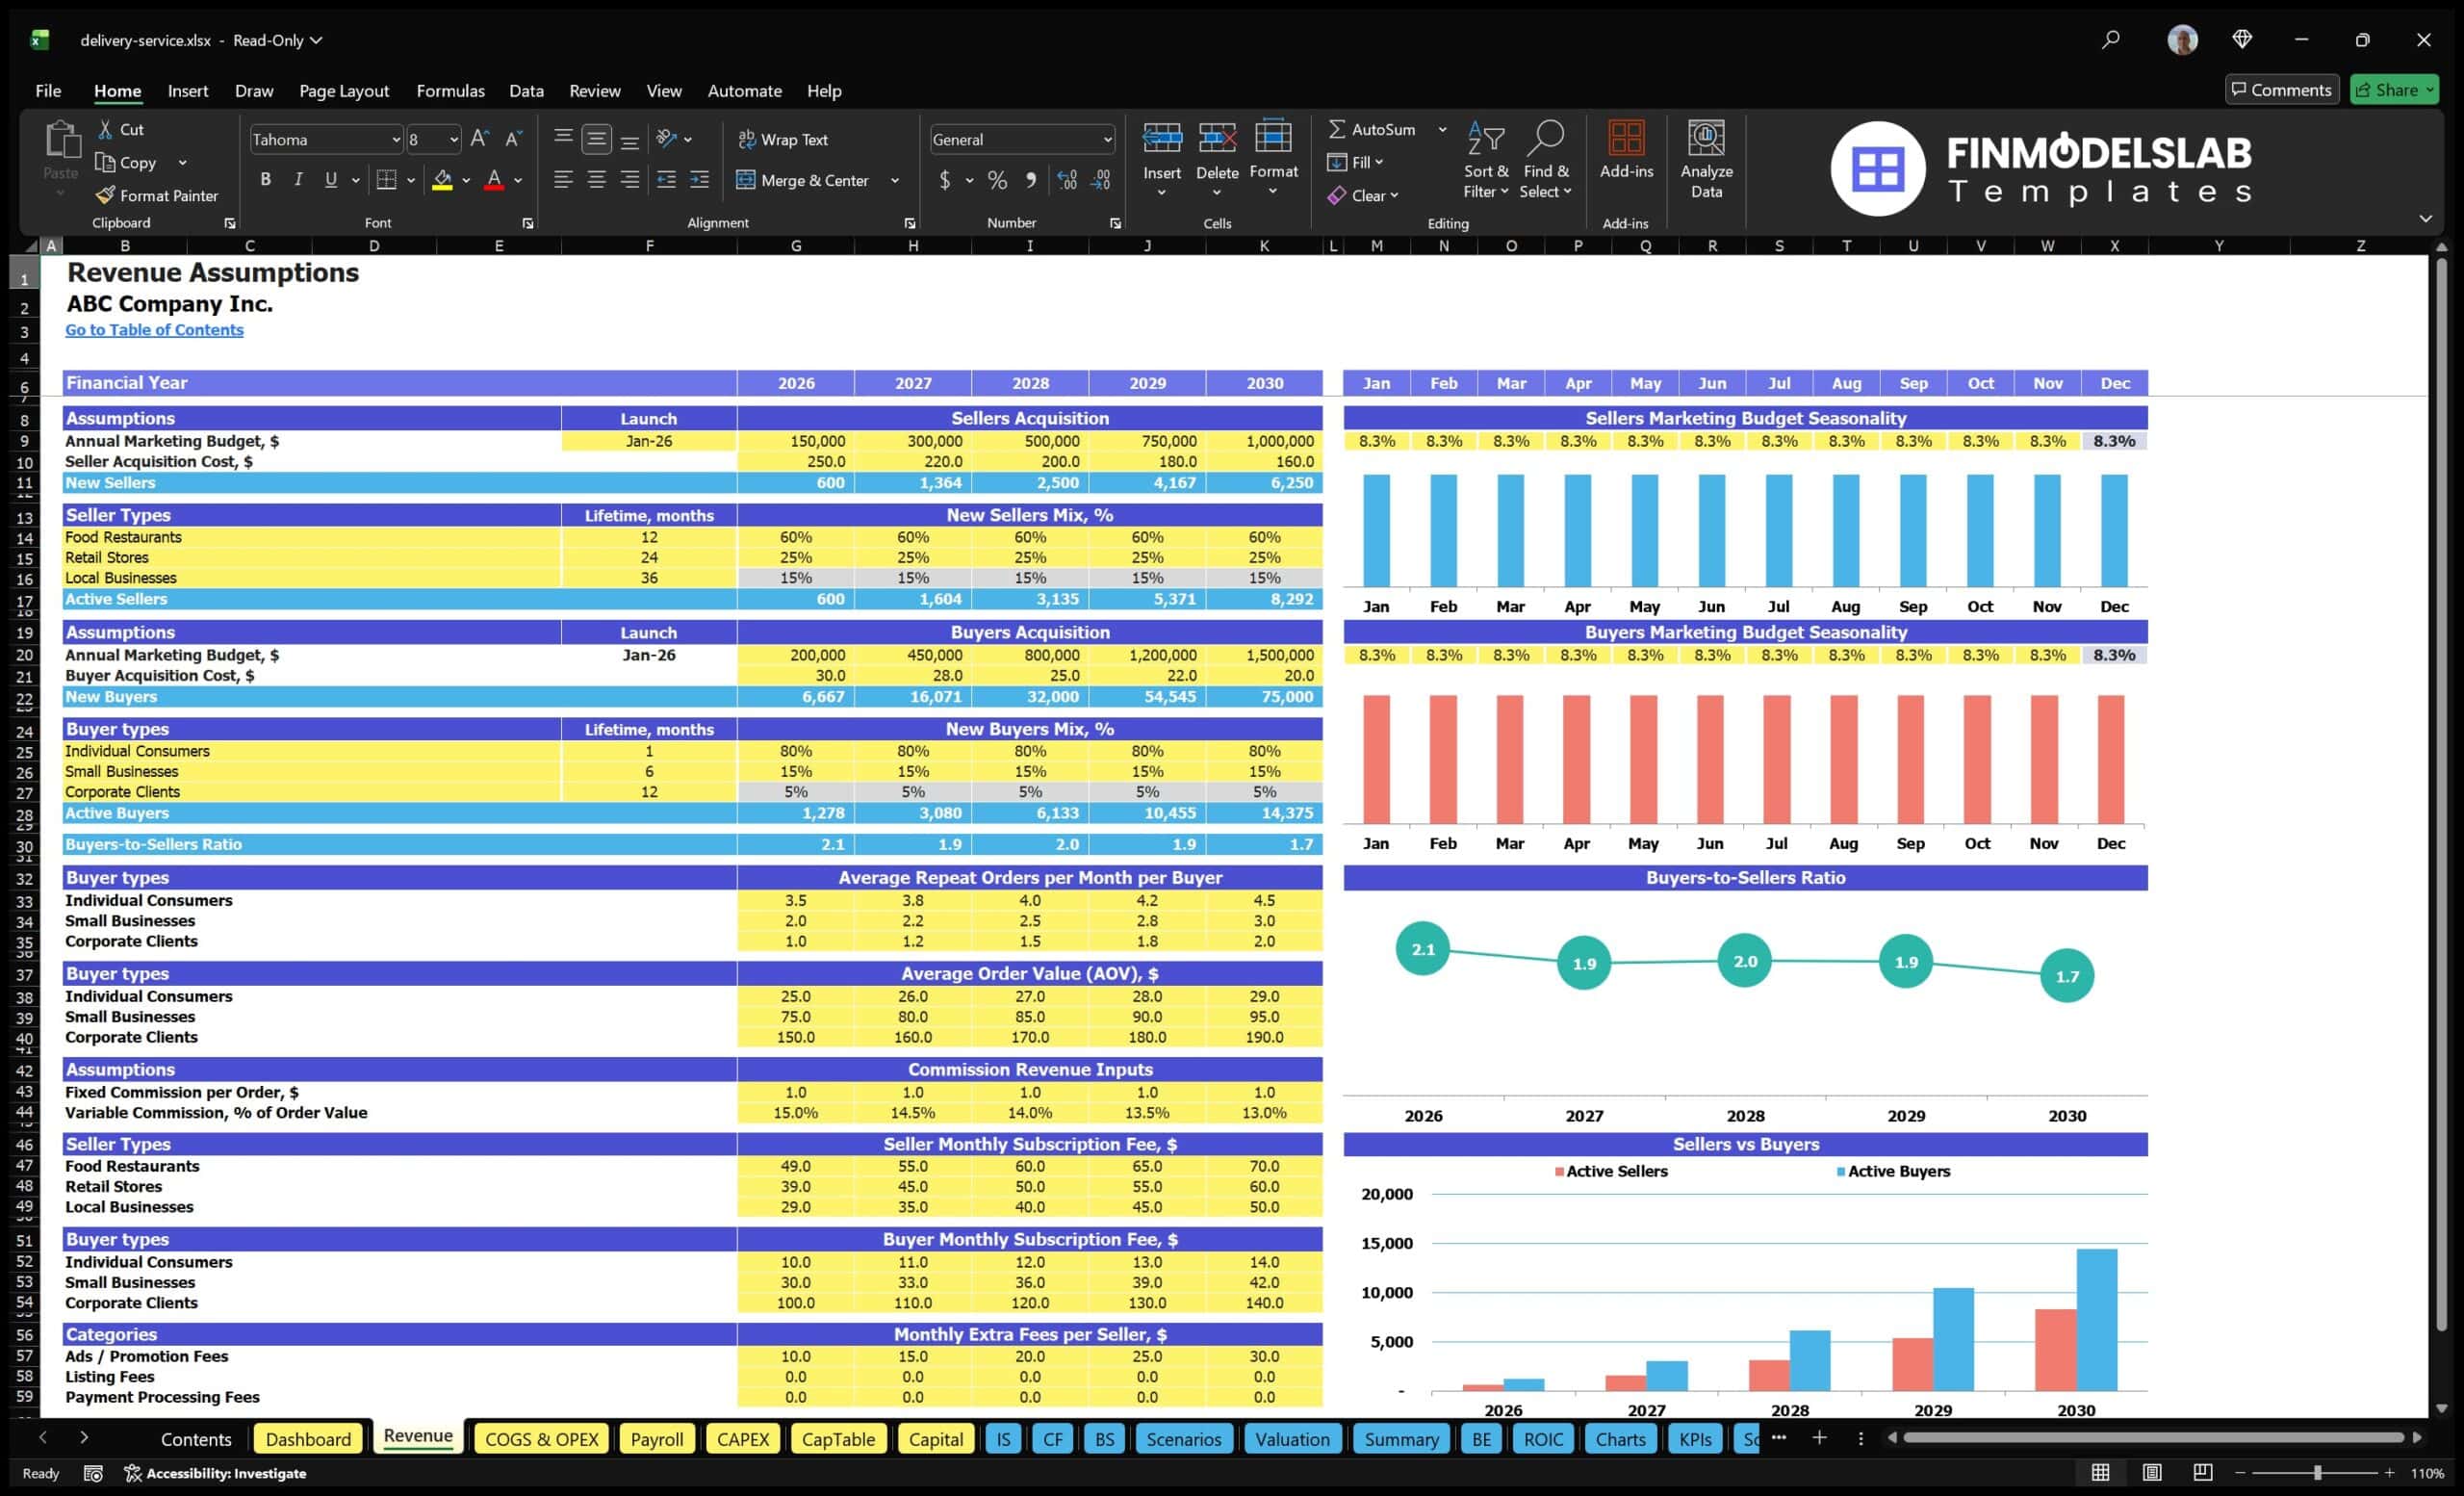
The revenue inputs component is where users define the core assumptions that drive the delivery service income forecast. A delivery business may generate revenue from several sources, such as commissions on orders, fixed fees per transaction, monthly subscriptions from buyers, monthly fees from sellers or merchants, promoted listings, advertising, premium service features, or other platform add-ons. This section allows users to adjust assumptions such as active customer growth, marketing spend, conversion rates, order frequency, average order value, seller counts, subscription pricing, commission percentages, and fixed order fees. These assumptions are essential because small changes in order volume, take rate, or subscription adoption can have a major impact on revenue and profitability. The model uses the inputs to calculate projected sales over time and connect commercial activity to the financial statements. This component helps users build a more realistic revenue forecast, test pricing strategies, compare customer segments such as individual consumers and corporate clients, and determine whether the business has enough transaction volume to support its cost structure. It is especially useful for founders building a pitch, consultants validating market assumptions, and operators setting growth targets.
Bank-Ready Reports
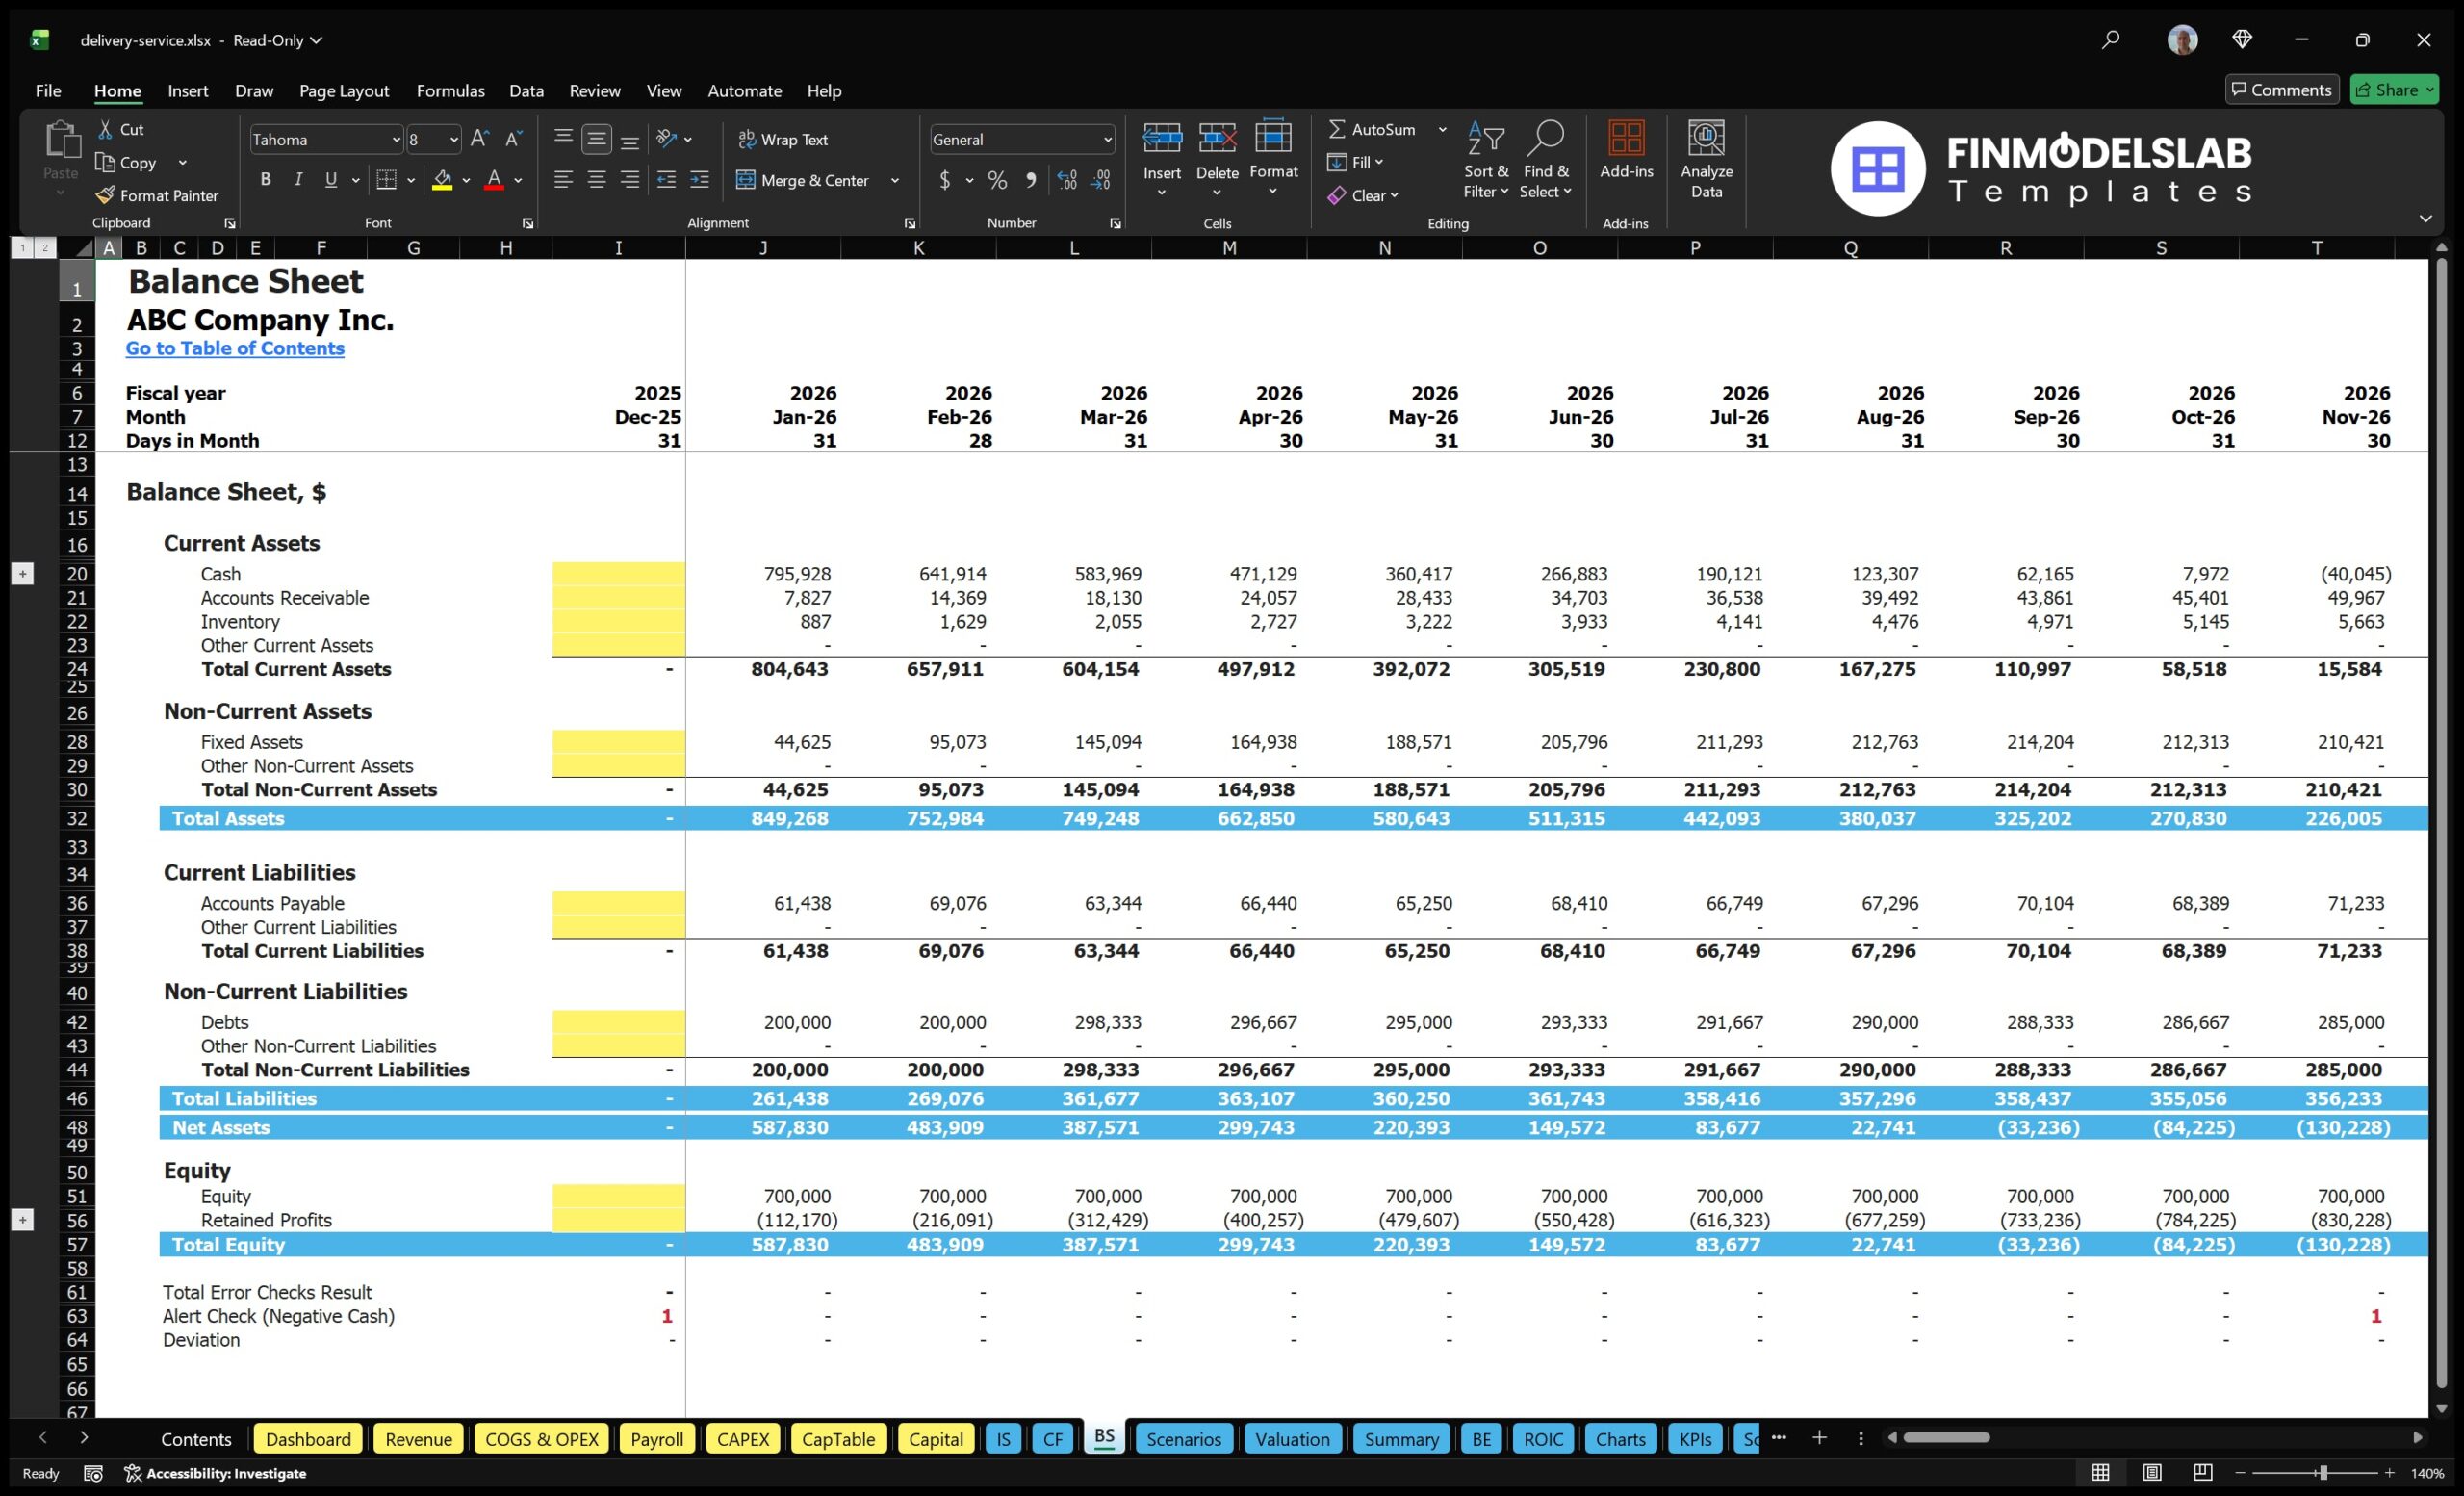
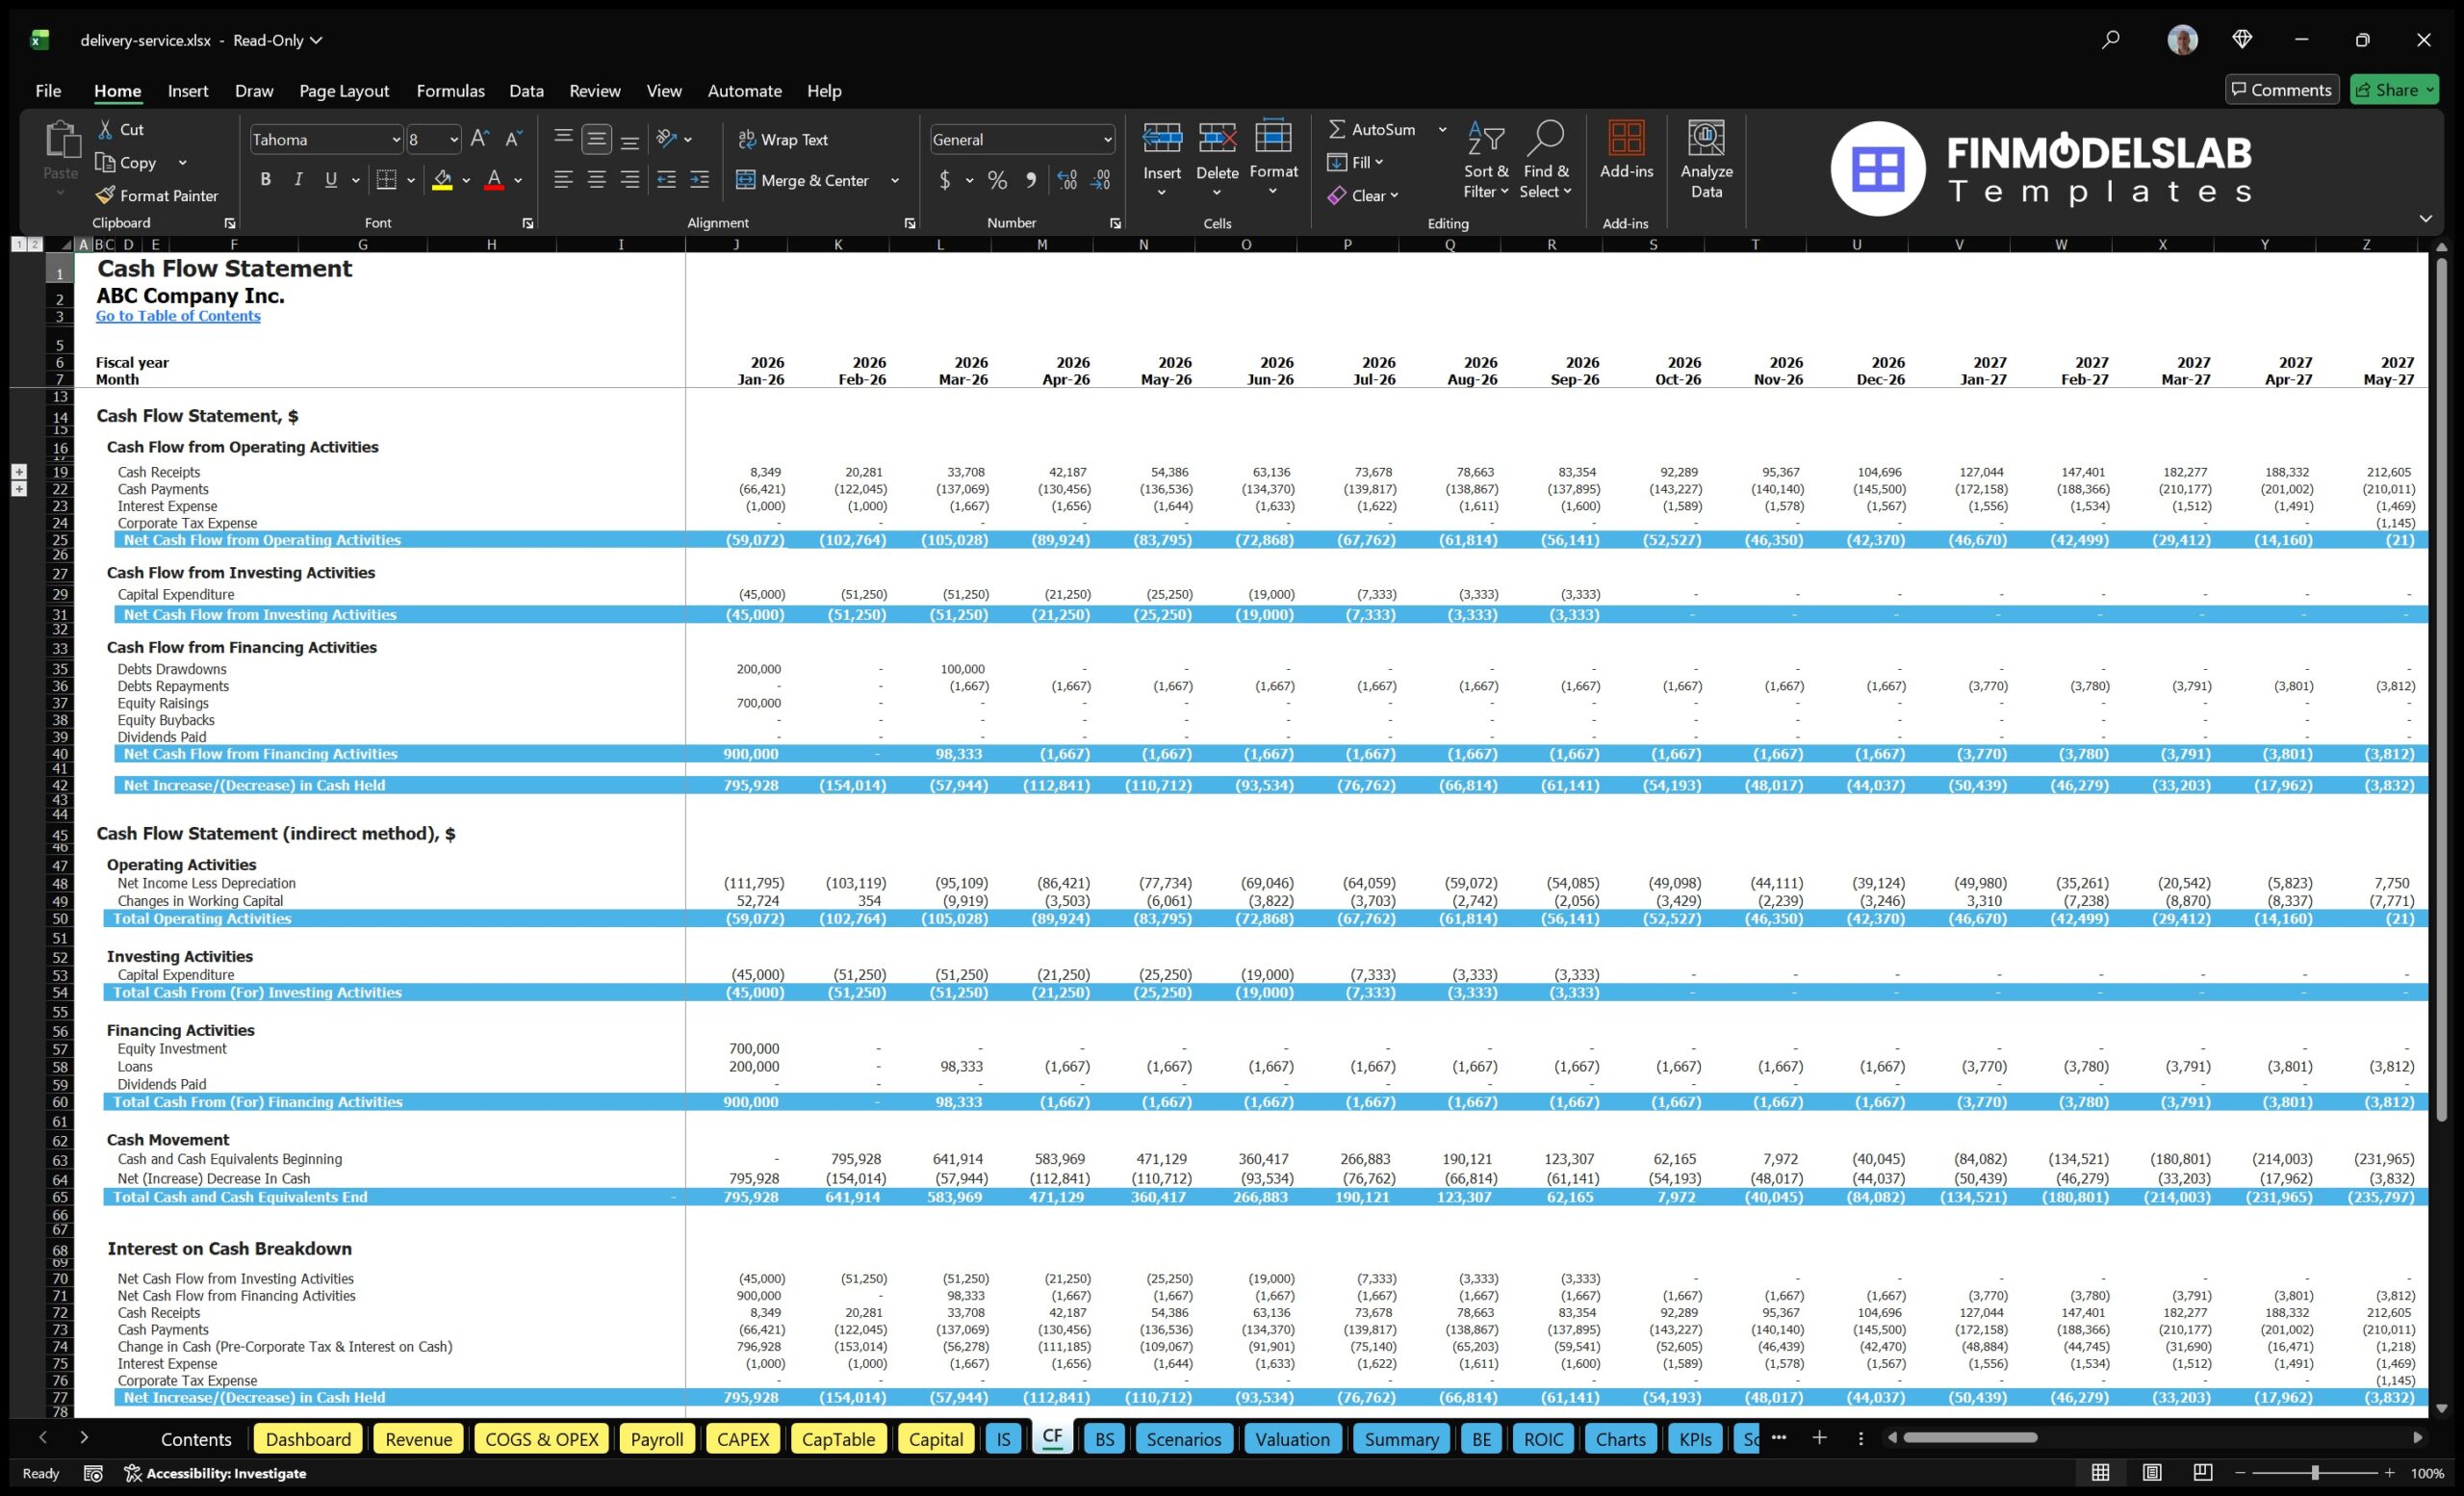
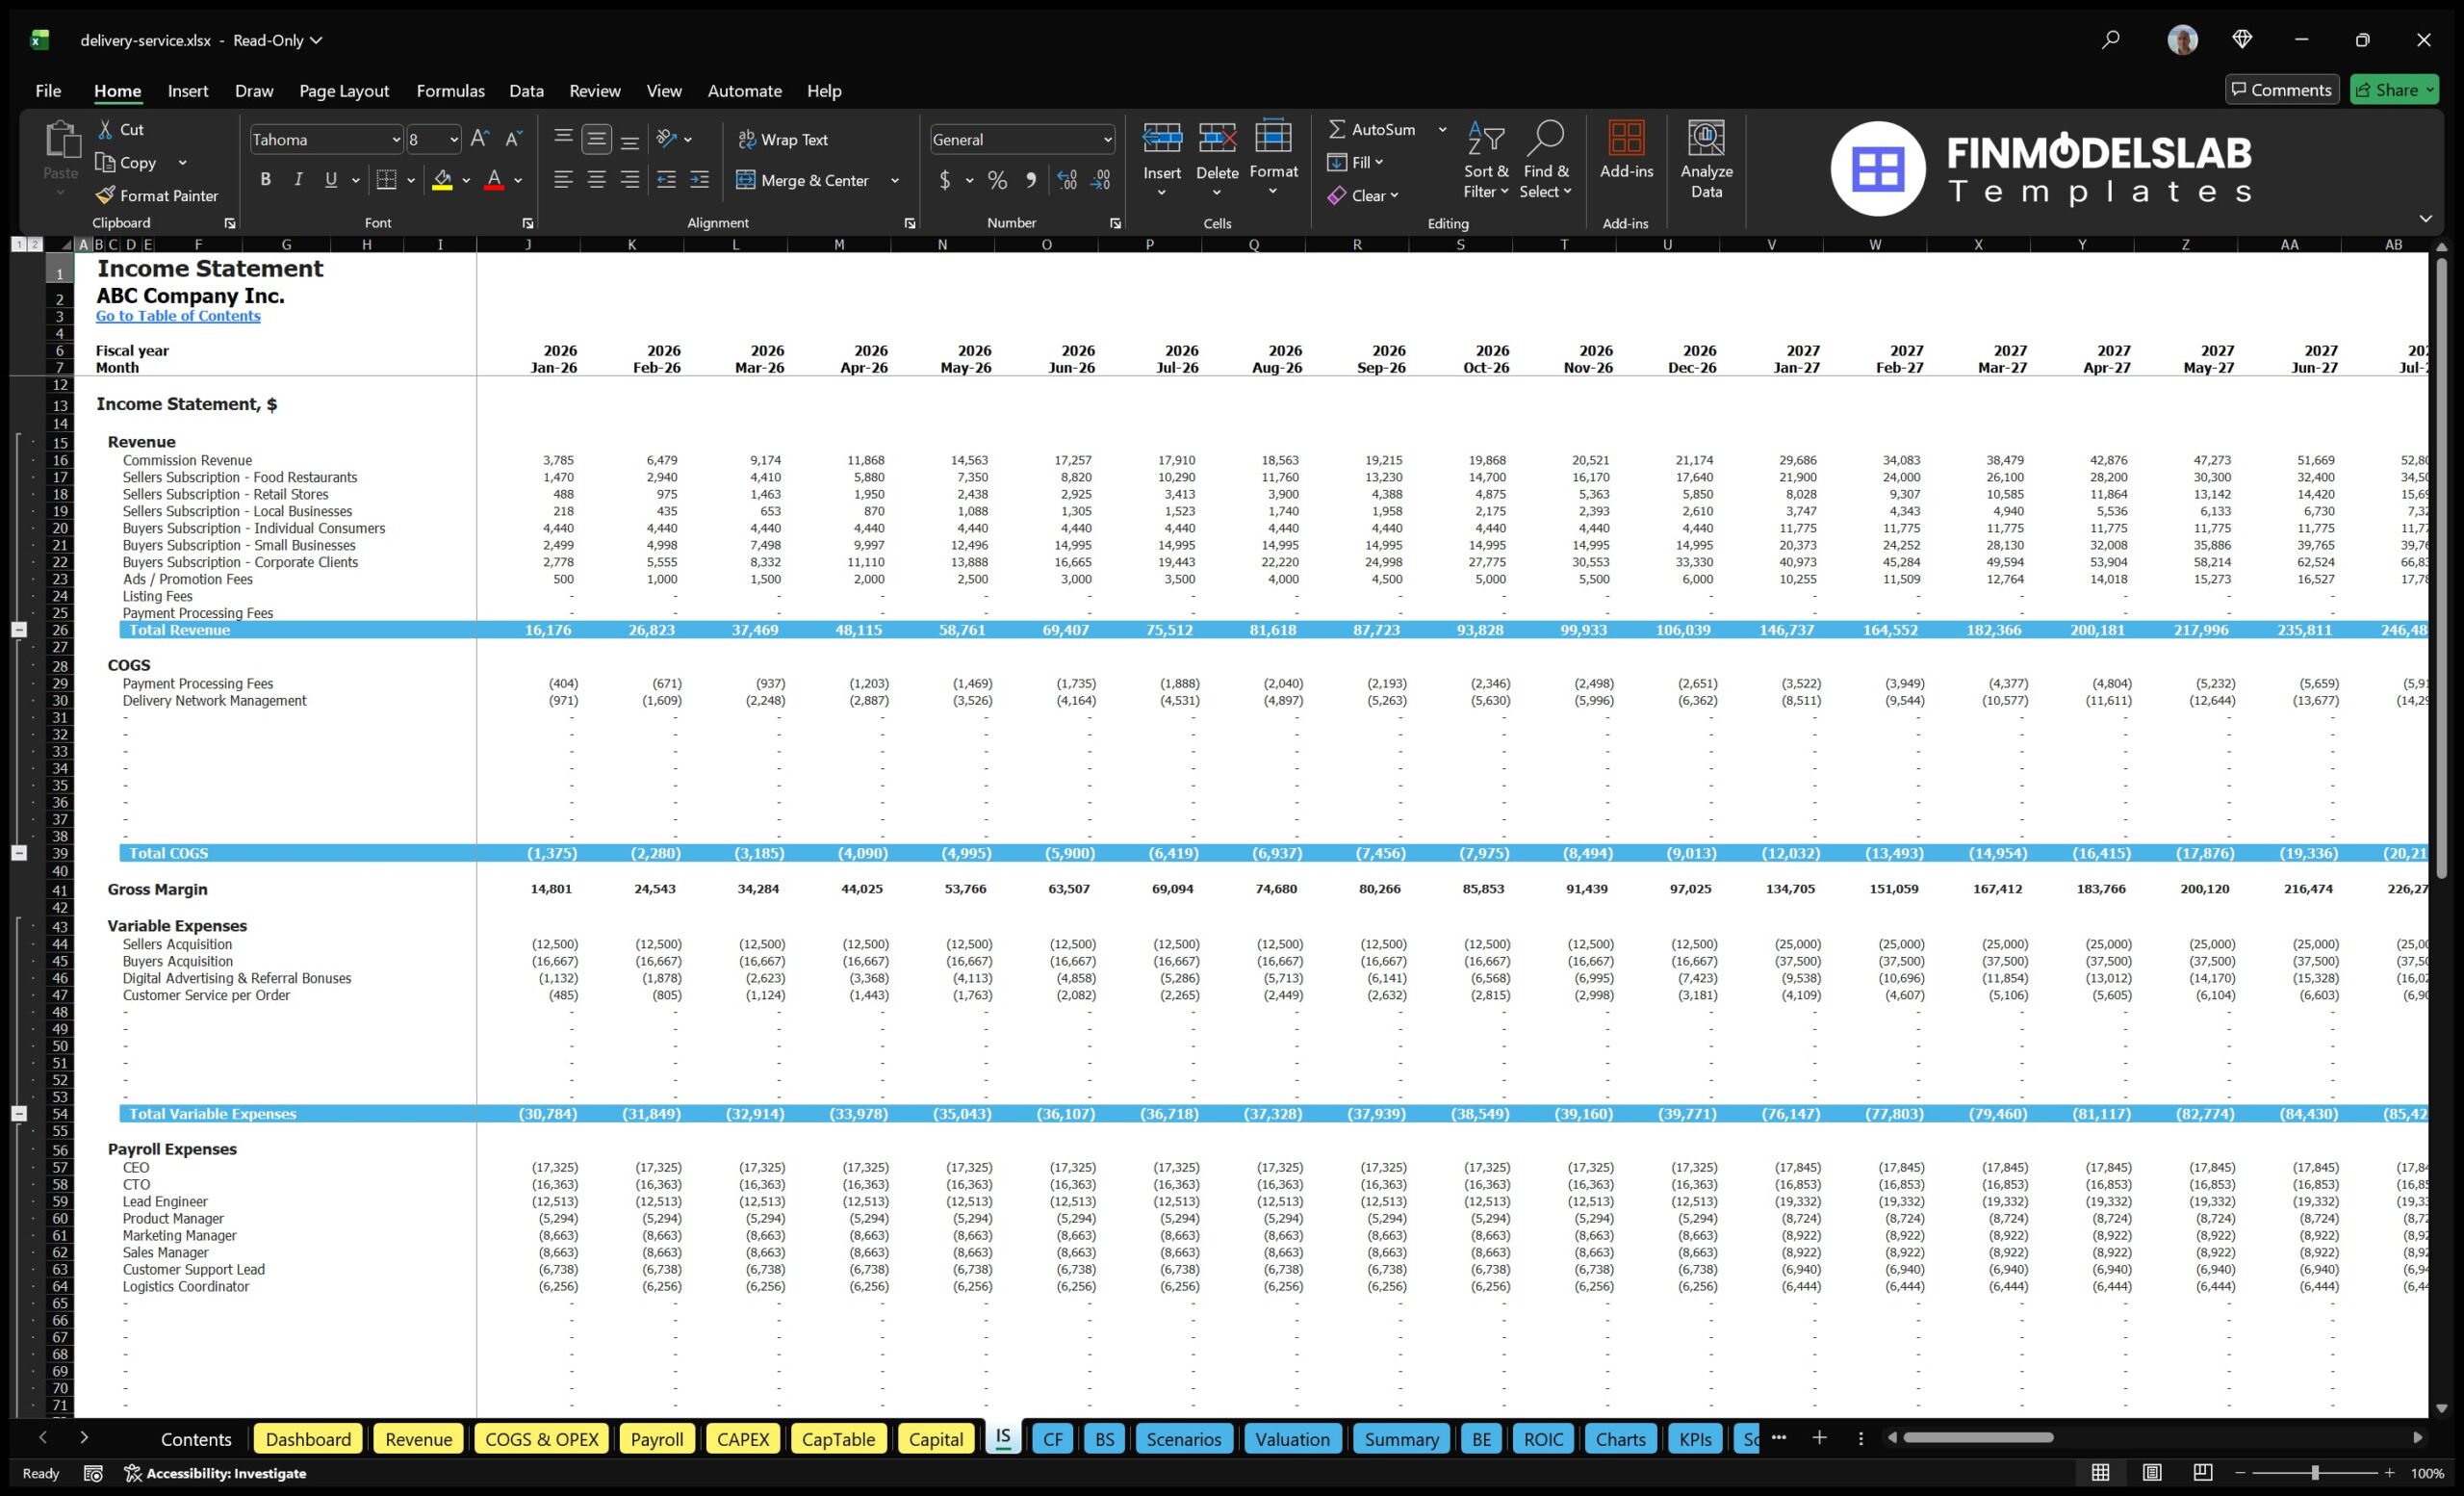
The bank-ready reports component provides lender-friendly financial outputs that can support funding applications, credit discussions, and formal business planning. Banks and lenders typically want to see clear financial statements, realistic assumptions, cash flow projections, debt service capacity, startup investment requirements, profitability expectations, and evidence that the business can manage its obligations over time. This section organizes the model’s key outputs into a more professional reporting format, helping users present the delivery service forecast in a way that is easier for external stakeholders to review. The reports may include profit and loss forecasts, cash flow analysis, balance sheet summaries, financing assumptions, capital expenditure details, and key ratios or performance indicators. For a delivery service, this is important because early-stage cash burn, technology setup, marketing spend, payroll, and operational expansion can create funding needs before the business becomes self-sustaining. The bank-ready reporting structure helps users explain how much capital is required, how funds may be used, when cash flow may improve, and how the company plans to reach profitability. This component is useful for entrepreneurs seeking loans, founders preparing financing documents, and advisors supporting funding applications.
Revenue Breakdown
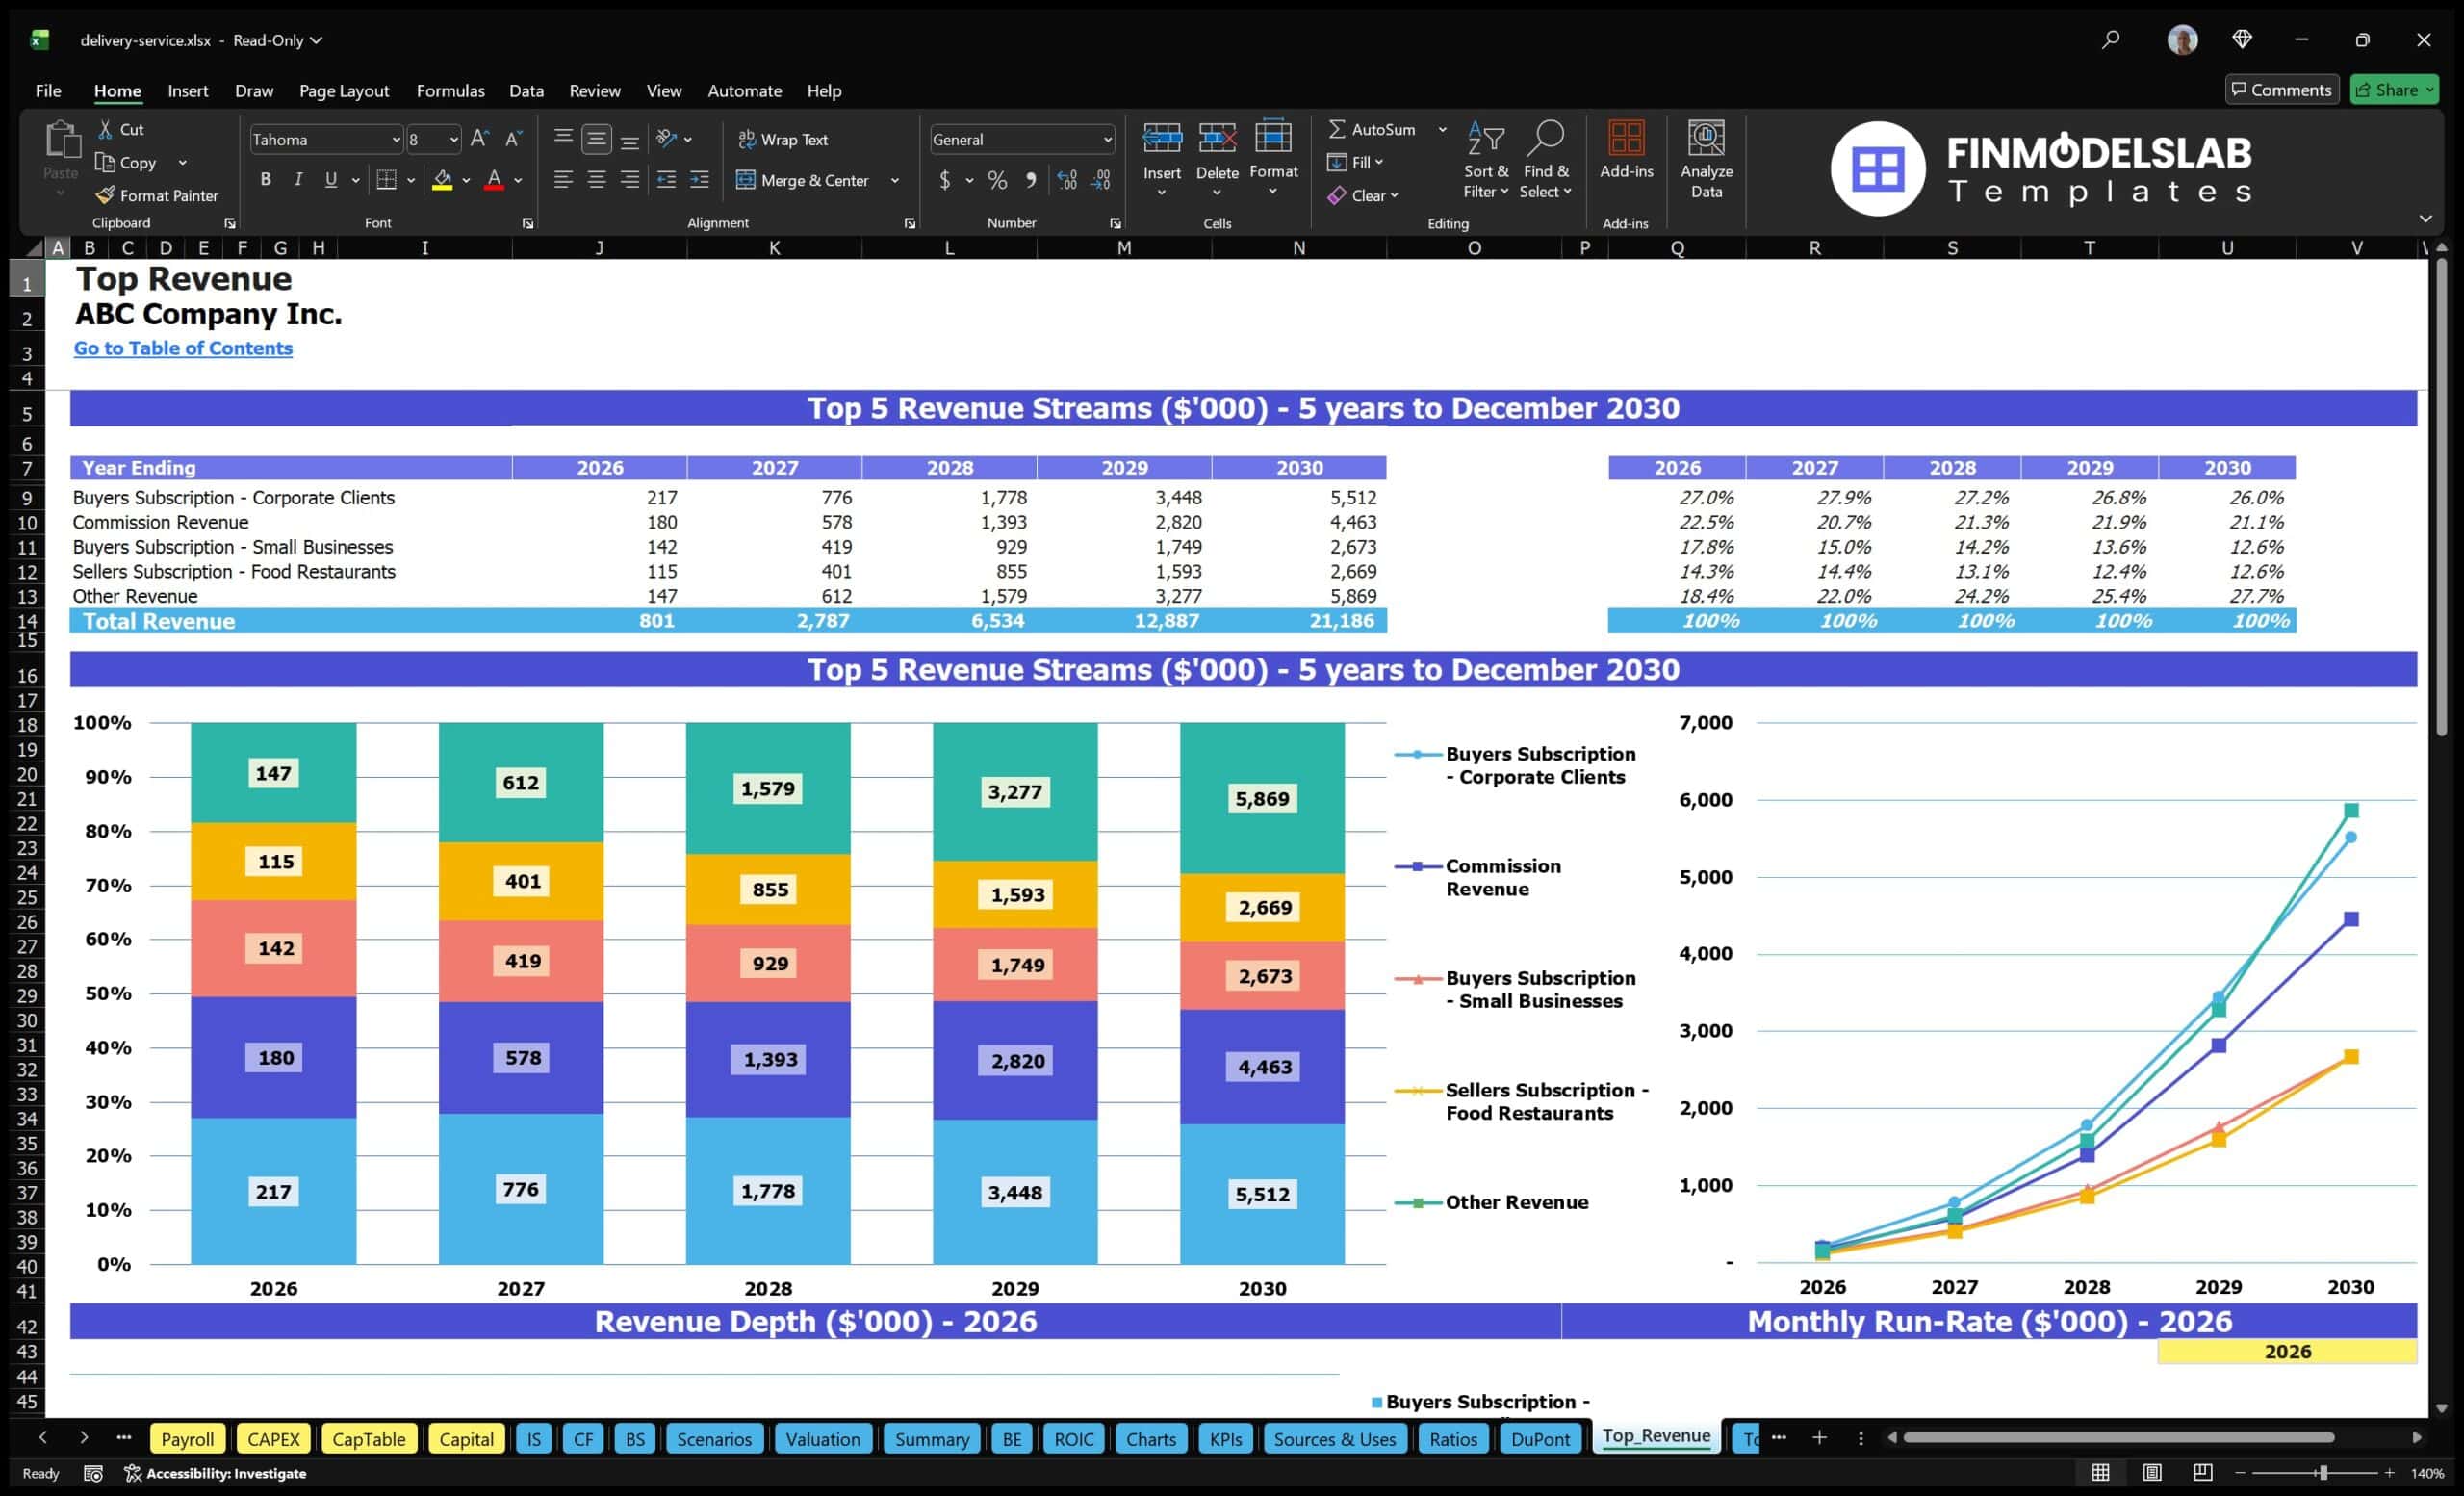
The revenue breakdown component gives users a more detailed view of how total revenue is built across the different income streams of the delivery service. Rather than relying on one broad sales figure, this section separates revenue into its underlying sources, such as commission revenue, fixed transaction fees, buyer subscriptions, seller subscriptions, seller extras, promoted listings, advertising, corporate orders, consumer orders, or other service-related income. This helps users understand which streams contribute most to growth and which assumptions are most important to profitability. For example, a delivery service may have strong gross merchandise volume but limited net revenue if the commission rate is too low, or it may rely heavily on recurring subscription fees to stabilize income between order cycles. The breakdown helps users compare recurring revenue with transaction-based revenue, identify concentration risk, and evaluate whether the pricing model is balanced. It also supports decision-making around promotions, subscription tiers, merchant packages, and customer acquisition strategy. By showing a detailed view of each revenue stream, this component gives founders, analysts, and investors a clearer understanding of how the delivery service makes money and where future growth may come from.
KPI Dashboard
The KPI dashboard focuses on the performance metrics that matter most when evaluating a delivery service business. Financial statements show the overall results, but key performance indicators help explain whether the business is operating efficiently and scaling in a healthy way. This section may include metrics such as customer acquisition cost, seller acquisition cost, take rate, order volume, average order value, revenue per user, EBITDA margin, gross margin, burn rate, payback period, internal rate of return, return on equity, cash runway, and other benchmarks relevant to delivery and platform economics. Users can review these metrics to understand whether marketing spend is producing enough users, whether order density is improving, whether profitability is moving in the right direction, and whether the business can recover its initial investment within a reasonable timeframe. The KPI dashboard is particularly useful for investor presentations because investors often look beyond revenue and want to understand efficiency, scalability, and return potential. It also helps operators track the health of the business, set performance targets, compare actual results against the forecast, and make adjustments to pricing, hiring, marketing, or expansion plans before issues become more costly.
Break-Even Analysis
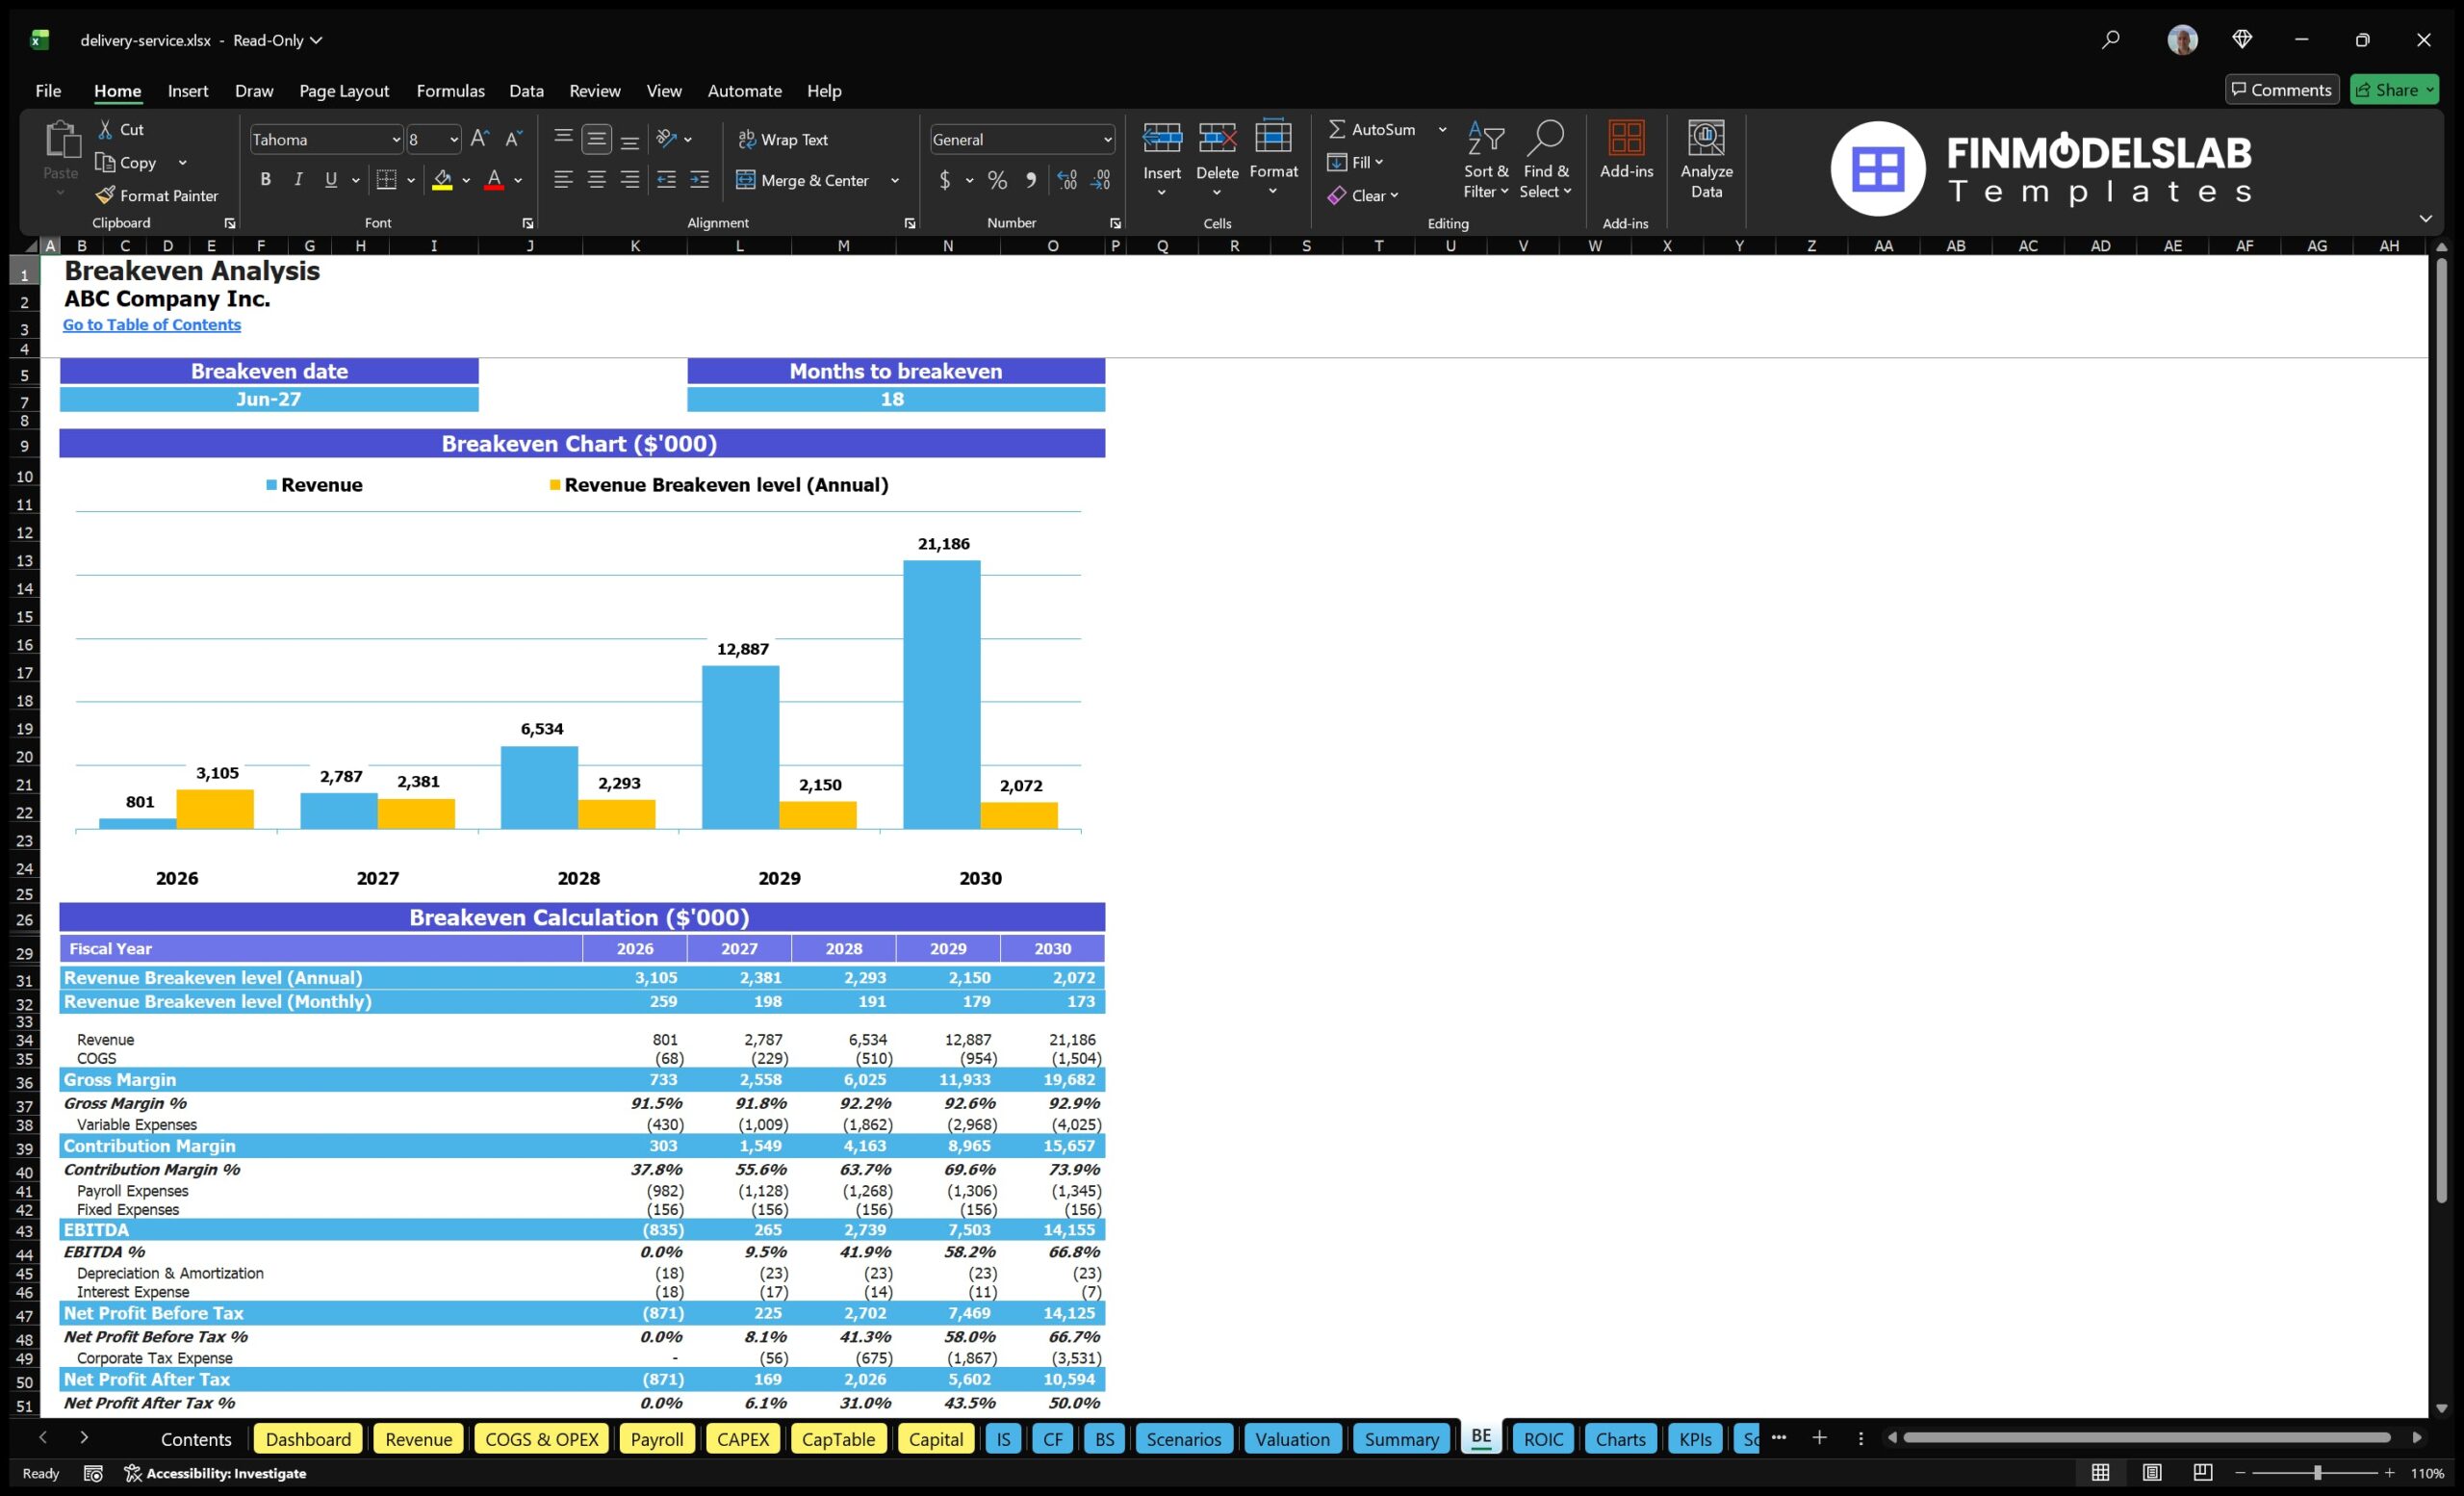
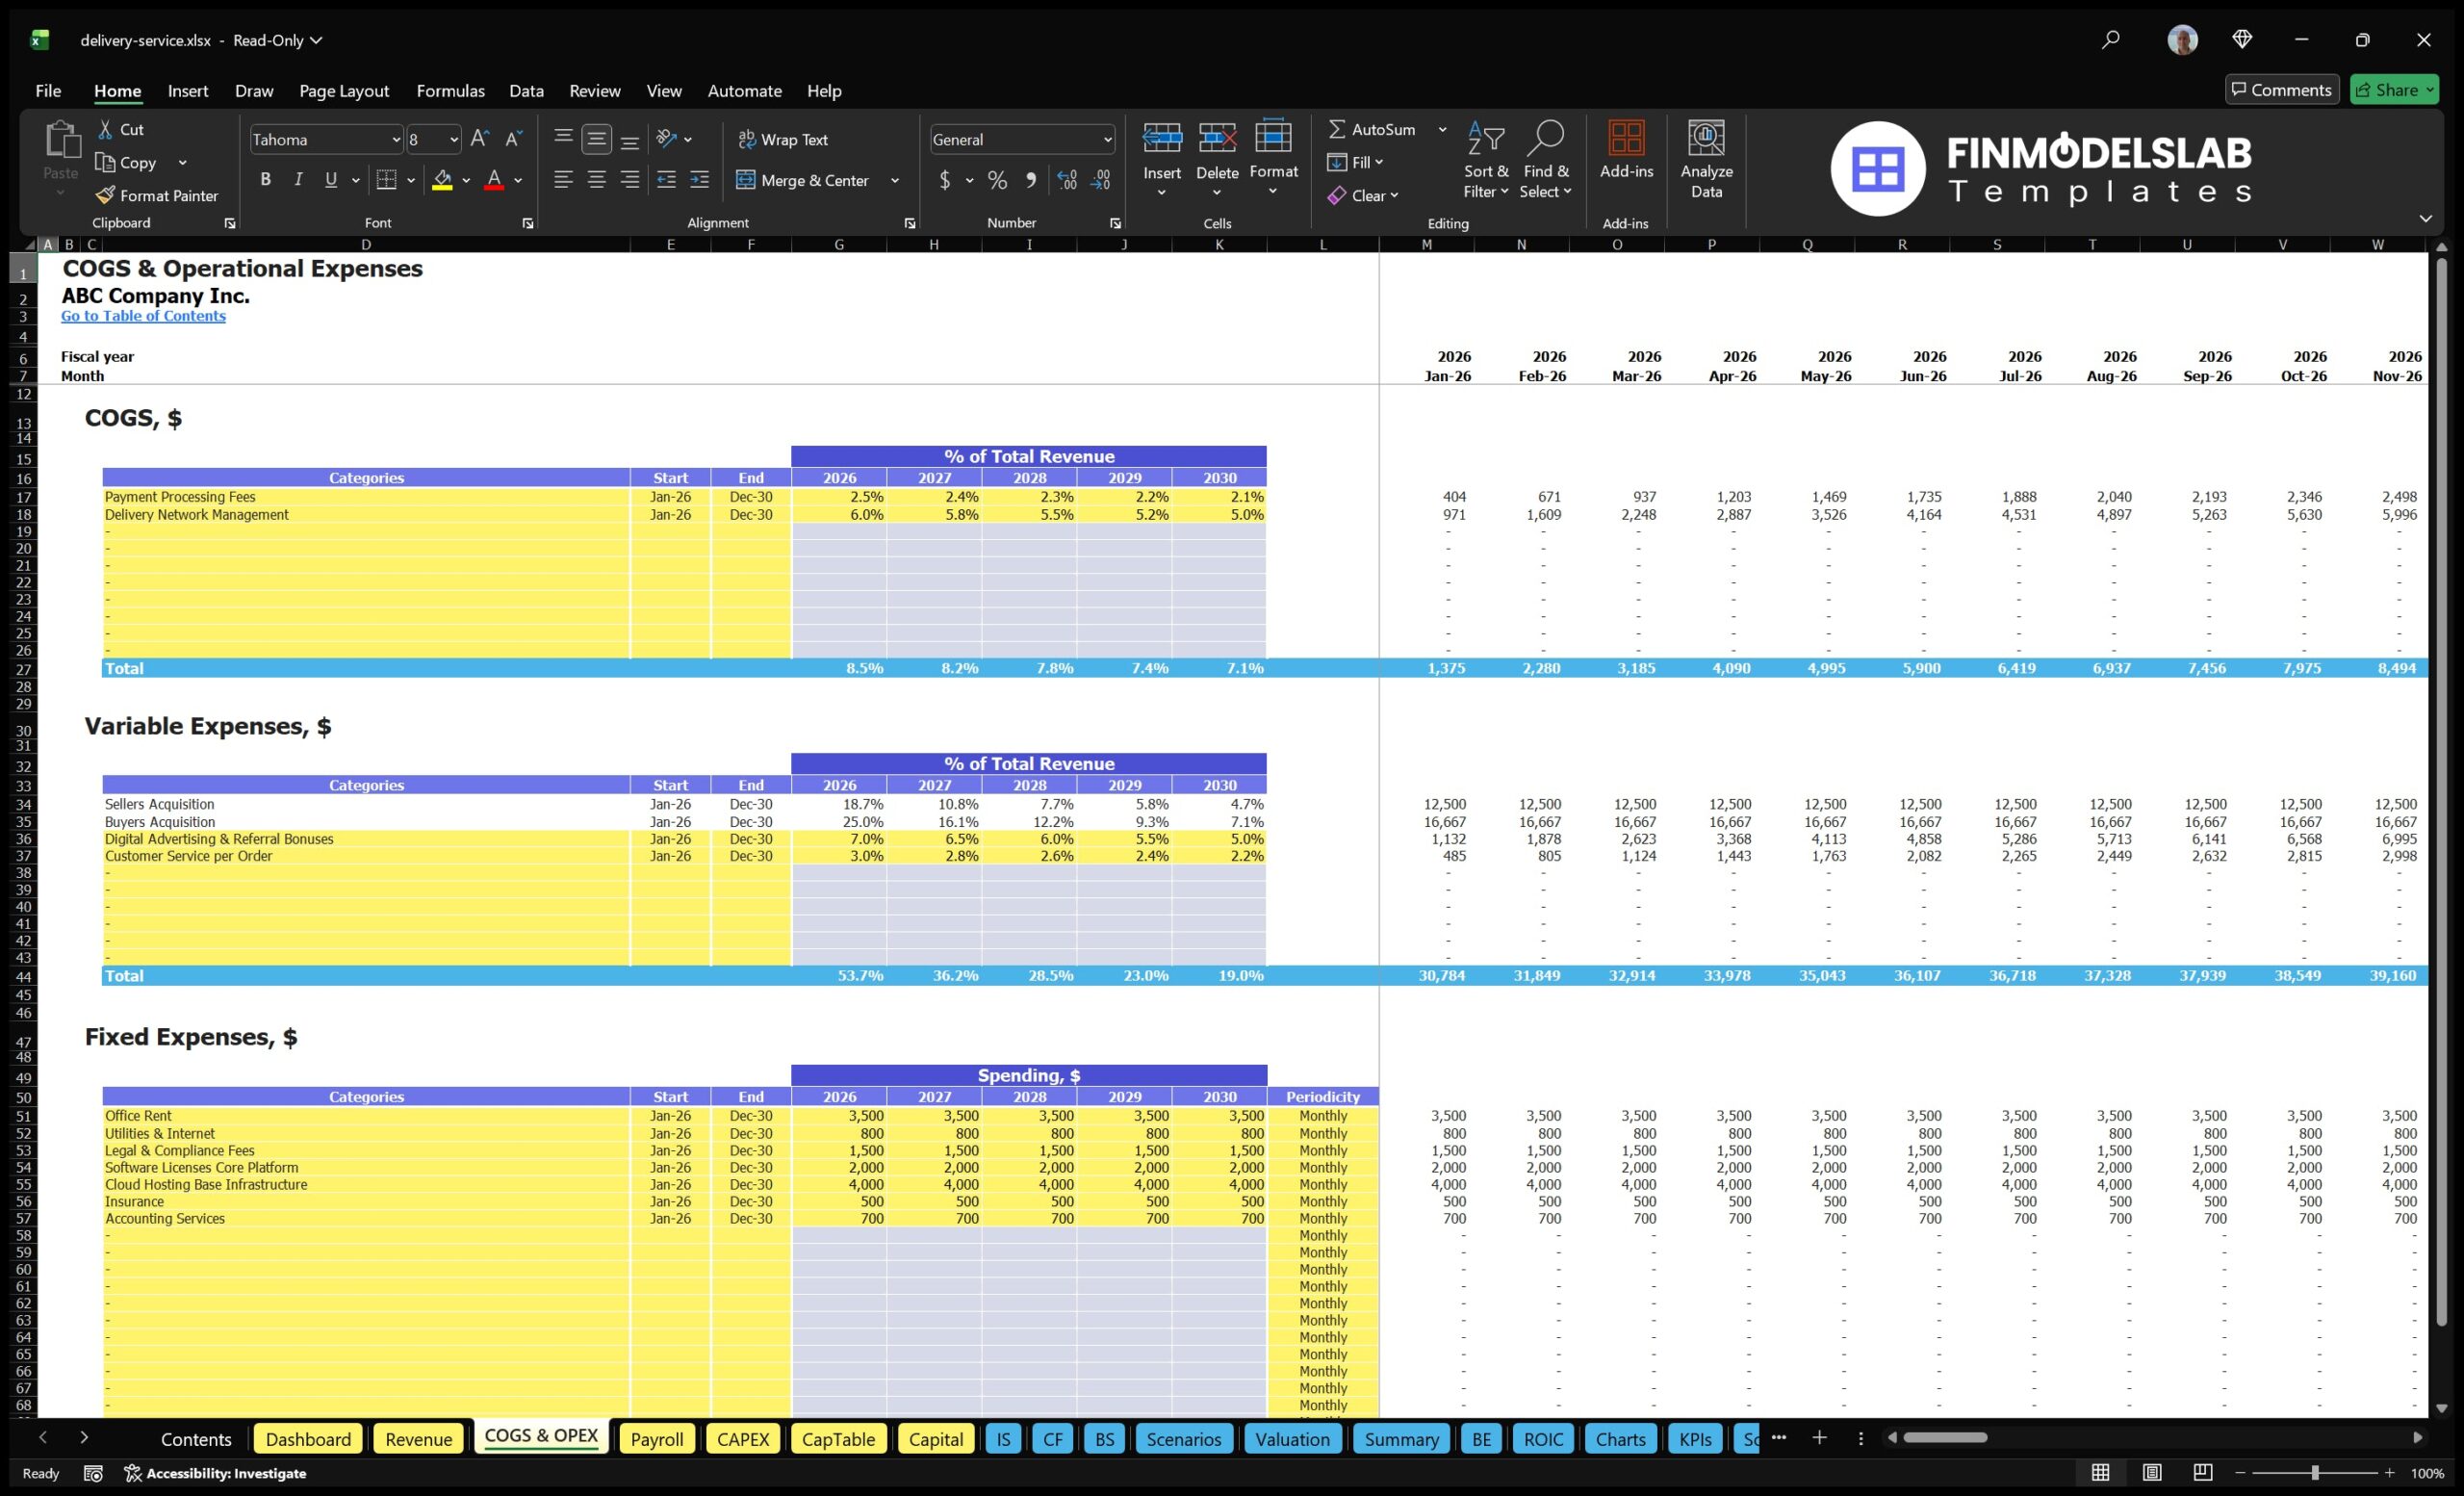
The break-even analysis component helps users identify when the delivery service is expected to become profitable and what level of activity is required to cover its cost structure. A delivery business often faces significant early expenses, including technology development, marketing, salaries, customer support, logistics coordination, software tools, infrastructure, and administrative overhead. Revenue may take time to scale as users are acquired, sellers are onboarded, and order frequency increases. This section helps connect revenue assumptions and expense assumptions to show when the business can move from losses to positive profitability. It may calculate break-even timing based on monthly revenue, gross profit, EBITDA, net income, or cumulative profit depending on how the model is structured. Users can test how changes in commission rates, subscription pricing, order volume, average order value, payroll, or marketing spend affect the break-even date. This is useful for planning because it shows how much runway the business may need before becoming self-sustaining. It also supports funding conversations by giving investors and lenders a clearer view of the path to profitability, the size of the early cash gap, and the operational levers that can shorten the time to break-even.
Startup Cost and Funding Requirements
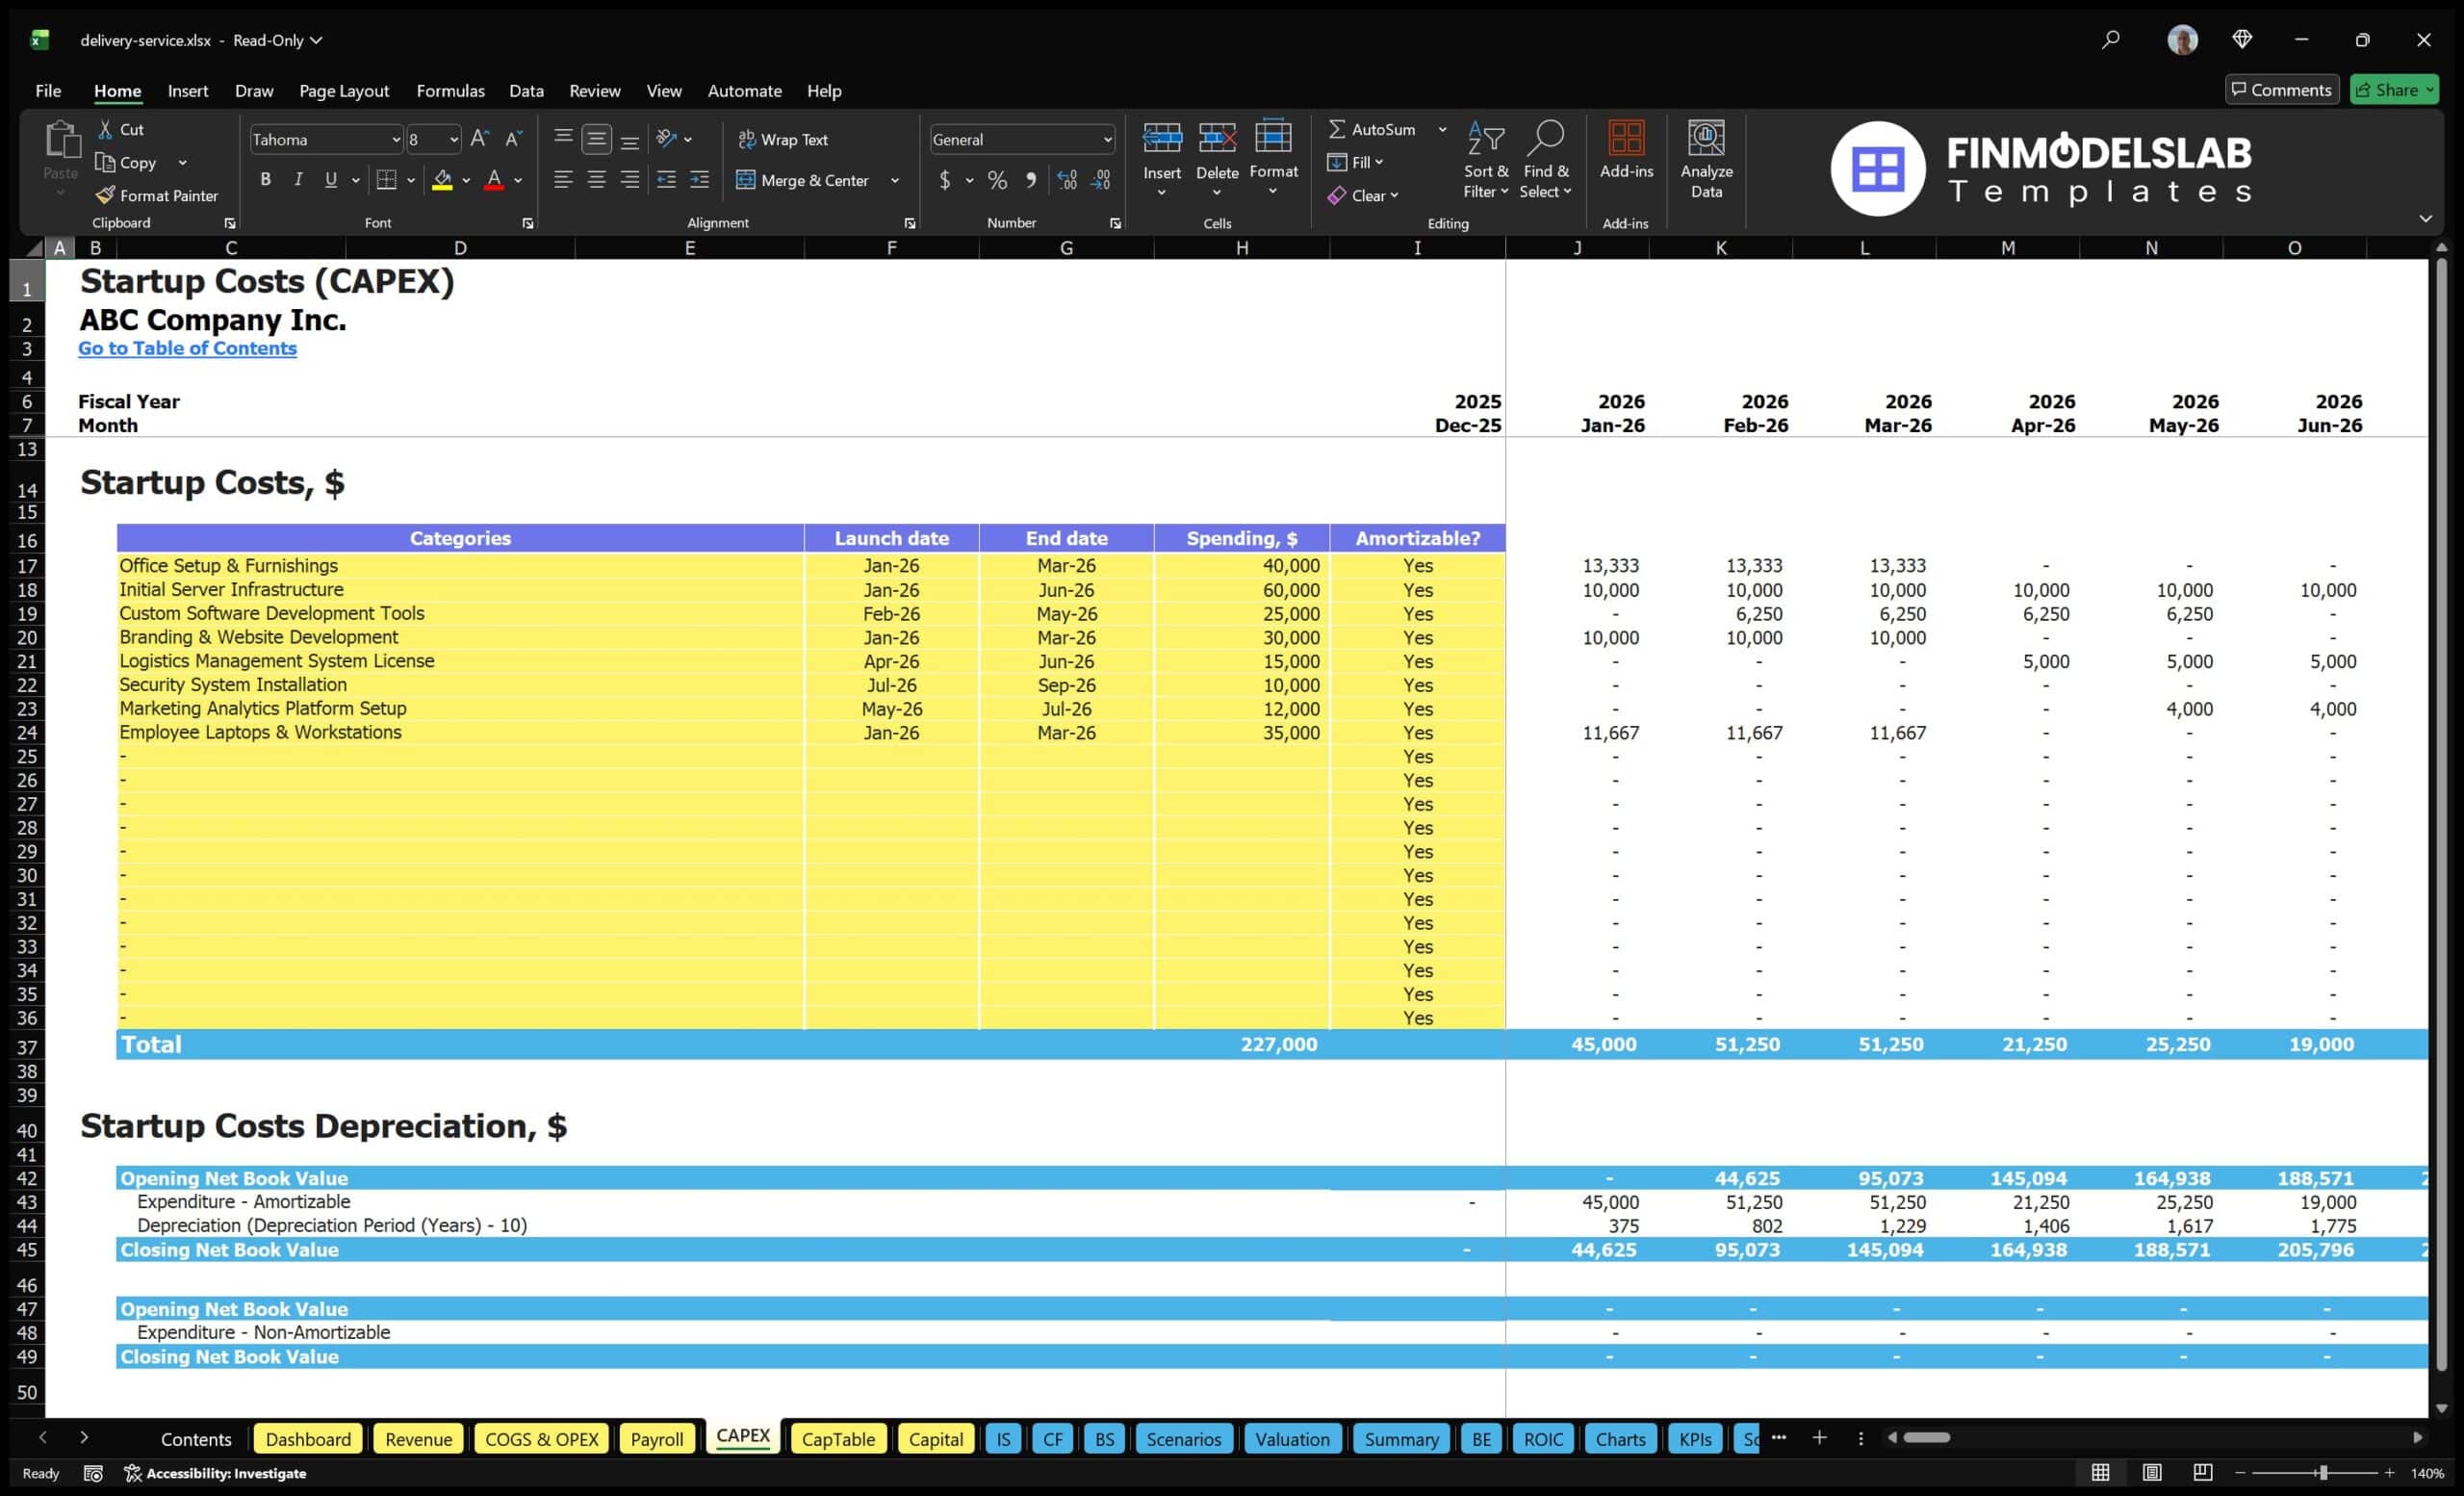
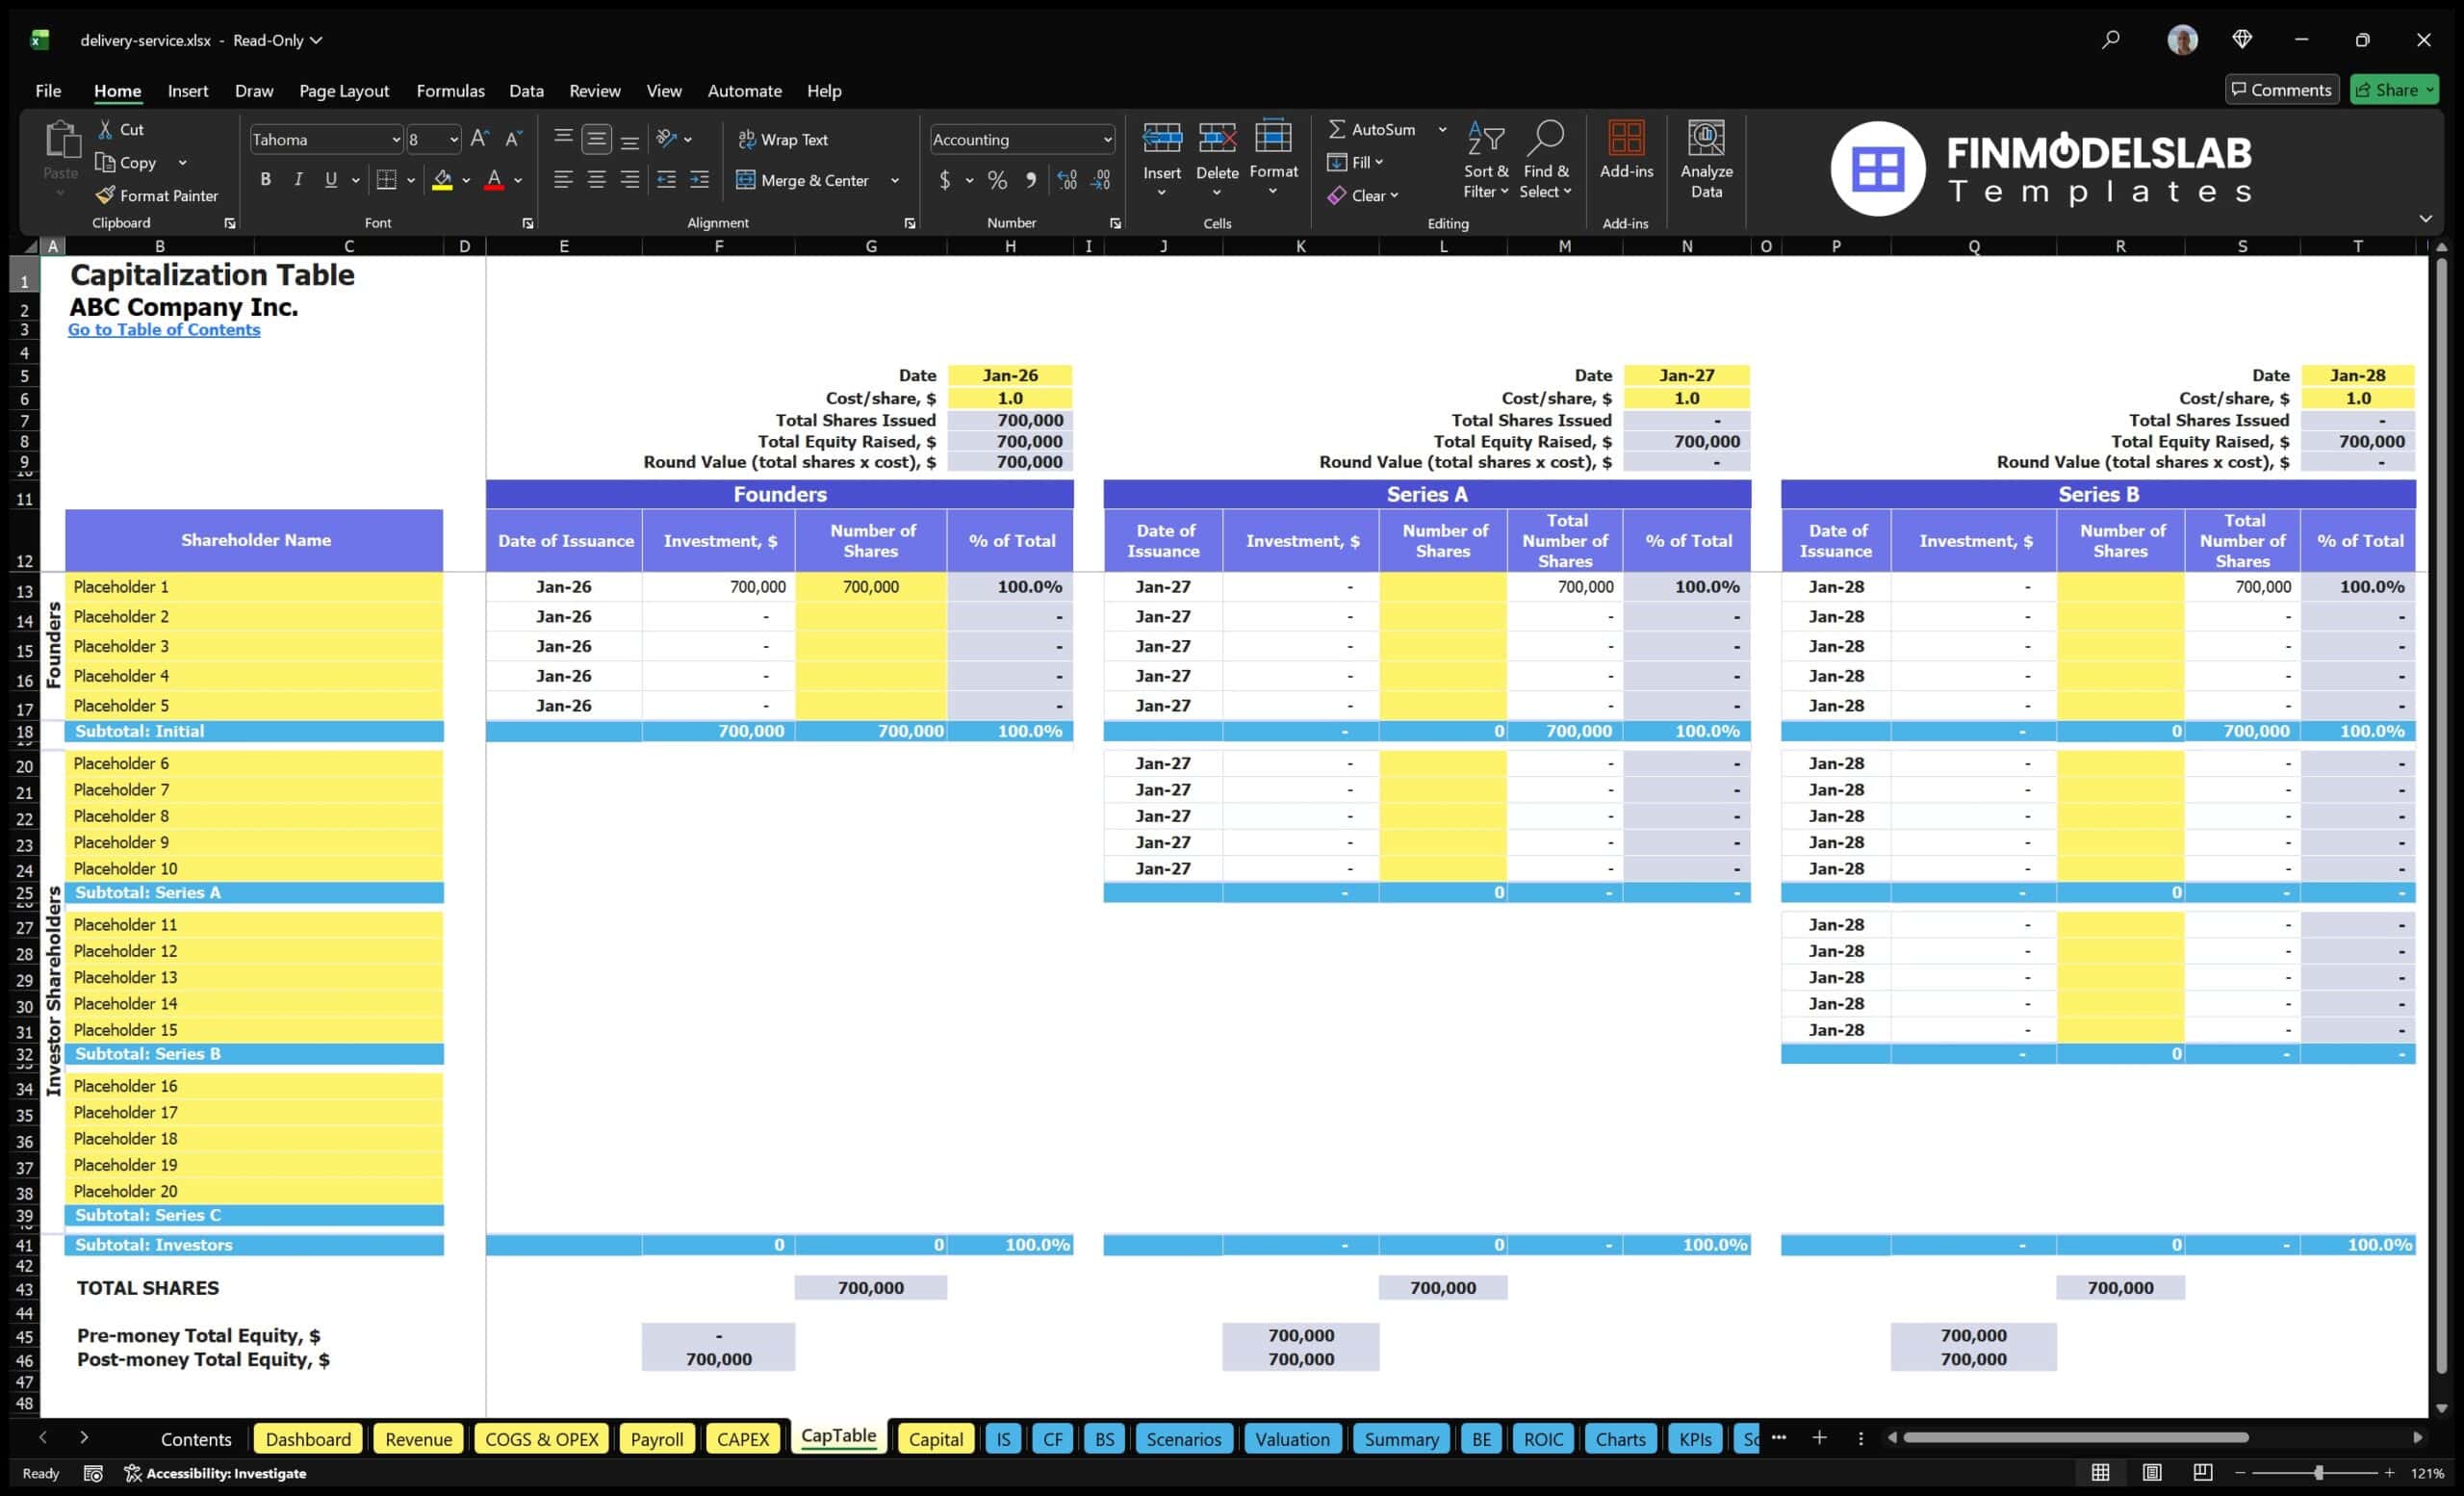
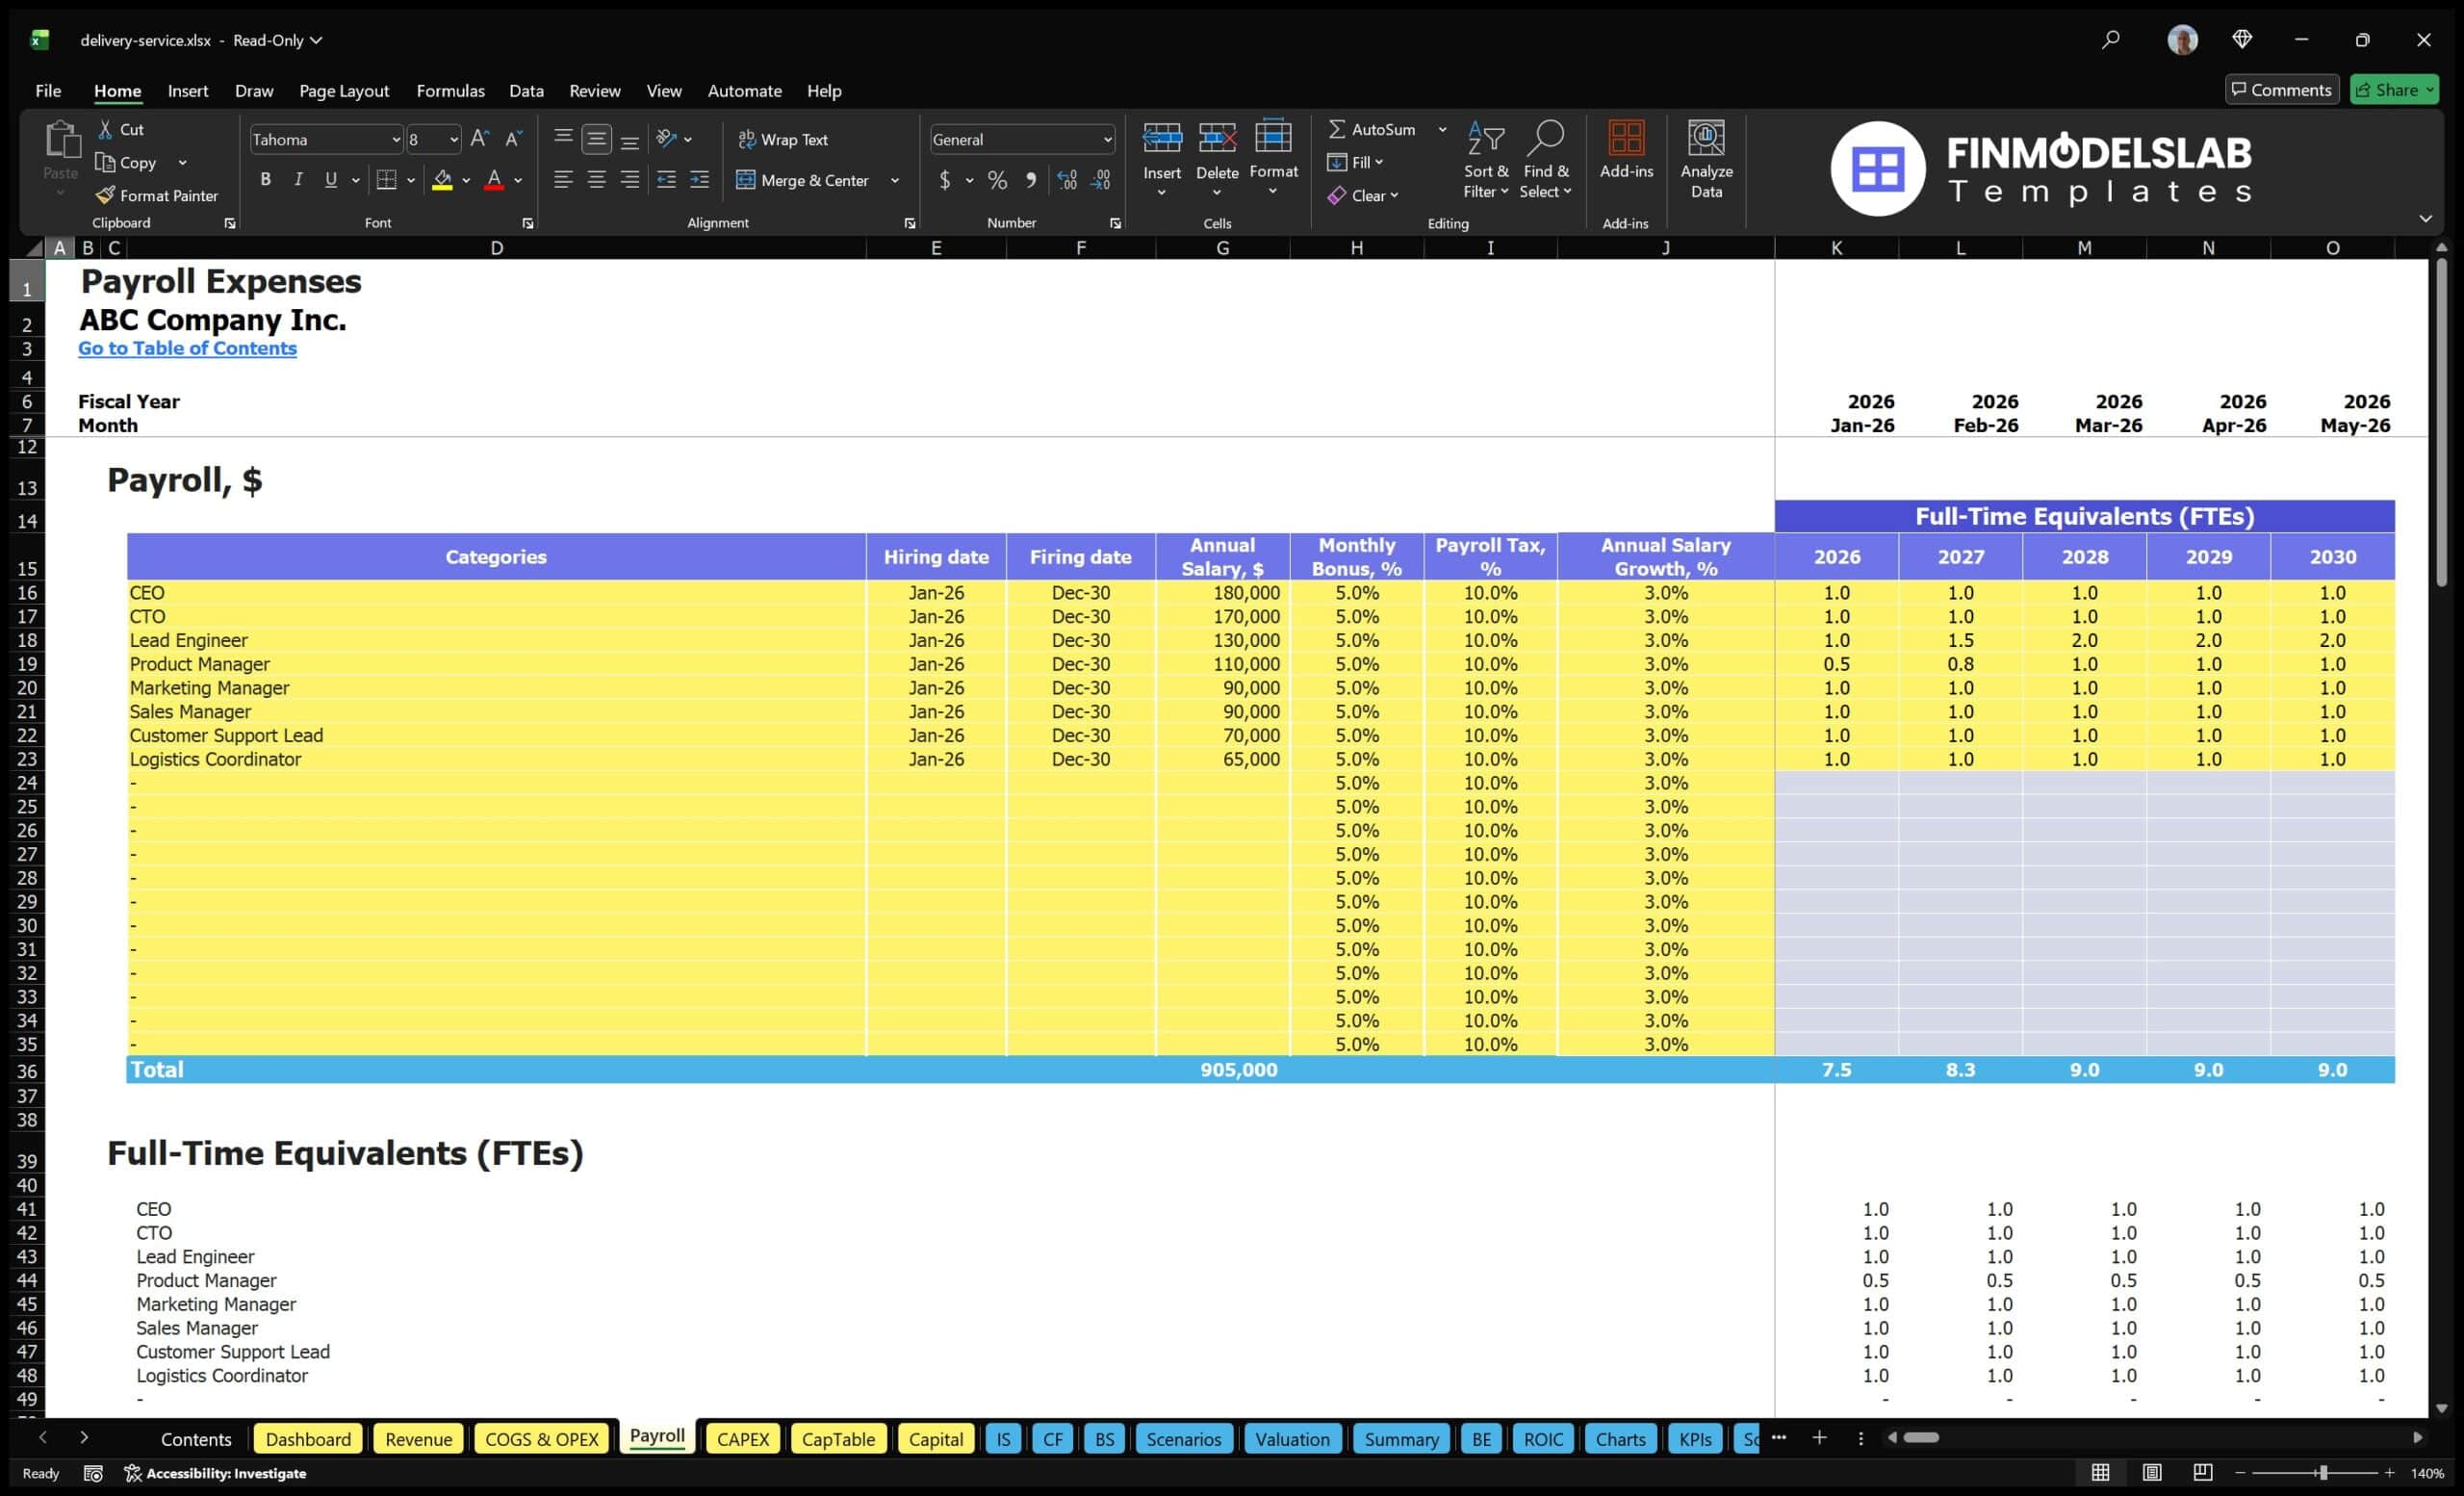
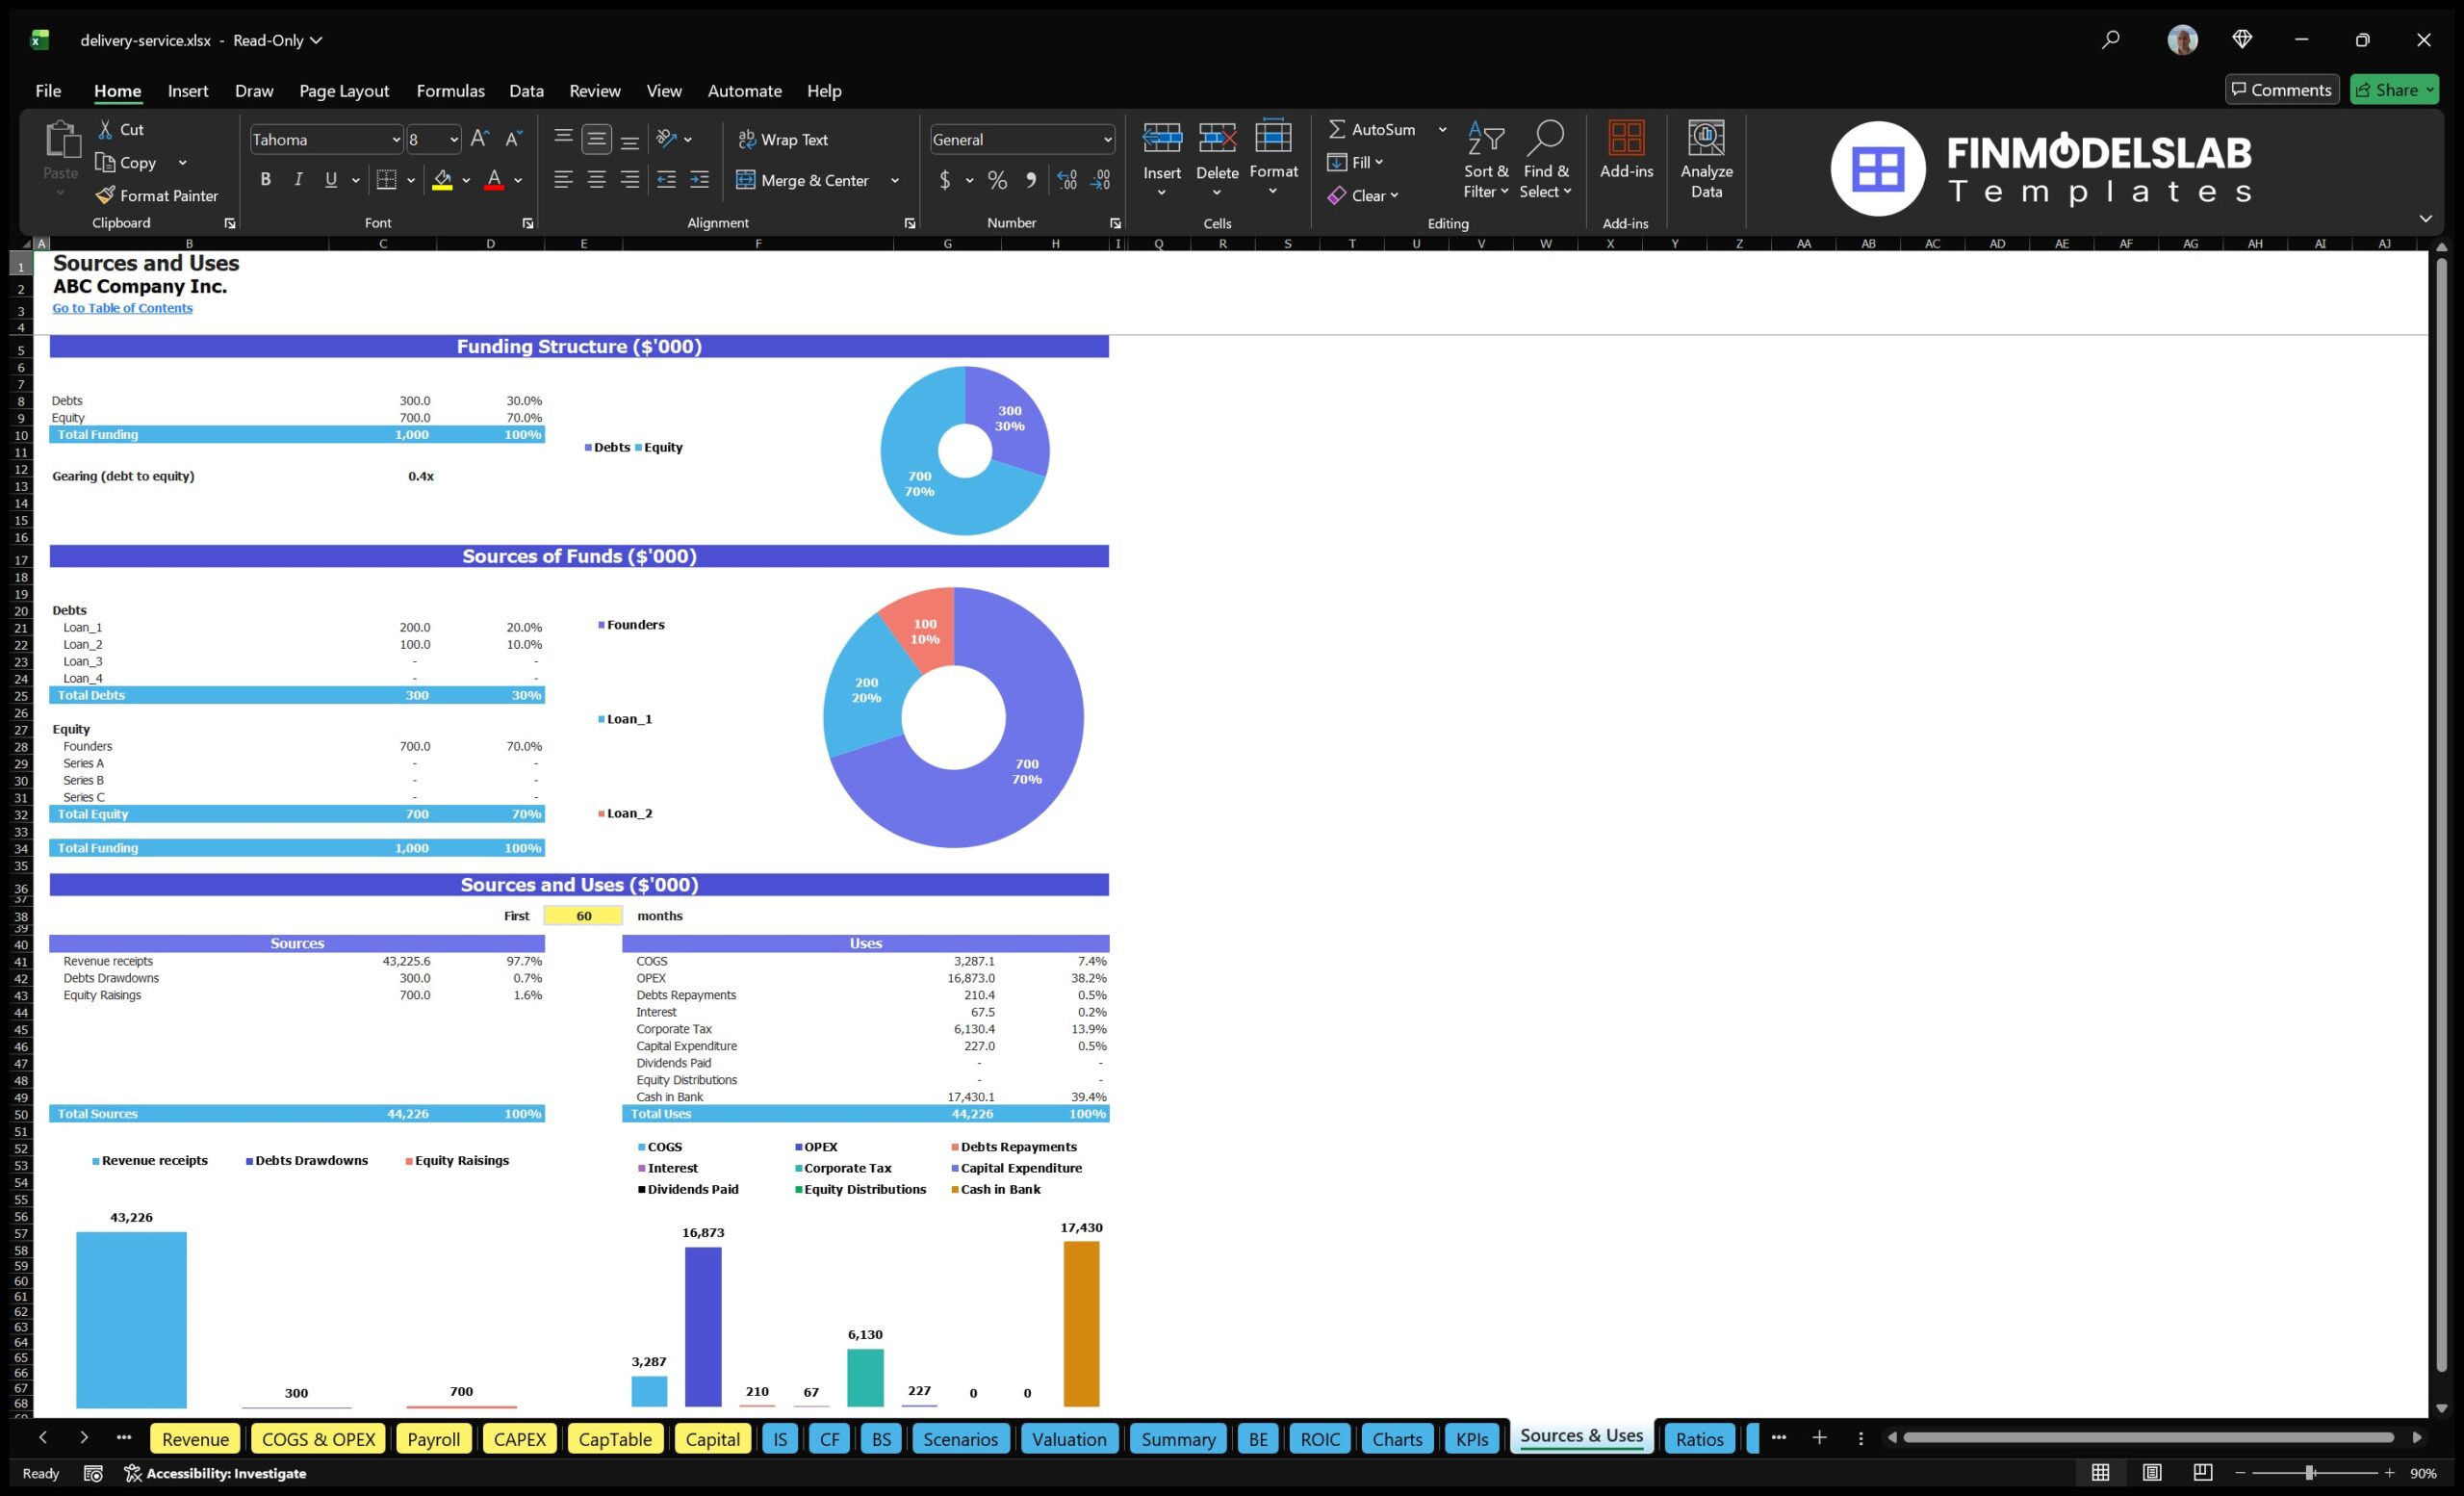
The startup cost and funding requirements component helps users estimate the capital needed to launch and support the delivery service through its early operating period. Startup costs for a delivery service may include server infrastructure, software development tools, branding, website or app development, office setup, employee laptops and workstations, licenses, legal fees, deposits, initial marketing, recruitment, customer support systems, and working capital reserves. This section organizes those one-time and early-stage costs so users can understand how much money may be required before the business reaches stable revenue and positive cash flow. It can also incorporate the projected cash burn from operating losses, helping users estimate not only the launch budget but also the total funding requirement needed to bridge the gap to profitability. This is critical for avoiding undercapitalization, which is a common risk for early-stage delivery and logistics businesses. The component helps founders prepare fundraising targets, lenders evaluate capital needs, and management teams decide how to phase spending. By clarifying startup investment, cash reserves, and funding requirements, this section supports more realistic launch planning and stronger financial decision-making.
File types:
Excel – Single-User: .xlsx
Excel – Multi-User: .xlsx
Similar ProductsOther customers were also interested in...


 HenrySheykin
Bicycle Courier Financial Model Excel Template
The Cargo Bike Courier Financial Model helps users turn a sustainable last-mile delivery concept int... Read more
Trucking Service Financial Model Excel Template
The Trucking Service Financial Model helps entrepreneurs, fleet owners, consultants, analysts, and b... Read more

 Giorgos
Courier / Delivery Service – 5 Year Financial Mo...
Financial Model providing an advanced 5-year financial plan for a startup or operating Courier / Del... Read more
 JILL LIU
ALL IN ONE Logistics & Transportation integra...
This is a dynamic and advanced DCF valuation model of Logistics and Transportation business with sce... Read more
Freight Brokerage Financial Model Excel Template
The Freight Brokerage Financial Model Financial Model Template helps entrepreneurs, founders, busine... Read more
Car Rental Financial Model Excel Template
The Car Rental Financial Model helps entrepreneurs, founders, business owners, consultants, and anal... Read more

Ambulance Service Financial Model Excel Template
The Ambulance Service Financial Model is a ready-to-use financial model template designed to help en... Read more

Logistics Agency Financial Model Excel Template
The Third-Party Logistics (3PL) Financial Model helps users turn a logistics business plan into a st... Read more
Limousine Taxi Financial Model Excel Template
The Limousine Service Financial Model helps entrepreneurs, operators, consultants, analysts, and fou... Read more
Mopeds Rental Financial Model Excel Template
The Scooter Rental Financial Model helps users turn a shared mobility or electric scooter rental con... Read more
You must log in to submit a review.