
0 ITEMS

Freight Brokerage Financial Model Excel Template
The Freight Brokerage Financial Model Financial Model Template helps entrepreneurs, founders, business owners, consultants, and analysts turn a freight brokerage concept into a structured financial forecast. Instead of relying on disconnected spreadsheets or rough estimates, users can work from a ready-to-use model designed around the economics of a freight brokerage platform, including transaction commissions, subscription revenue, seller extras, customer acquisition costs, payroll, operating expenses, startup costs, cash flow, and profitability. It is built to support business planning, funding preparation, internal budgeting, and strategic decision-making. This template is especially useful for anyone preparing a freight broker business plan, investor pitch, loan application, or expansion plan. It helps users define revenue assumptions, estimate order volume, test commission structures, plan staffing, and understand how operating expenses scale as the brokerage grows. The model provides a practical way to connect commercial activity with financial outcomes, allowing users to see how pricing, shipment volume, active buyers, carriers, technology costs, marketing spend, and team growth influence revenue, margins, EBITDA, and cash requirements over time. The Freight Brokerage Financial Model Financial Model Template is fully editable and designed for use in Microsoft Excel and Google Sheets, making it accessible for both finance professionals and non-financial users. Buyers can customize the assumptions to reflect their own market, business model, launch strategy, and growth targets. The template supports up to five years of projections, helping users evaluate short-term startup needs as well as long-term profitability and return potential. It also includes structured outputs that can be used in stakeholder discussions, lender conversations, investor presentations, and management reviews. By organizing financial planning into a clear and connected model, this template helps users answer the questions that matter before committing capital or scaling operations. It supports cash flow forecasting, break-even analysis, payroll planning, expense budgeting, profitability review, scenario testing, and KPI tracking. Whether you are launching a new freight brokerage, building a digital logistics marketplace, refining a freight agent financial projection, or evaluating funding needs, this model gives you a professional framework for making better decisions with clearer numbers.
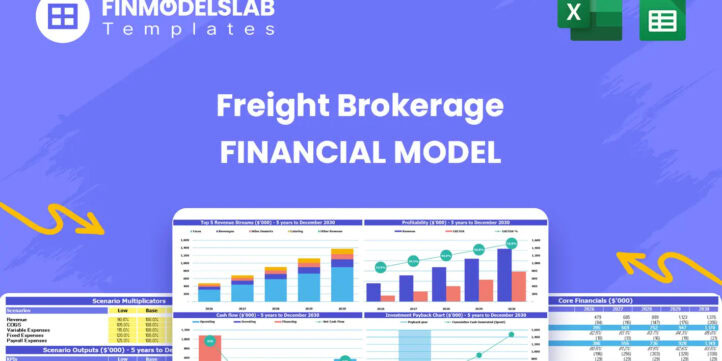


Freight Brokerage Financial Model Overview
The Freight Brokerage Financial Model Financial Model Template is a ready-to-use planning tool built for entrepreneurs, founders, freight brokerage operators, logistics consultants, business analysts, and anyone preparing a funding document or business plan for a freight brokerage business. It brings the major financial drivers of a brokerage operation into one structured model, including freight transaction revenue, shipper and carrier subscriptions, premium service fees, customer acquisition costs, payroll, overhead, capital expenditures, cash flow, profitability, and investment returns. Rather than starting with a blank spreadsheet, users can begin with a framework that reflects how a freight brokerage platform or agency may actually generate revenue, manage costs, and scale over time. The model is fully editable, compatible with Excel and Google Sheets, and designed to help users test assumptions, prepare projections, explain funding needs, and make better decisions before launch, during growth, or when presenting to investors and lenders.
All-in-one Dashboard
The all-in-one dashboard gives users a central view of the most important inputs and outputs in the Freight Brokerage Financial Model Financial Model Template. This component is designed to help users quickly understand how the core assumptions connect to projected performance without moving through every detailed calculation tab. It may summarize starting assumptions such as launch timing, revenue drivers, customer activity, operating cost levels, payroll structure, capital expenditure needs, and financing requirements, then translate those inputs into outputs such as revenue, EBITDA, net profit, cash balance, payback timing, and return metrics. For a freight brokerage, this is especially useful because the business depends on multiple moving parts, including shipment volume, commission rates, order values, subscription adoption, carrier participation, and support capacity. The dashboard helps founders and managers see the overall financial story at a glance, identify areas that need adjustment, and prepare for investor or lender conversations with a clearer view of the business model. It also makes the template easier to use for non-financial users, because the dashboard organizes key results into a practical decision-making view rather than requiring users to interpret raw spreadsheet outputs. By consolidating the major metrics in one place, this component supports faster planning, cleaner reviews, and more confident financial discussions.
Low Base High Scenario Analysis
The low, base, and high scenario analysis component helps users evaluate how the freight brokerage may perform under different business conditions. Instead of relying on a single forecast, the model allows users to compare conservative, expected, and optimistic cases based on changes in assumptions such as active buyers, order frequency, average order value, commission rates, subscription conversion, customer acquisition costs, payroll growth, and operating expenses. This is valuable because freight brokerage performance can vary significantly depending on market demand, carrier availability, marketing efficiency, sales execution, and the speed at which shippers adopt the platform or service. A low case may show what happens if acquisition is slower or margins are tighter, while a base case can represent the expected plan and a high case can show the upside if volume scales faster or premium services gain traction. This component helps users understand risk, prepare contingency plans, and answer stakeholder questions about downside protection and upside potential. It is also useful when preparing a funding request, because investors and lenders often want to know whether the business can survive slower growth or higher expenses. By comparing multiple cases in one model, users can make more realistic decisions about staffing, marketing spend, cash reserves, pricing, and fundraising strategy.
Professional Charts
The professional charts component turns the financial projections into presentation-ready visuals that help users communicate the freight brokerage forecast more clearly. Financial models often contain large amounts of data, but investors, lenders, partners, and internal teams usually need a quick way to understand trends and priorities. This component may visualize revenue growth, gross margin, EBITDA, net income, cash balance, operating expenses, cumulative cash flow, customer growth, or other relevant metrics over the forecast period. For a freight brokerage, charts can make it easier to explain how transaction commissions scale with freight volume, how subscription revenue contributes to stability, how startup losses narrow over time, and when the business begins generating positive operating cash flow. These visuals are useful in pitch decks, board updates, loan discussions, and management reviews because they translate spreadsheet outputs into a clearer financial narrative. They can also help users identify patterns that may be less obvious in rows of numbers, such as a cash shortfall before break-even, an expense category growing too quickly, or the point where operating leverage begins to improve margins. Because the charts are linked to the model’s assumptions and outputs, changes to the financial plan can be reflected in the visuals, helping users maintain consistent and updated presentation materials as the plan evolves.
ROE Components and DuPont Analysis
The ROE components and DuPont analysis section helps users understand what drives return on equity within the freight brokerage business. Return on equity is an important investor metric because it shows how efficiently the business uses shareholder capital to generate profit. The DuPont framework breaks this return into underlying components, often including profit margin, asset efficiency, and financial leverage, so users can see whether returns are being driven by stronger profitability, better use of assets, or changes in capital structure. For a freight brokerage, this analysis is useful because the business may require upfront investment in platform development, marketing, payroll, office setup, and working capital before reaching profitability. The model can help users examine how improving commission margins, increasing average order value, controlling operating costs, and scaling revenue without proportional increases in overhead may strengthen equity returns over time. It can also support discussions around funding structure, because the amount of equity raised and the way capital is deployed can influence long-term shareholder returns. This component is valuable for founders, investors, and analysts who want to move beyond basic revenue and profit projections and evaluate whether the business creates an attractive financial return. By showing the drivers behind ROE, the model helps users identify the operational levers that matter most for improving financial performance.
Revenue Inputs
The revenue inputs component provides a structured area for defining the assumptions that drive the Freight Brokerage Financial Model Financial Model Template. Freight brokerage revenue can come from several sources, including transaction commissions, fixed shipment fees, percentage-based take rates, shipper subscription fees, carrier subscription fees, promoted listings, advertising, premium analytics, or other value-added services. This section helps users enter assumptions such as the number of active buyers, order frequency by customer segment, average order values, commission rates, subscription pricing, user growth, and adoption of premium services. These inputs are especially important because small changes in shipment volume, order value, or take rate can have a meaningful impact on projected revenue and profitability. The model may also allow users to adjust assumptions over time, reflecting improvements in customer acquisition, stronger enterprise accounts, expansion into new freight categories, or better monetization of carrier services. By separating the assumptions from the outputs, this component makes the model easier to customize and audit. It allows founders to build a forecast based on their actual strategy instead of relying on generic revenue estimates. For business planning and investor preparation, the revenue inputs section helps users explain how the brokerage makes money, what drives growth, and which assumptions must be achieved for the plan to succeed.
Bank-Ready Reports
The bank-ready reports component organizes the model’s financial outputs into a format that can support lender reviews, loan applications, investor discussions, and formal business planning. These reports may include projected profit and loss statements, cash flow statements, balance sheets, financing summaries, revenue schedules, cost summaries, and key financial metrics over a multi-year forecast period. For a freight brokerage business, lenders and funding partners often want to see whether the company can cover operating expenses, manage cash burn, reach break-even, repay financing, and maintain enough liquidity during the early growth period. This component helps users present those answers in a clean and structured way. It can show how revenue grows from freight transactions and subscriptions, how direct costs and operating expenses affect margins, how payroll expands with the team, and how capital expenditures influence cash needs. The value of this section is not only in generating financial statements, but in making the forecast easier for external reviewers to understand. A professional report structure helps reduce confusion, supports credibility, and gives users a stronger basis for funding conversations. It also helps internal teams monitor the plan over time, compare actual performance against projections, and update financial documents as assumptions change.
Revenue Breakdown
The revenue breakdown component provides a detailed view of the different income streams that make up the freight brokerage forecast. Instead of showing only total revenue, this section separates the business into its major revenue categories, such as transaction commissions, fixed fees per order, percentage take rates on gross merchandise value, shipper subscriptions, carrier subscriptions, premium listings, advertising, analytics tools, or other seller extras. This level of detail is important because each revenue stream may have different growth drivers, margins, pricing logic, and adoption curves. For example, transaction commissions may depend on active shippers, shipment frequency, and average order value, while subscriptions may depend on the number of paying users and the selected pricing tier. Premium services may grow as the platform gains carrier density and customer engagement. By breaking revenue into components, users can see which parts of the business contribute most to growth and which assumptions require closer validation. This section is useful for pricing strategy, sales planning, marketing budget decisions, and investor communication. It can also help users test strategic questions, such as whether the business should prioritize high-volume shippers, enterprise customers, subscription upgrades, or value-added carrier tools. A clear revenue breakdown makes the forecast more defensible because it shows the logic behind the top-line projection rather than presenting revenue as a single unexplained number.
KPI Dashboard
The KPI dashboard component focuses on the performance indicators that matter most for managing and evaluating a freight brokerage business. While financial statements show the overall outcome, key performance indicators help explain why those results are happening. This section may track metrics such as active buyers, active carriers, order frequency, average order value, gross merchandise value, commission rate, revenue per user, customer acquisition cost, payroll as a percentage of revenue, EBITDA margin, cash balance, payback period, and return on equity. It may also support benchmarking against industry expectations or internal targets, giving users a way to assess whether the business is performing realistically. For a freight brokerage, KPI tracking is critical because growth is not only about increasing revenue; it is also about maintaining healthy unit economics, controlling acquisition costs, building carrier capacity, and ensuring that service operations can support transaction volume. The KPI dashboard helps founders and managers monitor the health of the model, identify weak points, and prioritize actions. If customer acquisition costs are too high, the model can highlight the impact on profitability and cash flow. If order frequency rises or average order value improves, the dashboard can show how those improvements affect margins. This component supports ongoing decision-making and gives stakeholders a concise view of the business’s operational and financial performance.
Break-Even Analysis
The break-even analysis component helps users estimate when the freight brokerage can cover its costs and begin generating sustainable profit. This section typically compares projected revenue, gross margin, operating expenses, payroll, and cash flow to determine the point at which the business no longer depends on external funding or accumulated cash reserves to support operations. For a freight brokerage, break-even timing is especially important because the company may face meaningful upfront expenses, such as platform development, marketing launch costs, hiring, software systems, office setup, and early customer acquisition. Revenue may take time to build as shippers and carriers are onboarded, shipment volume grows, and recurring subscription income develops. The break-even section helps users understand the level of transaction volume, average order value, commission income, and subscription revenue needed to support the cost structure. It can also show how changes in pricing, customer acquisition cost, payroll growth, or overhead affect the path to profitability. This makes it useful for founders deciding how much capital to raise, for lenders assessing repayment capacity, and for managers evaluating whether the business plan is realistic. By identifying the break-even point and the assumptions behind it, the model helps users plan more carefully, reduce financial uncertainty, and make better decisions about spending, hiring, and growth strategy.
Similar ProductsOther customers were also interested in...



 Pushkar
Online Car Rental – 3 Statement Financial Mo...
Online Car Rental Platform Business Plan Model is a perfect tool for a feasibility study on launchin... Read more
 HenrySheykin
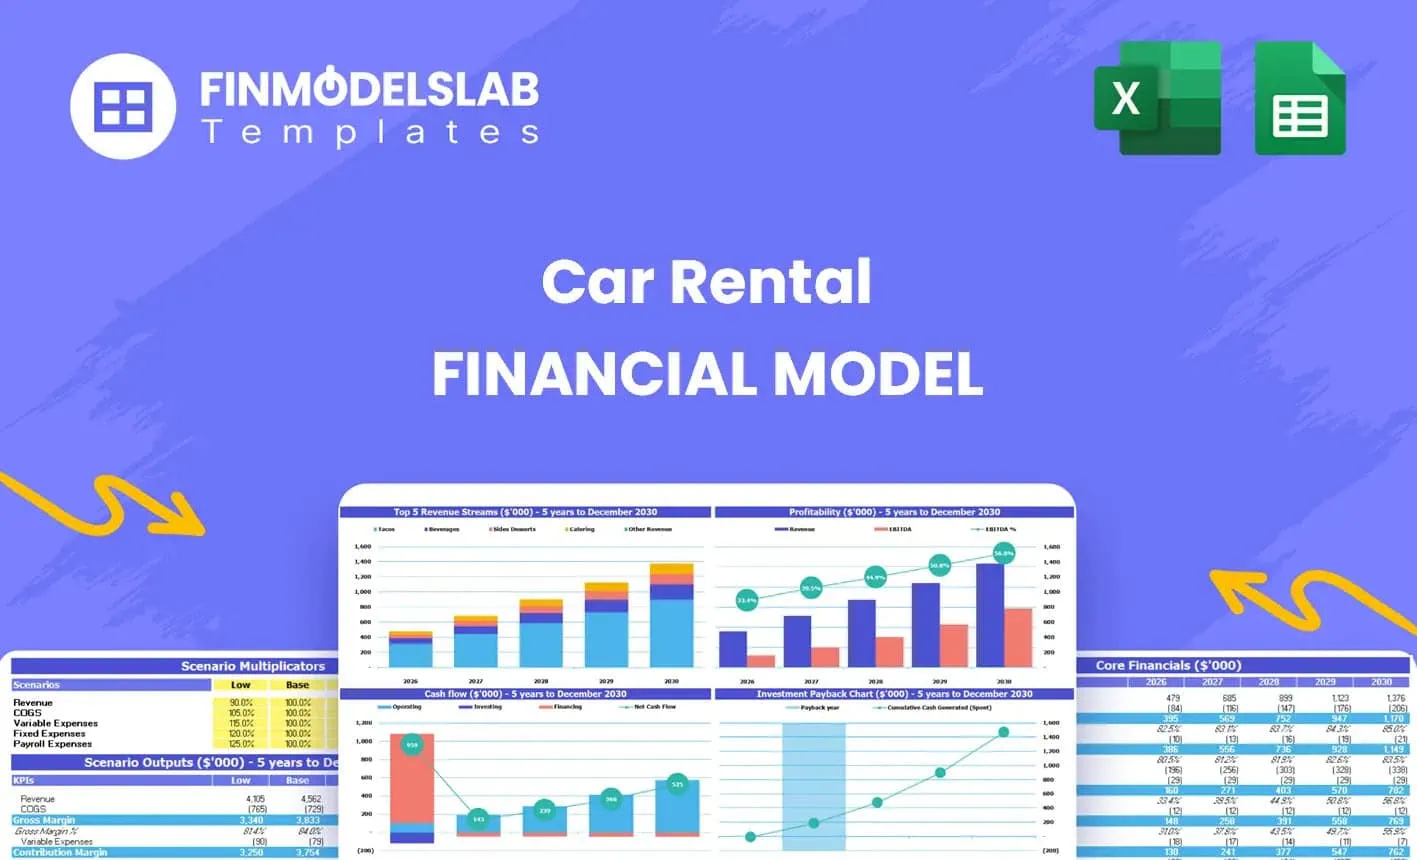
Car Rental Financial Model Excel Template
The Car Rental Financial Model helps entrepreneurs, founders, business owners, consultants, and anal... Read more
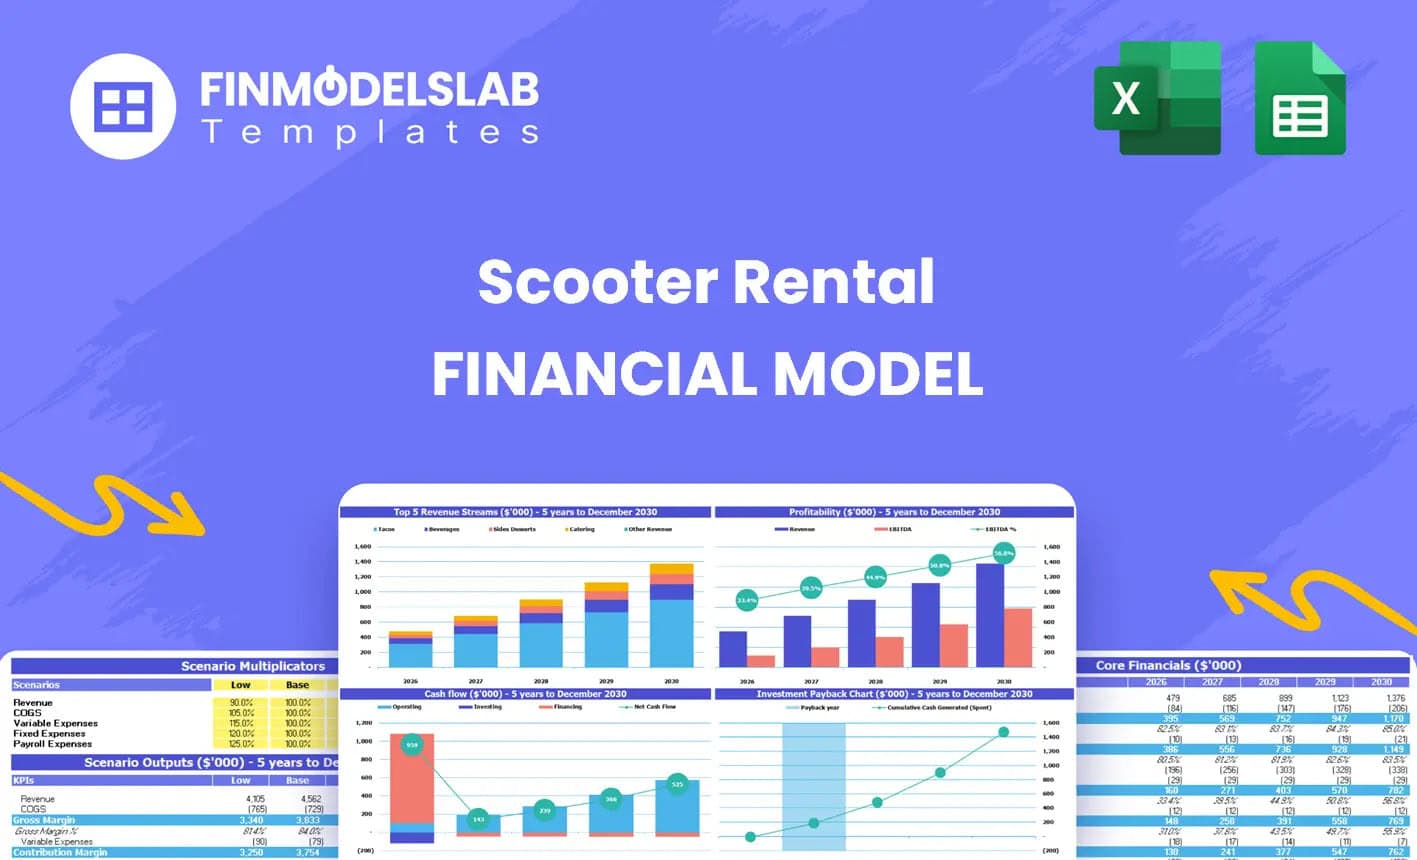
Mopeds Rental Financial Model Excel Template
The Scooter Rental Financial Model helps users turn a shared mobility or electric scooter rental con... Read more

Tow Truck Financial Model Excel Template
This Tow Truck Service Financial Model Template helps users turn a towing business idea into a struc... Read more

 eFinancialModels
Car Rental Business Financial Model
This Car Rental Business Financial Model Template in Excel offers an ideal basis for developing a bu... Read more

Private Aircraft Rental Company Financial Model
Embark on a journey to financial mastery with our Private Aircraft Rental Company Financial Model, w... Read more

Crane Rental Company Financial Model
Dive into the financial planning of your Crane Rental Company with our comprehensive 10-year monthly... Read more

 Giorgos
Cruise Line Company – Dynamic 10 Year Financial ...
The essential productive activity of the tourism industry, particularly as the consumption of experi... Read more

Trucking Company – 10 Year Financial Model
Financial Model providing a dynamic up to 10-year financial forecast for a startup or existing Truck... Read more
 Andreas
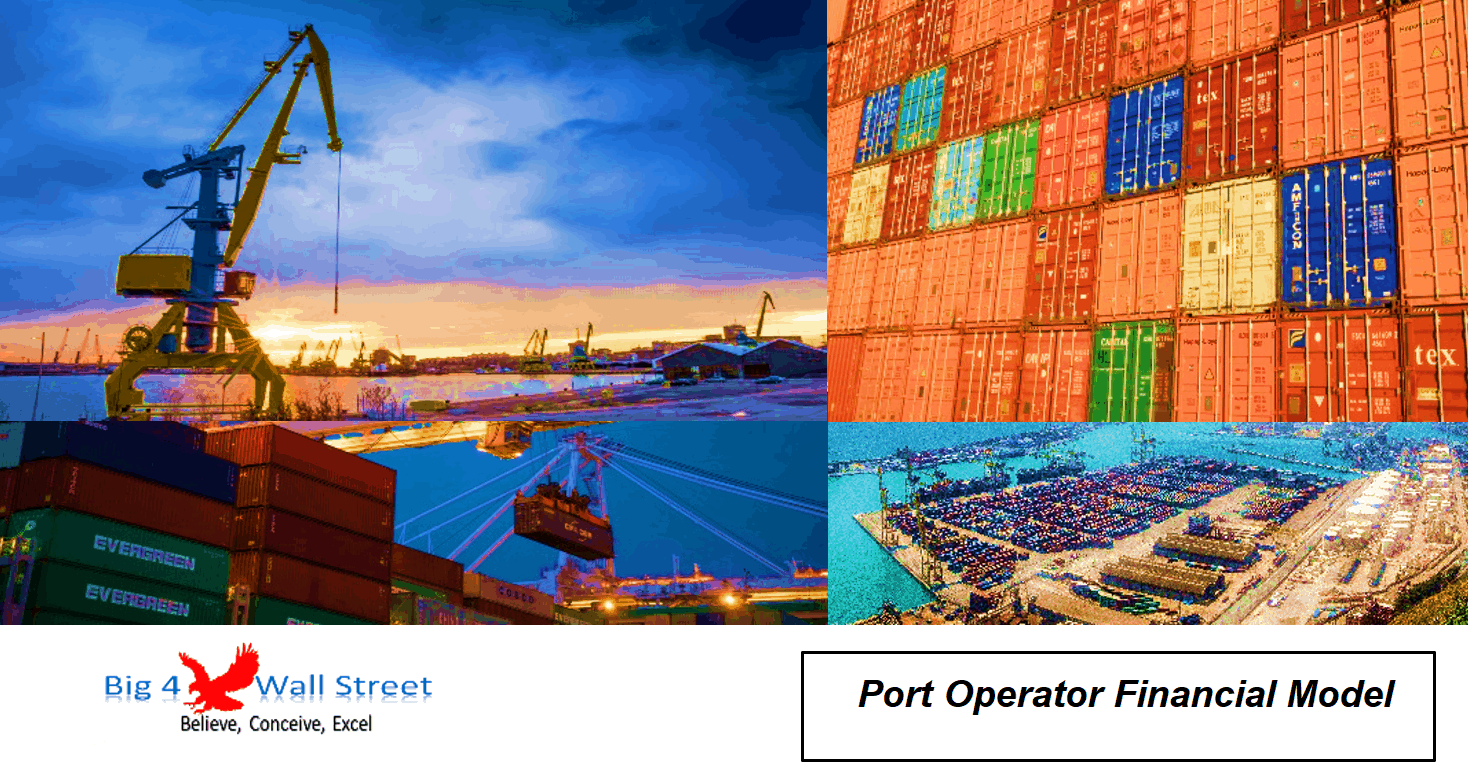
Port Operator Financial Model
Port Operator Financial Model presents the business case of an already operating port terminal (with... Read more
You must log in to submit a review.