
0 ITEMS

Tow Truck Financial Model Excel Template
This Tow Truck Service Financial Model Template helps users turn a towing business idea into a structured five-year financial forecast. It is built for entrepreneurs, towing company founders, business owners, consultants, analysts, and anyone preparing a business plan, loan package, investor presentation, or internal expansion plan. Instead of starting with a blank spreadsheet, users can work from a ready-to-use model designed around the operating realities of a tow truck service, including service calls, pricing, marketing efficiency, fleet investment, staffing, fuel, maintenance, insurance, and working capital needs. The template supports practical financial planning by connecting revenue assumptions with startup costs, operating expenses, payroll, cash flow, and profitability. Users can adjust assumptions such as emergency towing volume, roadside assistance demand, contract service activity, private property impound revenue, customer acquisition cost, fleet capacity, driver staffing, and cost structure. As assumptions change, the model helps show how those decisions may affect monthly and annual results, allowing users to evaluate whether the business can grow without running into avoidable cash shortages. For lenders, investors, and stakeholders, the Tow Truck Service Financial Model provides a clear view of the financial story behind the business. It helps estimate how much capital may be required to launch, when the company may reach break-even, whether EBITDA can become positive over time, and how cash flow may behave during the early growth period. The model is especially useful for an asset-heavy towing startup where fleet purchases, dispatch setup, storage lot infrastructure, and ongoing vehicle costs can materially affect funding needs and profitability. The template is also useful for decision-making after launch. Business owners can compare scenarios, review key performance indicators, test different pricing and service mix strategies, and evaluate whether to add more trucks, hire additional drivers, or pursue contract-based revenue. With editable assumptions, automated financial statements, dashboard views, charts, and lender-friendly outputs, this financial model template gives users a practical planning tool for building, reviewing, and presenting a more credible tow truck service forecast.


Financial Model Overview
The Tow Truck Service Financial Model Template gives entrepreneurs, towing company owners, consultants, analysts, and business planners a structured way to forecast the financial performance of a tow truck service before launch, expansion, or funding discussions. A towing business depends on more than simple sales estimates. It requires careful planning around service demand, hourly rates, fleet capacity, dispatch operations, driver payroll, fuel, maintenance, insurance, storage facilities, financing, and cash reserves.
This template brings those assumptions into one connected model so users can estimate revenue, startup investment, operating costs, cash flow, profitability, and investor or lender metrics over a five-year period. It is designed to be editable, practical, and presentation-ready, allowing users to replace generic assumptions with their own market data while still benefiting from a pre-built structure tailored to towing operations. Whether the goal is to secure a business loan, present to investors, evaluate a new fleet purchase, or understand the break-even path of a towing startup, the model helps turn operational plans into numbers that can be reviewed, tested, and explained with confidence.
All-in-One Dashboard
The all-in-one dashboard brings the most important inputs and outputs of the Tow Truck Service Financial Model into a single working view. This section is useful because a towing business has many moving parts, including service pricing, number of customers, marketing spend, acquisition cost, payroll, fleet costs, fuel, maintenance, insurance, and working capital requirements.
Instead of forcing users to search through separate worksheets to understand the overall picture, the dashboard summarizes core assumptions and key financial results in one place. Users can review high-level revenue expectations, cost behavior, EBITDA, cash position, funding needs, return metrics, and break-even timing while adjusting the drivers that matter most to their plan.
For business owners and advisors, this provides a fast way to evaluate whether the assumptions are realistic and whether the company has enough capital to survive the early growth period. For lenders and investors, the dashboard helps communicate the financial story clearly by showing how startup investment, operating performance, and cash flow connect. It also supports decision-making by allowing users to identify issues quickly, such as weak margins, excessive customer acquisition costs, high fixed expenses, or a future cash shortfall that may require additional financing.
Low Base High Scenario Analysis
The low, base, and high scenario analysis section helps users evaluate how the tow truck service may perform under different market conditions. A towing company can be affected by changes in call volume, fuel prices, driver availability, insurance costs, customer acquisition cost, contract wins, fleet utilization, and the timing of expansion.
This component allows users to compare a conservative case, an expected case, and an upside case without rebuilding the model from scratch. In the low scenario, users can stress-test the business against slower customer growth, higher costs, weaker marketing performance, or lower service call volume. In the base scenario, they can present a realistic operating plan based on current expectations.
In the high scenario, they can test what happens if marketing efficiency improves, contracts grow faster, routes are optimized, or fleet utilization increases. The outputs help show differences in revenue, profitability, cash flow, break-even timing, and funding requirements. This is especially valuable for funding conversations because lenders and investors often want to know what happens if assumptions do not go as planned. By comparing scenarios side by side, users can set realistic targets, plan reserves, determine when to add trucks or drivers, and make more disciplined decisions under uncertainty.
Professional Charts
The professional charts section converts the financial forecast into visual reports that are easier to review, explain, and present. A tow truck service financial forecast can include many detailed numbers across monthly and annual projections, but charts make trends easier to understand for owners, lenders, investors, and internal teams.
This component may visualize revenue growth, gross profit, EBITDA, net income, cash balance, operating expenses, funding needs, and service mix performance over the forecast period. It helps users see whether the business is moving toward profitability, whether cash flow is improving, and whether cost categories are scaling appropriately as revenue grows. For example, a chart may show early losses caused by fleet investment and startup expenses, followed by improving margins as service volume increases and fixed costs are spread across a larger revenue base.
These visual outputs are useful in business plans, pitch decks, lender meetings, and internal strategy sessions because they make the forecast more accessible to non-financial stakeholders. They also help identify problems that may not be obvious in rows of data, such as a cash trough, a delayed profitability point, or an expense category growing faster than revenue. By combining detailed calculations with presentation-ready visuals, this section helps users communicate the business case more professionally.
ROE Components and DuPont Analysis
The ROE components and DuPont analysis section helps users understand what drives return on equity in the tow truck service business. Return on equity is not just a single output; it is influenced by profitability, asset efficiency, and financial leverage. For a towing company, this is especially important because the business may require major investment in trucks, equipment, storage space, dispatch systems, and working capital before reaching stable profitability.
This component breaks down performance into underlying drivers so users can see whether returns are being limited by low margins, underutilized assets, excessive debt, or slow revenue growth. Inputs may include net income, total assets, equity, debt levels, revenue, expenses, and balance sheet assumptions. The resulting analysis can help users evaluate whether the company is generating enough profit relative to the capital invested and whether the fleet and operating assets are being used efficiently.
For investors, this provides a more sophisticated view of long-term financial performance than revenue growth alone. For business owners, it supports decisions about pricing, cost control, financing structure, and expansion timing. If ROE is weak, the model can help users test whether improving margins, increasing fleet utilization, reducing idle assets, or adjusting the funding mix could strengthen returns over time.
Revenue Inputs
The revenue inputs section is where users define the core commercial assumptions that drive the forecast for the tow truck service. This component may include service lines such as emergency towing, roadside assistance, contract services, and private property impound work, along with assumptions for hourly rates, customer acquisition cost, marketing budget, new customer volume, service mix, retention, and growth rates. In a towing business, revenue is not produced by a single product or a simple monthly subscription. It depends on how many service calls are generated, what type of services are requested, how much each service earns, how efficiently marketing creates demand, and whether the company can secure repeat business or contracts.
The template allows these assumptions to be edited so users can reflect their local market, pricing strategy, fleet size, and operating focus. Outputs from this section feed into the broader revenue forecast, profit and loss statement, cash flow statement, and dashboard metrics. This is valuable because revenue assumptions are often the first area that lenders and investors challenge. By clearly documenting the logic behind customer acquisition, service pricing, and revenue streams, users can build a more defensible forecast and test how changes in pricing, marketing spend, or service mix affect profitability and cash needs.
Bank-Ready Reports
The bank-ready reports section organizes the model’s financial outputs into a lender-friendly format that supports loan applications, funding discussions, and stakeholder review. Banks and financing partners typically want to see more than a revenue estimate. They need structured projections that show whether the business can cover operating costs, debt service, working capital needs, and future capital expenditures.
This component helps present financial statements and supporting metrics in a clean and professional way, including projected income statement results, cash flow forecasts, balance sheet outputs, profitability measures, funding requirements, and key operating assumptions. For a tow truck service, this is particularly important because lenders may focus on asset purchases, debt repayment capacity, cash flow stability, and the timing of break-even.
The reports help users demonstrate how the initial capital will be used, how revenue is expected to grow, when cash may be tight, and whether the company can remain liquid during the early stages. They also give consultants and founders a more polished foundation for business plans and financing documents. Because the outputs are linked to the model’s assumptions, users can update the forecast and quickly refresh the reports when lenders request a revised scenario, updated startup budget, or adjusted repayment plan.
Revenue Breakdown
The revenue breakdown section provides a detailed view of how each revenue stream contributes to total sales over time. A tow truck service may earn income from emergency towing, roadside assistance, contracted towing, vehicle recovery, private property impound work, and related services. Each of these activities may have different pricing, demand patterns, margins, growth potential, and operational requirements.
This component helps users avoid treating all revenue as one generic line item. Instead, it separates the business into meaningful service categories so users can understand which streams drive growth and which may need more investment or pricing attention. Inputs can include service rate, call volume, hours billed, number of customers, share of new business, utilization, and expected annual growth. Outputs may show monthly and annual revenue by stream, total revenue contribution, percentage mix, and changes in service composition over the forecast period.
This is useful for planning because different strategies produce different financial results. A business focused heavily on emergency calls may have different staffing and dispatch needs than one with municipal or commercial contracts. By reviewing the revenue breakdown, users can identify the most valuable services, test pricing changes, support marketing decisions, and create a more credible explanation of how the company expects to generate sales.
KPI Dashboard
The KPI dashboard tracks the performance metrics that matter most for managing and evaluating a tow truck service. While financial statements show the overall results, key performance indicators help explain why those results are happening. This component may include metrics such as revenue growth, gross margin, EBITDA margin, cash balance, customer acquisition cost, payback timing, service mix, fleet utilization, expense ratios, return metrics, and benchmark comparisons.
For an owner or founder, the KPI dashboard provides a quick way to monitor whether the business is moving in the right direction and whether operational assumptions are translating into financial progress. For example, if marketing spend increases but revenue does not grow as expected, the dashboard can highlight customer acquisition efficiency issues. If fuel and maintenance costs rise faster than revenue, it may signal a need for route optimization, preventive maintenance, or pricing adjustments.
For lenders and investors, KPIs make the forecast easier to evaluate because they summarize financial health and operating performance in a concise format. This section is also useful after launch because users can compare actual results against forecasted targets and update the model as the business gains real operating data. By combining financial metrics with operating benchmarks, the KPI dashboard supports ongoing management and more informed decision-making.
Startup Cost and Capital Investment Plan
The startup cost and capital investment plan helps users estimate how much money is required to open and prepare the tow truck service for operations. This component is essential because towing companies often require significant upfront investment before they generate revenue.
Inputs may include tow truck fleet purchases, down payments, vehicle equipment, storage lot infrastructure, dispatch center setup, licensing, permits, insurance deposits, technology, initial marketing, legal costs, office setup, uniforms, tools, working capital reserves, and other pre-opening expenses. The model organizes these items so users can separate one-time launch costs from recurring operating expenses and understand the total capital requirement. Outputs may include total startup funding needed, timing of cash outflows, capital expenditure summaries, and the amount that may need to be funded through owner equity, investor capital, vehicle financing, or bank debt.
This is valuable for budgeting because many new towing businesses underestimate early cash needs, especially when fleet acquisition and insurance costs are substantial. It is also useful for funding discussions because lenders and investors want to see a clear use of funds. By building a detailed startup cost plan, users can prepare a more realistic launch budget, reduce the risk of undercapitalization, and decide whether the initial fleet size and infrastructure plan are financially practical.
Break-Even Analysis
The break-even analysis section helps users estimate when the tow truck service may generate enough revenue to cover its fixed and variable costs. This component is important because a towing startup may operate at a loss in the early months while it builds call volume, hires drivers, pays for insurance, maintains vehicles, funds marketing, and covers facility costs.
Inputs may include pricing by service line, variable costs such as fuel and maintenance, fixed expenses such as rent and insurance, payroll, dispatch costs, marketing, loan payments, and expected service volume. The outputs may show the break-even month, the level of revenue required to cover costs, the number of service calls needed to reach sustainability, and how changes in price, volume, or expense structure affect the path to profitability.
Similar ProductsOther customers were also interested in...


 HenrySheykin
Freight Brokerage Financial Model Excel Template
The Freight Brokerage Financial Model Financial Model Template helps entrepreneurs, founders, busine... Read more

 Pushkar
Online Car Rental – 3 Statement Financial Mo...
Online Car Rental Platform Business Plan Model is a perfect tool for a feasibility study on launchin... Read more

 eFinancialModels
Crane Rental Company Financial Model
Dive into the financial planning of your Crane Rental Company with our comprehensive 10-year monthly... Read more
 Giorgos
Trucking Company – 10 Year Financial Model
Financial Model providing a dynamic up to 10-year financial forecast for a startup or existing Truck... Read more
Car Rental Financial Model Excel Template
The Car Rental Financial Model helps entrepreneurs, founders, business owners, consultants, and anal... Read more

Dump Truck Financial Model Excel Template
The Dump Truck Company Financial Model helps turn a hauling business idea into a structured, editabl... Read more
Mopeds Rental Financial Model Excel Template
The Scooter Rental Financial Model helps users turn a shared mobility or electric scooter rental con... Read more
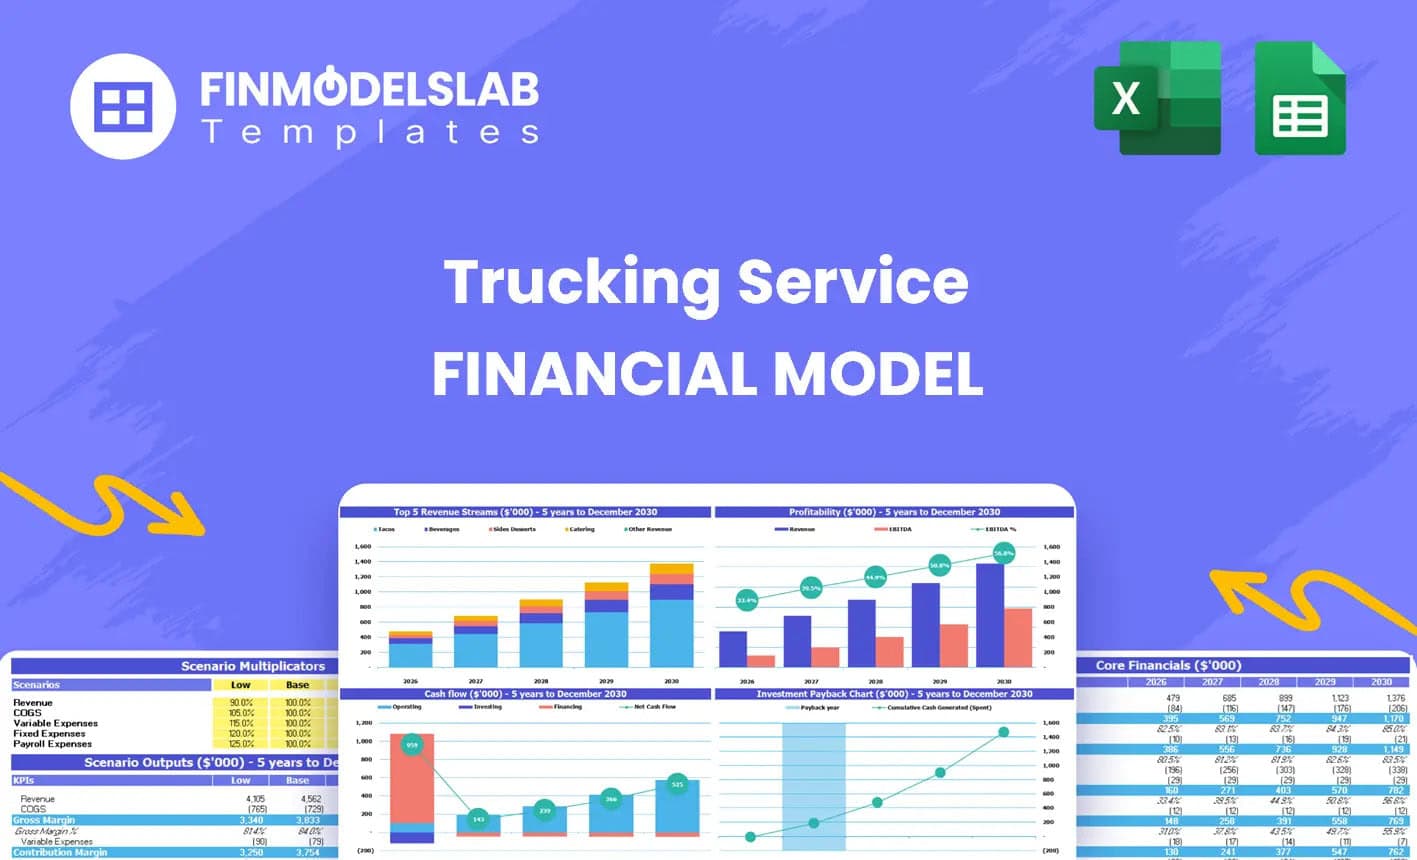
Trucking Service Financial Model Excel Template
The Trucking Service Financial Model helps entrepreneurs, fleet owners, consultants, analysts, and b... Read more
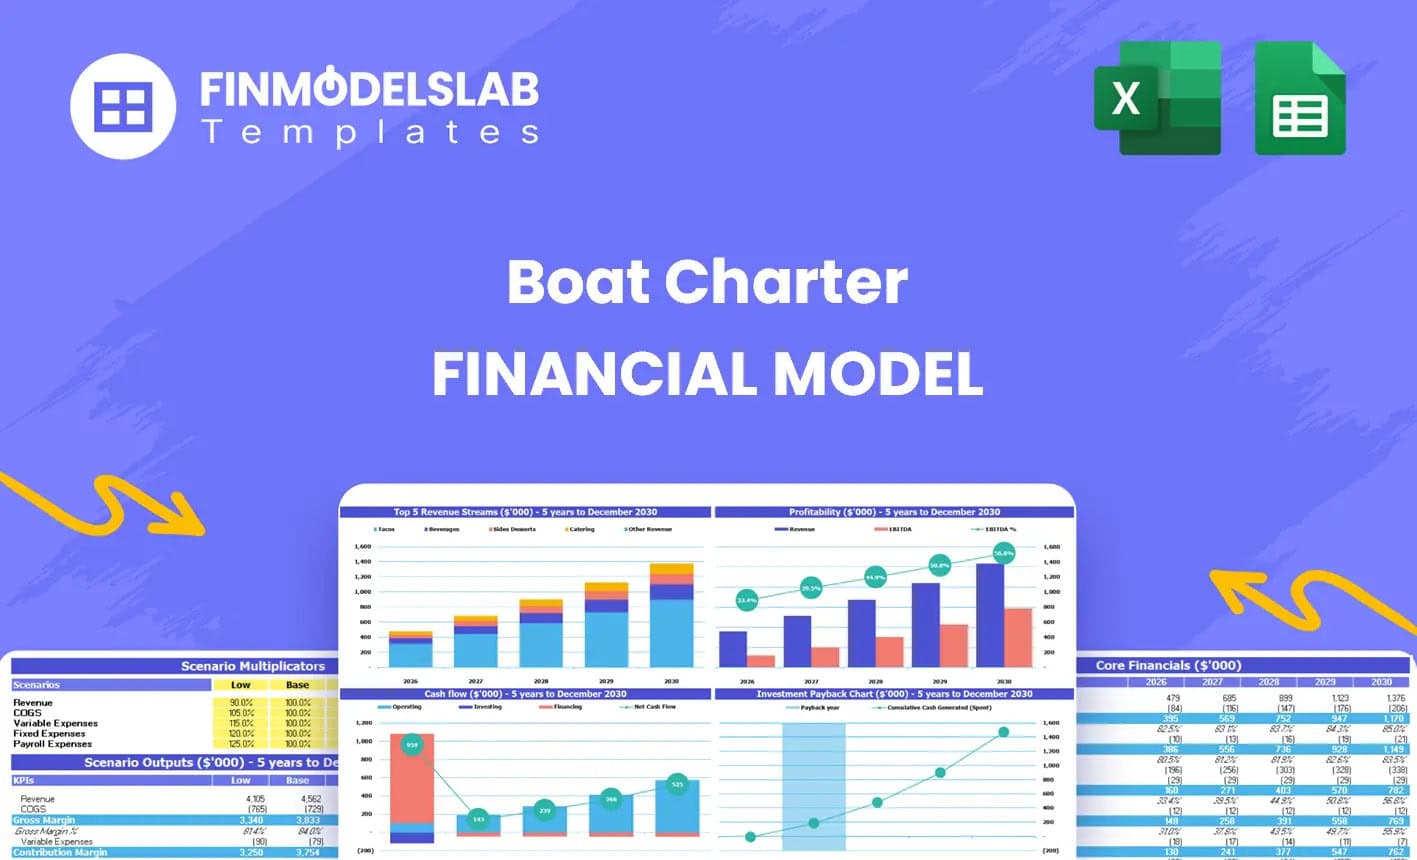
Boat Trip Financial Model Excel Template
The Boat Charter Financial Model Template helps entrepreneurs, founders, consultants, analysts, and ... Read more

Car Rental Business Financial Model
This Car Rental Business Financial Model Template in Excel offers an ideal basis for developing a bu... Read more
You must log in to submit a review.