
0 ITEMS

Ambulance Service Financial Model Excel Template
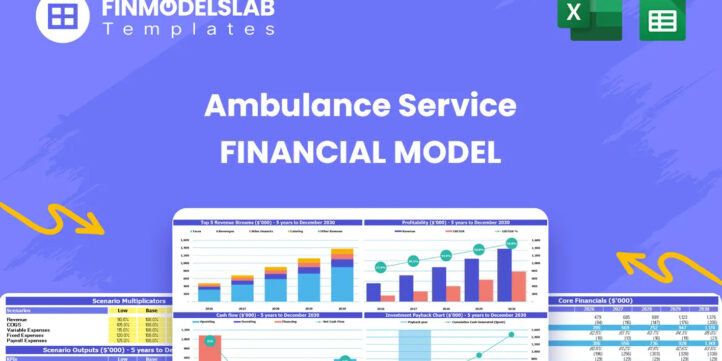
The Ambulance Service Financial Model is a ready-to-use financial model template designed to help entrepreneurs, operators, consultants, analysts, and business planners evaluate the financial potential of an emergency or non-emergency medical transport business. Instead of building a complex spreadsheet from scratch, users can work from a structured model that connects ambulance utilization, EMT and paramedic capacity, transport pricing, staffing plans, direct service costs, operating expenses, startup investment, cash flow, and profitability into one organized planning tool. This template is especially useful for founders preparing a medical transport business plan, existing ambulance service owners planning expansion, consultants supporting healthcare clients, and analysts creating investor or lender documents. It helps users translate operational assumptions into financial projections, making it easier to understand how many transports are needed, how pricing affects margins, how payroll impacts profitability, and whether the business can maintain enough cash to operate smoothly. The model is built for practical financial planning, with editable assumptions so users can adjust revenue assumptions, startup costs, reimbursement rates, utilization levels, payroll, vehicle costs, medical supplies, fuel, dispatch operations, and other business drivers. The Ambulance Service Financial Model supports decision-making by showing how the business may perform across revenue, expense, profit, and cash flow projections. Users can review profitability outlook, evaluate break-even analysis, understand funding requirements, and prepare bank-ready or investor-ready reports. The model can also help identify which assumptions matter most, such as staff utilization, transport volume, average price per transport, direct costs, and fixed overhead. This makes it valuable not only for launch planning, but also for budgeting, fundraising, pricing strategy, hiring decisions, and operational scaling. Because ambulance services involve significant upfront investment and ongoing cost management, a structured financial forecast is essential. This financial model template helps users organize their assumptions before committing capital, pitching stakeholders, or expanding operations. It provides a customizable framework for estimating five-year performance, reviewing cash flow dynamics, assessing profitability, and presenting a clear financial story to partners, lenders, investors, or internal decision-makers.


Financial Model Overview
The Ambulance Service Financial Model is a structured financial model template created for planning, launching, funding, or expanding an ambulance service business. Ambulance operations require careful coordination between staffing, vehicle capacity, medical equipment, dispatch activity, transport volume, reimbursement rates, fuel costs, direct supplies, and regulatory readiness, so a generic spreadsheet is rarely enough. This model helps users organize those moving parts into a practical five-year financial forecast that can support business planning, budgeting, investor discussions, lender review, and internal decision-making. Entrepreneurs can use it to estimate whether a new private ambulance service has a viable path to profitability, while existing operators can use it to test expansion plans, new service lines, additional vehicles, or improved utilization. The template is designed to be editable, so assumptions can be customized for local market conditions, emergency medical services operations, non-emergency medical transportation, hospital contracts, insurer reimbursement levels, payroll structures, and startup funding needs. By connecting revenue assumptions, costs, cash flow, profitability, break-even timing, and key performance metrics, the Ambulance Service Financial Model helps users replace guesswork with a more organized and presentation-ready financial planning process.
All-in-One Dashboard
The all-in-one dashboard gives users a central view of the most important inputs and outputs in the Ambulance Service Financial Model. Instead of searching through separate sheets for key assumptions, the dashboard is designed to summarize core drivers such as service pricing, practitioner count, transport capacity, utilization levels, startup investment, operating costs, revenue, profit, and cash position. For an ambulance service, this is especially useful because small changes in staff deployment, monthly transport volume, reimbursement rates, or vehicle availability can materially affect results. The dashboard helps users quickly understand whether the business model is financially balanced, whether projected revenue can support payroll and direct costs, and whether the company has enough liquidity to operate safely. It may include high-level outputs such as annual revenue, EBITDA, cash balance, profit margin, payback period, and return metrics, giving founders and stakeholders a fast overview before reviewing the detailed statements. This component is valuable for planning meetings, funding discussions, and management reviews because it turns a complex ambulance service forecast into a clear decision-making summary. It also helps non-financial users see how assumptions flow through the model, making the template easier to customize and explain to partners, advisors, lenders, or investors.
Low Base High Scenario Analysis
The low, base, and high scenario analysis component allows users to test how the ambulance service might perform under different operating and market conditions. The base case can represent the expected plan, while the low and high cases can reflect downside and upside situations based on changes in transport volume, utilization, average price per transport, reimbursement timing, staffing efficiency, fuel prices, medical supply costs, or vehicle capacity. This is important for ambulance service planning because demand can vary by contract mix, hospital relationships, local competition, payer type, call volume, and regulatory environment. A low scenario can help users understand what happens if patient transports grow more slowly, collections take longer, or fuel and payroll expenses increase. A high scenario can show the potential upside from stronger utilization, higher reimbursement rates, additional paramedic-led transports, or better dispatch efficiency. The output helps users compare revenue, cash flow, margins, and profitability across multiple cases, making it easier to identify risk, build contingency plans, and set realistic performance targets. For funding preparation, this section is particularly useful because lenders and investors often want to see that the business has been stress-tested rather than planned only under ideal assumptions. It gives the financial model more credibility and helps decision-makers understand both the risk profile and growth potential of the ambulance service.
Professional Charts
The professional charts component converts key financial projections into clear visual reports that can be used in presentations, business plans, funding decks, and stakeholder discussions. Ambulance service financials often involve multiple connected variables, including EMT-led transports, paramedic-led transports, driver-assisted transport activity, dispatch-coordinated services, direct costs, payroll, startup capital, cash flow, and profitability. Charts make these relationships easier to understand by presenting trends in revenue, expenses, gross profit, EBITDA, net income, cash balance, and growth over time. This component may include visual comparisons between years, revenue stream trends, margin development, cash flow movement, or scenario outputs, helping users communicate the financial story without overwhelming stakeholders with raw spreadsheet data. For entrepreneurs preparing investor materials, professional charts can make the model look polished and easier to defend in pitch conversations. For operators and managers, they help identify trends such as improving utilization, rising direct costs, changing margins, or increasing cash reserves. The value of this component is not just presentation quality, but also interpretation. By turning the forecast into visual metrics, users can spot patterns, explain assumptions more clearly, and show how operational decisions affect financial outcomes. This makes the Ambulance Service Financial Model more useful for both strategic planning and external communication.
ROE Components and DuPont Analysis
The ROE components and DuPont analysis section helps users understand what drives return on equity within the ambulance service financial forecast. Return on equity is an important investor metric because it shows how effectively the business may generate profit from the equity capital invested. A DuPont-style breakdown goes deeper by separating return performance into underlying components such as profitability, asset efficiency, and leverage. For an ambulance service, this can be especially helpful because the business may require significant upfront capital for ambulances, medical equipment, facility setup, dispatch systems, and working capital. The analysis can show whether projected return is being driven by strong margins, efficient use of assets, or the way the company is financed. Inputs may include net income, revenue, total assets, equity investment, debt assumptions, and balance sheet projections. Outputs can help users evaluate whether the business is producing an attractive return relative to its capital intensity. This is valuable for investor discussions, lender review, valuation work, and internal planning because it explains why return metrics are strong or weak rather than simply presenting a single percentage. If return on equity is lower than expected, users can examine whether pricing, utilization, cost control, fleet productivity, or financing structure needs to be adjusted. This makes the model more useful for both financial analysis and operational decision-making.
Revenue Inputs
The revenue inputs section is where users define the commercial assumptions that drive the ambulance service forecast. This component may include the number of EMTs, paramedics, drivers, dispatchers, monthly transport capacity, utilization rates, average price per transport, reimbursement assumptions, service categories, and growth expectations. In an ambulance service, revenue is closely tied to how many practitioners and vehicles are available, how efficiently they are scheduled, what type of transports they perform, and how much each transport generates. The model can support assumptions for EMT-led transports, paramedic-led transports, driver-assisted transports, dispatcher-coordinated services, or other medical transportation revenue streams. By entering these drivers, users can estimate monthly and annual revenue while clearly showing how operational capacity converts into sales. This is useful because it prevents revenue projections from being based on vague top-down assumptions. Instead, users can build a forecast from practical drivers such as staff count, monthly capacity, utilization, and price. The revenue inputs section also makes it easier to test the impact of changing reimbursement rates, adding new contracts, increasing utilization, or expanding the fleet. For business plans and funding documents, this component helps explain where revenue comes from and why the forecast is credible. It gives founders and analysts a structured way to connect market opportunity with operational reality.
Bank-Ready Reports
The bank-ready reports component provides lender-friendly financial outputs that can support loan applications, funding requests, and formal business planning. Ambulance services often require substantial startup or expansion capital for fleet purchases, medical equipment, facility improvements, dispatch infrastructure, insurance, licensing, and working capital. Banks and financing partners typically want to review organized projections that show revenue, expenses, profit, debt service capacity, cash flow, and balance sheet strength. This section helps users present financial information in a clear format that is easier for lenders to review. It may include projected profit and loss statements, cash flow statements, balance sheets, summary assumptions, funding requirements, and performance metrics over a five-year period. The reports help demonstrate whether the ambulance service can generate enough cash to cover operating expenses, repay debt, maintain liquidity, and support growth. This is particularly important when financing ambulances or specialized equipment, because lenders need to understand how those assets will contribute to revenue and cash generation. For entrepreneurs, the bank-ready format saves time and improves the professionalism of funding submissions. For consultants and advisors, it provides a structured output that can be customized for different financing scenarios. The result is a clearer, more credible financial package for discussions with banks, credit unions, private lenders, or other funding partners.
Revenue Breakdown
The revenue breakdown component gives users a more detailed view of how total income is built across the ambulance service’s different revenue streams. Rather than showing only one total revenue number, this section separates income by service type, practitioner category, or transport category so users can see which parts of the business contribute most to sales. For example, the model may distinguish between EMT-led transports, paramedic-led transports, driver-assisted services, and dispatcher-coordinated activity. It can also help analyze differences in price points, capacity, utilization, and growth assumptions across each service line. This is useful because not every ambulance service revenue stream has the same margin profile or operational requirement. Paramedic-led transports may command higher pricing but require more specialized staffing, while driver-assisted or non-emergency transport may rely more heavily on volume and scheduling efficiency. By breaking revenue into its components, users can identify which services are most important to profitability, which assumptions need further validation, and where growth opportunities may exist. This section can also support sales planning, contract strategy, staffing decisions, and marketing focus by showing the financial impact of each revenue stream. For investor or lender presentations, a detailed revenue breakdown makes the forecast easier to understand and defend because stakeholders can see the logic behind the total revenue projection.
KPI Dashboard and Performance Benchmarks
The KPI dashboard and performance benchmarks component helps users monitor the operational and financial metrics that matter most for an ambulance service. Key performance indicators may include transport volume, utilization rate, revenue per transport, revenue per practitioner, gross margin, EBITDA margin, payroll as a percentage of revenue, fuel cost ratio, medical supplies ratio, cash balance, and return metrics. Benchmarks can help users compare projected performance against industry-style assumptions or internal targets, making it easier to determine whether the plan is realistic. This is important because ambulance services can look profitable on paper while still struggling if utilization is too low, direct costs are too high, billing cycles are too slow, or staffing levels are not aligned with demand. The KPI dashboard brings these issues into focus by translating the financial forecast into measurable performance indicators. It helps founders and managers track whether the business is moving toward sustainable profitability and whether corrective actions may be needed. For example, if utilization is below target, the operator may need to improve hospital relationships, dispatch efficiency, marketing, or scheduling. If direct costs are above benchmark, the business may need to negotiate supplier pricing or optimize routes. This component is valuable for ongoing management, investor reporting, and strategic decision-making because it connects financial outcomes with operational performance.
Startup and Operating Cost Planning
The startup and operating cost planning component helps users estimate the capital required to launch the ambulance service and the ongoing expenses needed to keep it running. Startup costs may include ambulance purchases or leases, medical equipment, facility renovations, dispatch center setup, licensing, insurance deposits, technology systems, branding, initial marketing, legal and professional fees, and working capital reserves. Operating expenses may include payroll, rent, utilities, insurance, maintenance, fuel, medical supplies, billing support, administrative costs, software, compliance costs, and ongoing marketing. For an ambulance service, this section is essential because the business can be capital-intensive before revenue begins, and underestimating launch costs can create liquidity problems early in operations. The model helps users separate one-time startup investment from recurring monthly expenses, making the funding requirement clearer and more defensible. It can also help distinguish fixed costs from variable costs, which is useful when analyzing profitability and break-even points.
Similar ProductsOther customers were also interested in...



 HenrySheykin
Freight Brokerage Financial Model Excel Template
The Freight Brokerage Financial Model Financial Model Template helps entrepreneurs, founders, busine... Read more
Car Rental Financial Model Excel Template
The Car Rental Financial Model helps entrepreneurs, founders, business owners, consultants, and anal... Read more

Limousine Taxi Financial Model Excel Template
The Limousine Service Financial Model helps entrepreneurs, operators, consultants, analysts, and fou... Read more
Mopeds Rental Financial Model Excel Template
The Scooter Rental Financial Model helps users turn a shared mobility or electric scooter rental con... Read more

Concierge Service Financial Model Excel Template
The Concierge Service Financial Model helps entrepreneurs, founders, consultants, analysts, and busi... Read more

 eFinancialModels
Car Rental Business Financial Model
This Car Rental Business Financial Model Template in Excel offers an ideal basis for developing a bu... Read more

 Pushkar
Online Car Rental – 3 Statement Financial Mo...
Online Car Rental Platform Business Plan Model is a perfect tool for a feasibility study on launchin... Read more

 Giorgos
Driving School – 5 Year Financial Model
Financial Model providing an advanced 5-year financial plan for a startup or operating Driving Schoo... Read more

Car Rental Company Financial Model – Dynamic 10 ...
A Financial model presenting a business scenario of a Car Rental Company which offers Daily Car Rent... Read more

 City Finance
EV Charging Station Finance Model
Provides a comprehensive analysis of the financial viability and potential returns on investment for... Read more
You must log in to submit a review.