
0 ITEMS

Bicycle Courier Financial Model Excel Template
The Cargo Bike Courier Financial Model helps users turn a sustainable last-mile delivery concept into a structured financial forecast. It is designed for entrepreneurs, founders, business owners, consultants, analysts, and planners who need to evaluate a cargo bike delivery business before launch, expansion, investor discussions, or loan applications. Instead of starting from a blank spreadsheet, users get a ready-to-use planning framework that connects revenue assumptions, startup costs, operating expenses, payroll, cash flow, profitability, break-even analysis, and investor returns in one editable model. This financial model template is built around the real economics of a cargo bike courier operation, including order volume, seller and buyer activity, commissions, subscriptions, fixed fees, rider capacity, delivery density, fleet investment, platform setup, charging and storage infrastructure, marketing, payment fees, staffing, and ongoing operating costs. Users can adjust assumptions to match their own city, service area, pricing strategy, fleet size, customer segments, and growth plan. The model helps clarify how revenue is generated, how costs scale, and what level of demand is needed to support sustainable profitability. For business planning and funding preparation, the template gives users a practical way to present financial projections in a professional format. It supports five-year forecasting, scenario planning, dashboard review, KPI tracking, bank-ready reports, and investor-focused return metrics. This makes it useful for preparing a business plan, pitch deck financials, funding request, internal budget, or feasibility study for a micromobility delivery service. Users can review projected cash flow, understand funding needs, assess profitability timing, and identify the assumptions that have the greatest impact on performance. The Cargo Bike Courier Financial Model is fully customizable and compatible with Excel and Google Sheets, making it suitable for both individual founders and collaborative teams. It helps users make better decisions before committing capital, hiring riders, purchasing bikes, developing software, or scaling into new delivery zones. By organizing the key financial drivers of the business in one model, it gives buyers a clearer view of what it may take to launch, operate, and grow a cargo bike courier company with confidence.
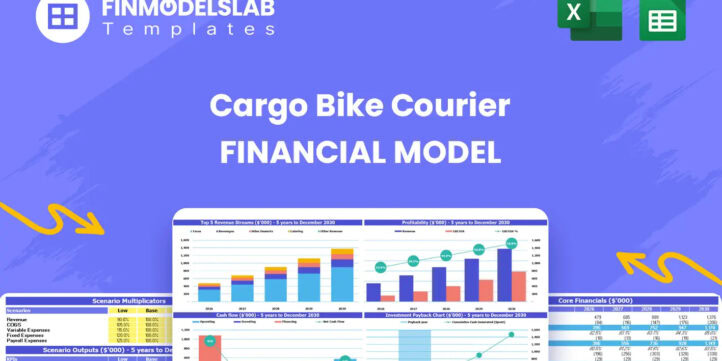


Financial Model Overview
The Cargo Bike Courier Financial Model is a ready-to-use financial model template created for entrepreneurs, founders, operators, consultants, and analysts planning a cargo bike delivery or micromobility courier business. It provides a structured way to forecast how the business may perform over time by connecting commercial assumptions, fleet requirements, startup investment, operating expenses, payroll, cash flow, profitability, and funding needs. A cargo bike courier company has a specific financial profile because revenue depends on order density, seller and buyer acquisition, delivery volume, pricing, service tiers, rider productivity, and local operating conditions. This template helps users organize those assumptions into a practical forecast that can support business planning, investor presentations, loan discussions, internal budgeting, and strategic decision-making. Because the model is editable, users can replace the built-in assumptions with their own pricing, market size, staffing plan, fleet costs, route strategy, and growth targets.
All-in-One Dashboard
The all-in-one dashboard brings the most important inputs and outputs into one central view so users can understand the financial direction of the cargo bike courier business without searching through multiple tabs. This component is useful for reviewing core assumptions such as revenue drivers, order growth, pricing, cost structure, capital needs, and operating performance alongside outputs such as revenue, gross margin, EBITDA, net income, cash balance, and return metrics. For a cargo bike courier operation, the dashboard helps connect operational decisions with financial outcomes, such as how adding more electric cargo bikes affects capacity, how subscription pricing changes recurring revenue, or how delivery density improves margins. It is especially valuable for founders and stakeholders who need a quick but structured view of the model before reviewing the detailed schedules. By consolidating key inputs and results, the dashboard supports faster decision-making, clearer planning conversations, and more professional presentation of the business case.
Low, Base, and High Scenario Analysis
The low, base, and high scenario analysis section allows users to evaluate how the business could perform under different market and operating conditions. Instead of relying on a single forecast, users can compare conservative, expected, and optimistic outcomes using different assumptions for customer acquisition, order volume, average order value, commission rates, subscription adoption, operating costs, staffing levels, and capital requirements. This is particularly important for a cargo bike courier business because performance can vary based on city density, weather, rider availability, merchant adoption, delivery zones, and competitive pressure from traditional courier services or larger delivery platforms. The scenario structure helps users understand the potential range of outcomes and identify whether the business remains viable if growth is slower or costs are higher than expected. It also supports investor and lender discussions because stakeholders often want to see that the financial plan has been stress-tested rather than built around only one optimistic forecast.
Professional Charts
The professional charts component translates the financial forecast into clear visual outputs that are easier to interpret, present, and discuss with stakeholders. Charts may show projected revenue growth, expense trends, EBITDA, net profit, cash balance, order volume, customer growth, or key margin development over the forecast period. For a cargo bike courier financial plan, visual reporting is useful because it helps show how the business scales as the fleet expands, delivery density improves, and recurring customer relationships grow. It can also highlight the timing of major cash requirements, profitability milestones, and operating leverage as fixed costs are spread across a larger volume of deliveries. These charts are designed to make the model more presentation-ready for business plans, pitch decks, lender meetings, internal reviews, and strategic planning sessions. By turning spreadsheet outputs into visual insights, this component helps users communicate the financial story of the cargo bike courier company more clearly and professionally.
ROE Components and DuPont Analysis
The ROE components and DuPont analysis section helps users evaluate the drivers behind return on equity by breaking performance into more detailed financial factors. Instead of looking only at a single return percentage, this component can help analyze how profitability, asset efficiency, and financial leverage contribute to overall shareholder returns. For a cargo bike courier business, this is useful because return performance depends not only on revenue growth but also on how efficiently the company uses its fleet, logistics platform, storage hubs, working capital, and operating resources. Inputs may include net income, revenue, assets, equity, margins, and balance sheet assumptions, while outputs can help show whether returns are being driven by strong operating margins, efficient use of assets, or capital structure decisions. This analysis is valuable for investors, founders, and financial analysts because it adds depth to the investment case and helps identify which operational or financing decisions may improve long-term returns.
Revenue Inputs
The revenue inputs section is where users define the key assumptions that drive sales for the cargo bike courier business. This may include seller acquisition, buyer acquisition, customer tiers, order volume, average order value, commission percentage, fixed fee per order, subscription pricing, seller extras, promotions, advertising services, and growth rates over time. In a cargo bike courier model, revenue is often generated from a mix of transaction-based income and recurring fees, so the input structure needs to capture more than a simple price multiplied by units. Users can adjust assumptions for local retail sellers, small businesses, e-commerce merchants, corporate clients, or other customer segments to reflect the business model they plan to operate. This component helps users test whether their pricing strategy and customer growth assumptions are realistic enough to support payroll, fleet costs, platform expenses, marketing spend, and overhead. It is one of the most important sections of the template because revenue assumptions flow through the entire forecast and shape profitability, cash flow, funding needs, and investor returns.
Bank-Ready Reports
The bank-ready reports component organizes forecast outputs into a format that can be used for lender discussions, funding applications, and formal business planning. These reports may include projected profit and loss statements, cash flow forecasts, balance sheet summaries, funding requirements, repayment capacity indicators, and key financial metrics that lenders typically review. For a cargo bike courier company, bank-ready reporting is useful because the business may require upfront capital for electric cargo bikes, logistics software, charging and storage infrastructure, insurance, marketing, and working capital before revenue reaches a stable level. The report structure helps users present how borrowed funds may be used, how the business expects to generate cash, and whether projected operations can support ongoing obligations. This component gives founders a more credible way to explain the financial plan to banks, grant providers, development funds, or other financing partners. It also helps business owners review whether their assumptions are strong enough to support external funding before approaching lenders.
Revenue Breakdown
The revenue breakdown section provides a detailed view of how total revenue is generated across different streams, customer types, and pricing mechanisms. Instead of presenting one combined sales figure, this component helps separate income from commissions, fixed delivery fees, seller subscriptions, buyer subscriptions, promotions, advertising, premium services, or other add-on revenue. For a cargo bike courier business, this level of detail is important because a diversified revenue mix can reduce dependence on one source of income and help management identify which channels are most profitable. Users can review how much revenue comes from order volume versus recurring subscriptions, whether certain customer segments contribute higher average order values, and how seller extras or corporate plans affect margins. The outputs can support pricing decisions, sales priorities, market positioning, and growth planning. A clear revenue breakdown also makes the forecast easier to explain to investors and stakeholders because it shows the underlying mechanics behind the top-line projection rather than relying on a broad revenue estimate.
KPI Dashboard
The KPI dashboard helps users track the performance indicators that matter most for a cargo bike courier operation. This may include revenue, EBITDA, cash balance, gross margin, customer acquisition cost, average order value, order volume, number of sellers, buyer activity, revenue per rider, cost per delivery, payback period, return metrics, and other operational or financial benchmarks. A courier business can look profitable at a high level while still facing problems in route efficiency, marketing efficiency, rider utilization, or unit economics, so KPI tracking is essential for informed decision-making. This component helps users monitor whether growth is being achieved efficiently and whether operational improvements are translating into better financial performance. It can also support comparisons against internal targets or industry benchmarks, helping users identify where assumptions may need adjustment. For founders and managers, the KPI dashboard provides an at-a-glance way to evaluate the health of the business, prepare stakeholder updates, and focus attention on the metrics that influence long-term sustainability.
Startup Cost Breakdown
The startup cost breakdown section helps users estimate the initial investment required to launch the cargo bike courier business before regular revenue generation begins. This may include the purchase or lease of electric cargo bikes, safety equipment, rider gear, charging infrastructure, storage hub setup, logistics platform development, software subscriptions, business registration, licenses, insurance deposits, branding, launch marketing, website setup, recruitment, training, and initial working capital. For this type of business, startup costs can be significant because the company often needs a functioning fleet, operational technology, and local infrastructure before it can serve customers reliably. This component helps users separate one-time capital expenditures from recurring operating expenses so they can understand how much funding is needed at the start and how that funding will be allocated. It is useful for founders preparing a business plan, estimating personal investment requirements, applying for financing, or deciding whether to launch with a lean pilot fleet before expanding to a larger service area.
Break-Even Analysis
The break-even analysis section helps users identify when the cargo bike courier business may stop generating losses and begin covering its costs through operating revenue. It can use assumptions such as fixed operating expenses, variable delivery costs, rider payroll, payment processing fees, marketing spend, platform costs, average order value, commission take rate, subscription revenue, and delivery volume to estimate the sales or order level required to reach break-even. This is especially useful for a cargo bike courier company because the path to profitability depends on balancing route density, fleet utilization, customer acquisition, and recurring revenue against the fixed costs of operations. The break-even output helps users understand how quickly the business must grow, what order volume is required, and which assumptions have the greatest influence on profitability timing. It can support decisions about launch strategy, pricing, marketing budgets, hiring, fleet purchases, and funding needs. For investors and lenders, break-even analysis also provides a clear milestone that shows whether the business model has a practical route toward financial sustainability.
File types:
Excel – Single-User: .xlsx
Excel – Multi-User: .xlsx
Similar ProductsOther customers were also interested in...


 HenrySheykin
Freight Brokerage Financial Model Excel Template
The Freight Brokerage Financial Model Financial Model Template helps entrepreneurs, founders, busine... Read more
Delivery Service Financial Model Excel Template
The Delivery Service Financial Model Financial Model Template helps founders, operators, consultants... Read more

Logistics Agency Financial Model Excel Template
The Third-Party Logistics (3PL) Financial Model helps users turn a logistics business plan into a st... Read more
Trucking Service Financial Model Excel Template
The Trucking Service Financial Model helps entrepreneurs, fleet owners, consultants, analysts, and b... Read more

 David
David
Ship Management Business 5-Year 3 Statement Financ...
5 year rolling financial projection Excel model for a startup or existing ship management business h... Read more
 Giorgos
Courier / Delivery Service – 5 Year Financial Mo...
Financial Model providing an advanced 5-year financial plan for a startup or operating Courier / Del... Read more
 JILL LIU
ALL IN ONE Logistics & Transportation integra...
This is a dynamic and advanced DCF valuation model of Logistics and Transportation business with sce... Read more

Cruise Line Company – Dynamic 10 Year Financial ...
The essential productive activity of the tourism industry, particularly as the consumption of experi... Read more
 eFinancialModels
Sailboat Rental Business Financial Model
This comprehensive 10-year monthly Excel template offers an ideal basis for developing a business pl... Read more
Reviews
You must log in to submit a review.