
0 ITEMS

Graphic Design Financial Model Excel Template
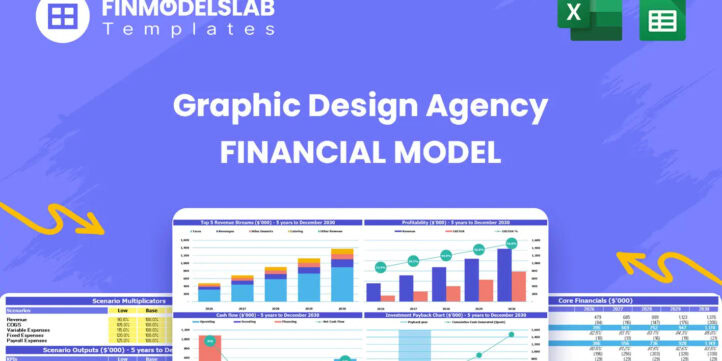
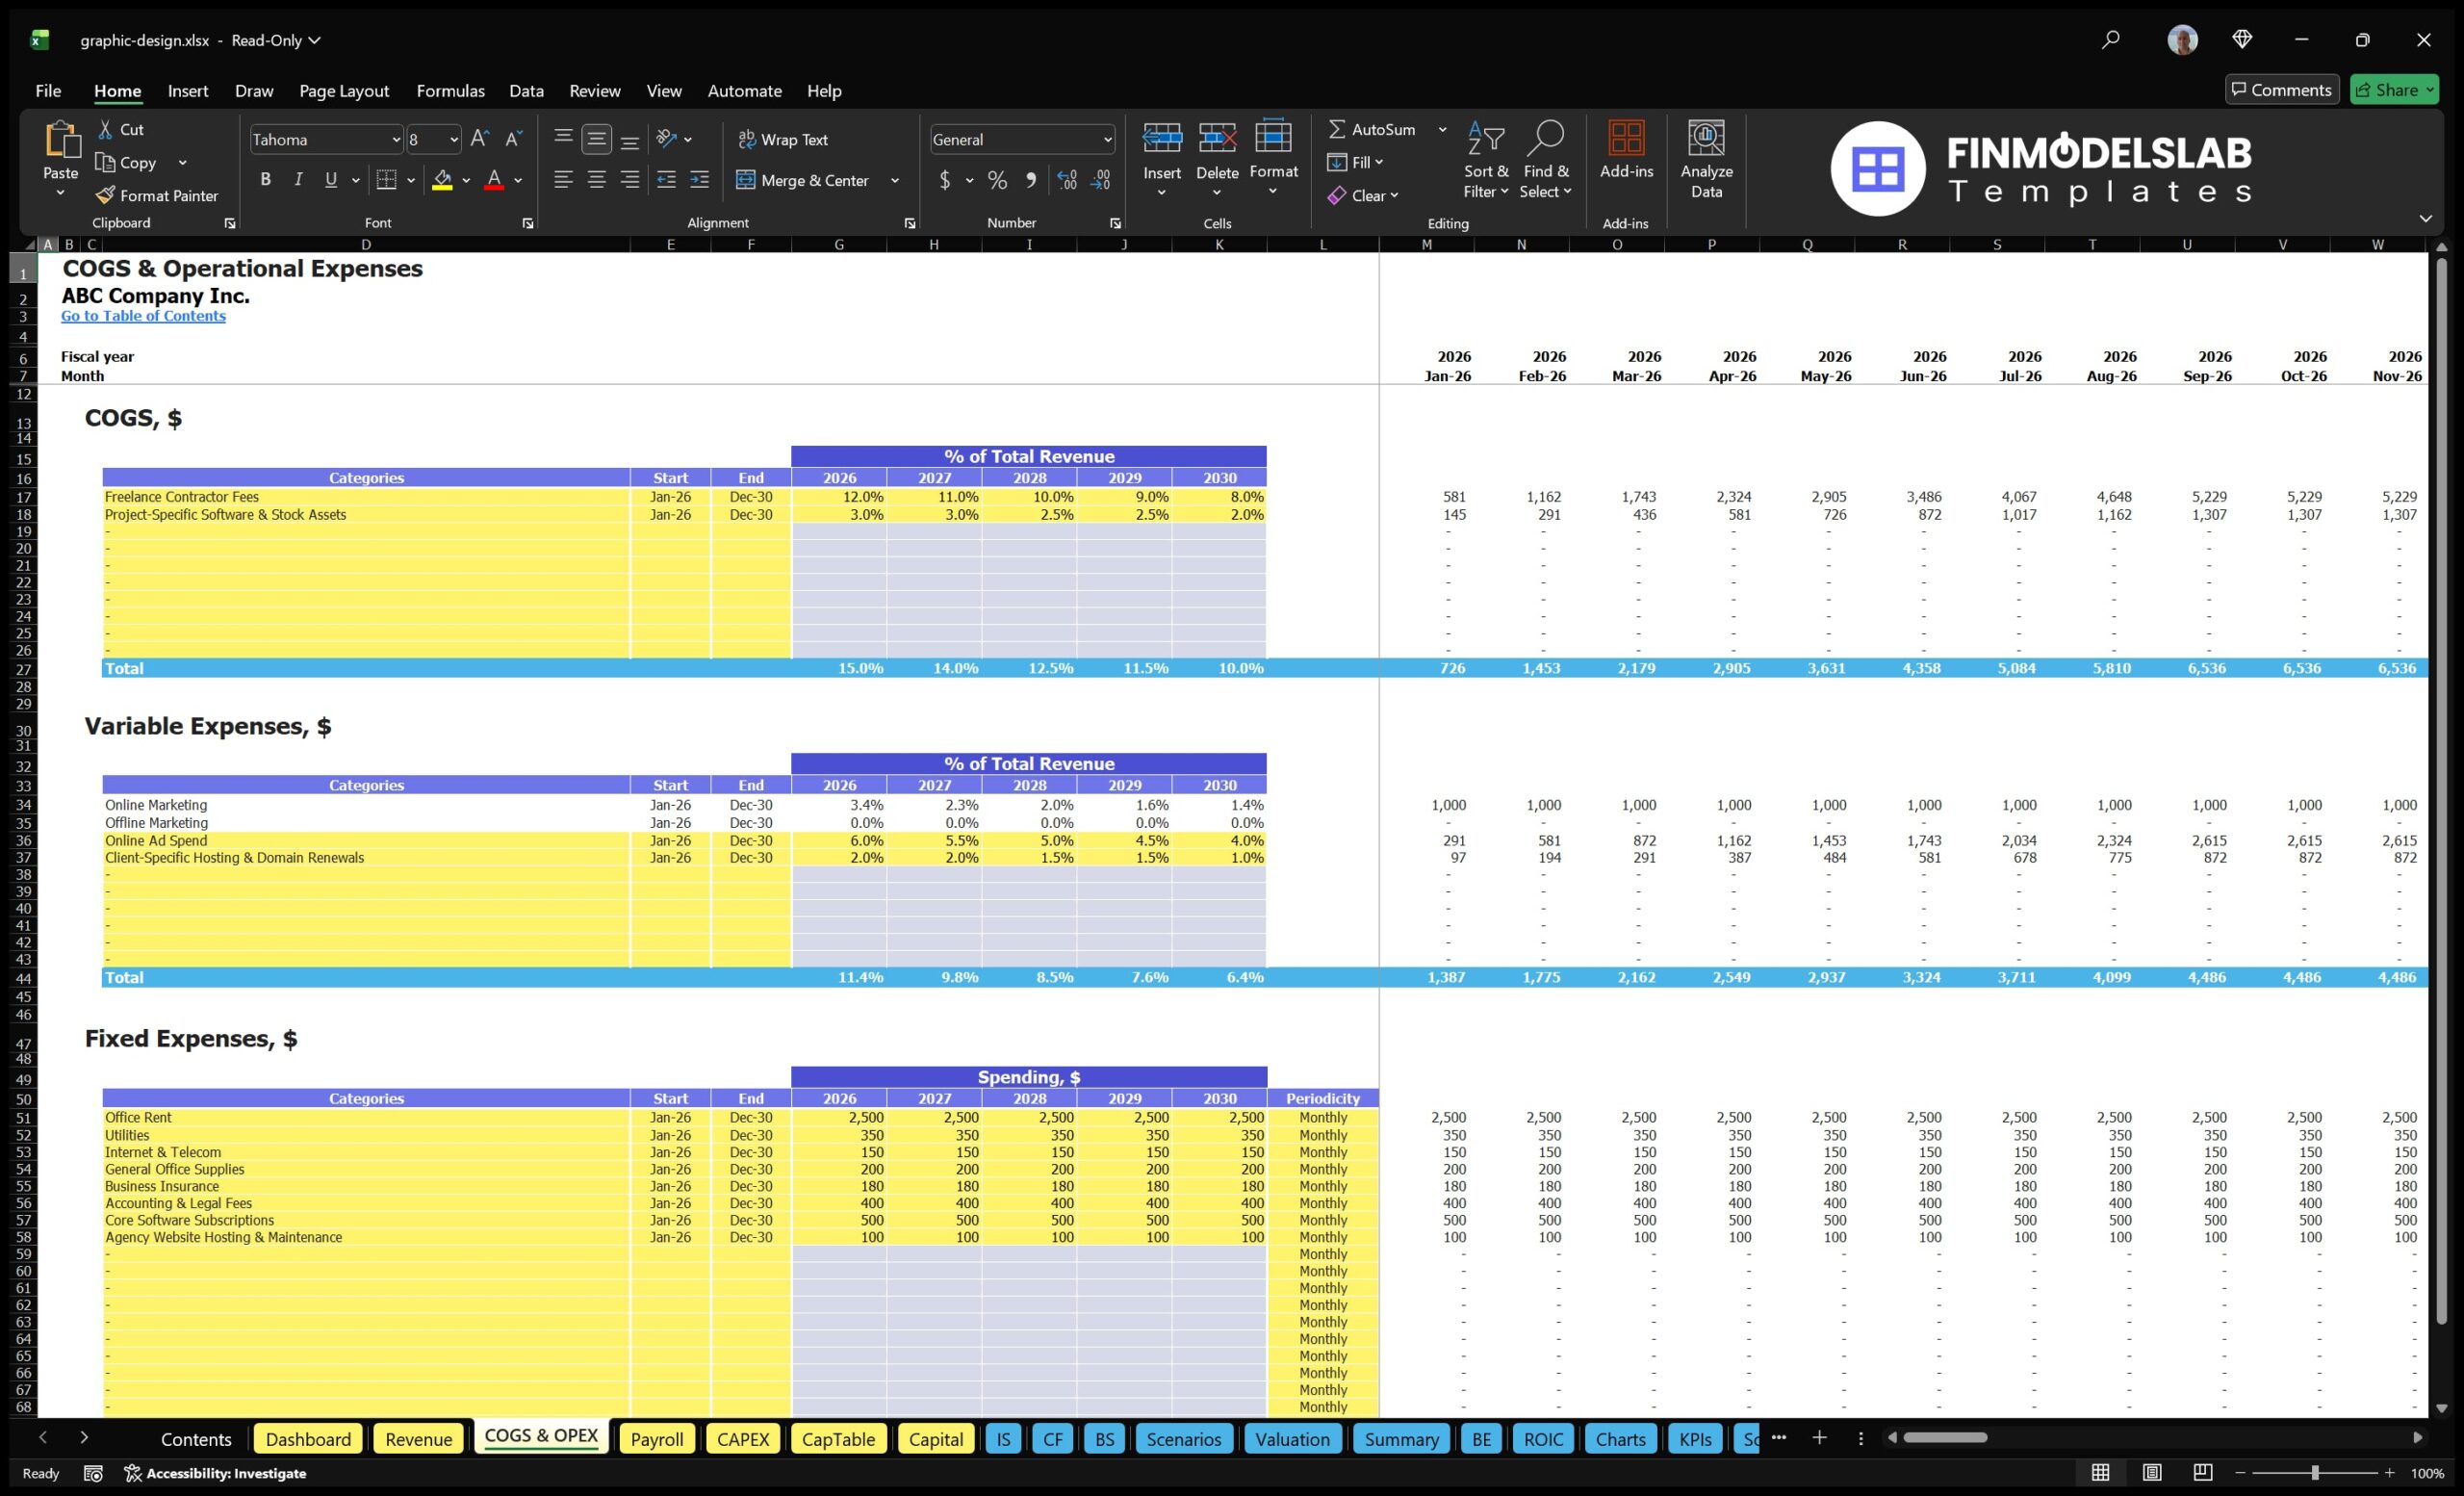
The Graphic Design Agency Financial Model Financial Model Template helps users turn a creative agency concept into a structured financial forecast that can be used for planning, budgeting, funding discussions, and internal decision-making. Instead of starting with a blank spreadsheet, buyers get a ready-to-use model built around the economics of a design agency, including project-based work, recurring retainers, staffing needs, freelance support, software costs, startup investment, and operating overhead. It is designed to help users estimate how much revenue the agency can generate, what it may cost to launch and operate, and when the business may become profitable. This template is useful for entrepreneurs launching a new design studio, existing agency owners planning expansion, consultants preparing client financial plans, analysts reviewing agency economics, and founders building business plans or investor documents. It brings together key planning assumptions such as active customers, billable hours, pricing, service mix, revenue growth, payroll, contractor costs, marketing spend, technology subscriptions, and working capital needs. By connecting those assumptions to projected revenue, expenses, cash flow, and profit, the model helps users understand the financial impact of strategic decisions before committing resources. The Graphic Design Agency Financial Model is also built to support practical financial planning. Users can review revenue assumptions, estimate startup costs, forecast operating expenses, plan payroll, evaluate cash flow, assess profitability, and understand the path to break-even. The model is especially helpful for comparing different business outcomes, such as conservative, expected, and growth-oriented scenarios, so users can see how changes in pricing, client acquisition, utilization, or hiring may affect performance. This makes it easier to prepare for funding conversations, lender reviews, stakeholder presentations, or internal planning meetings. Because the template is editable, users can adapt the forecast to their own agency structure, whether they focus on logo design, website builds, brand strategy, monthly retainers, or a mix of creative services. The model provides a professional framework for organizing assumptions and presenting results clearly, while still allowing customization for unique pricing models, team structures, and growth plans. For anyone preparing to launch, finance, or scale a graphic design agency, this financial model template offers a practical way to replace guesswork with organized projections and better decision-making.
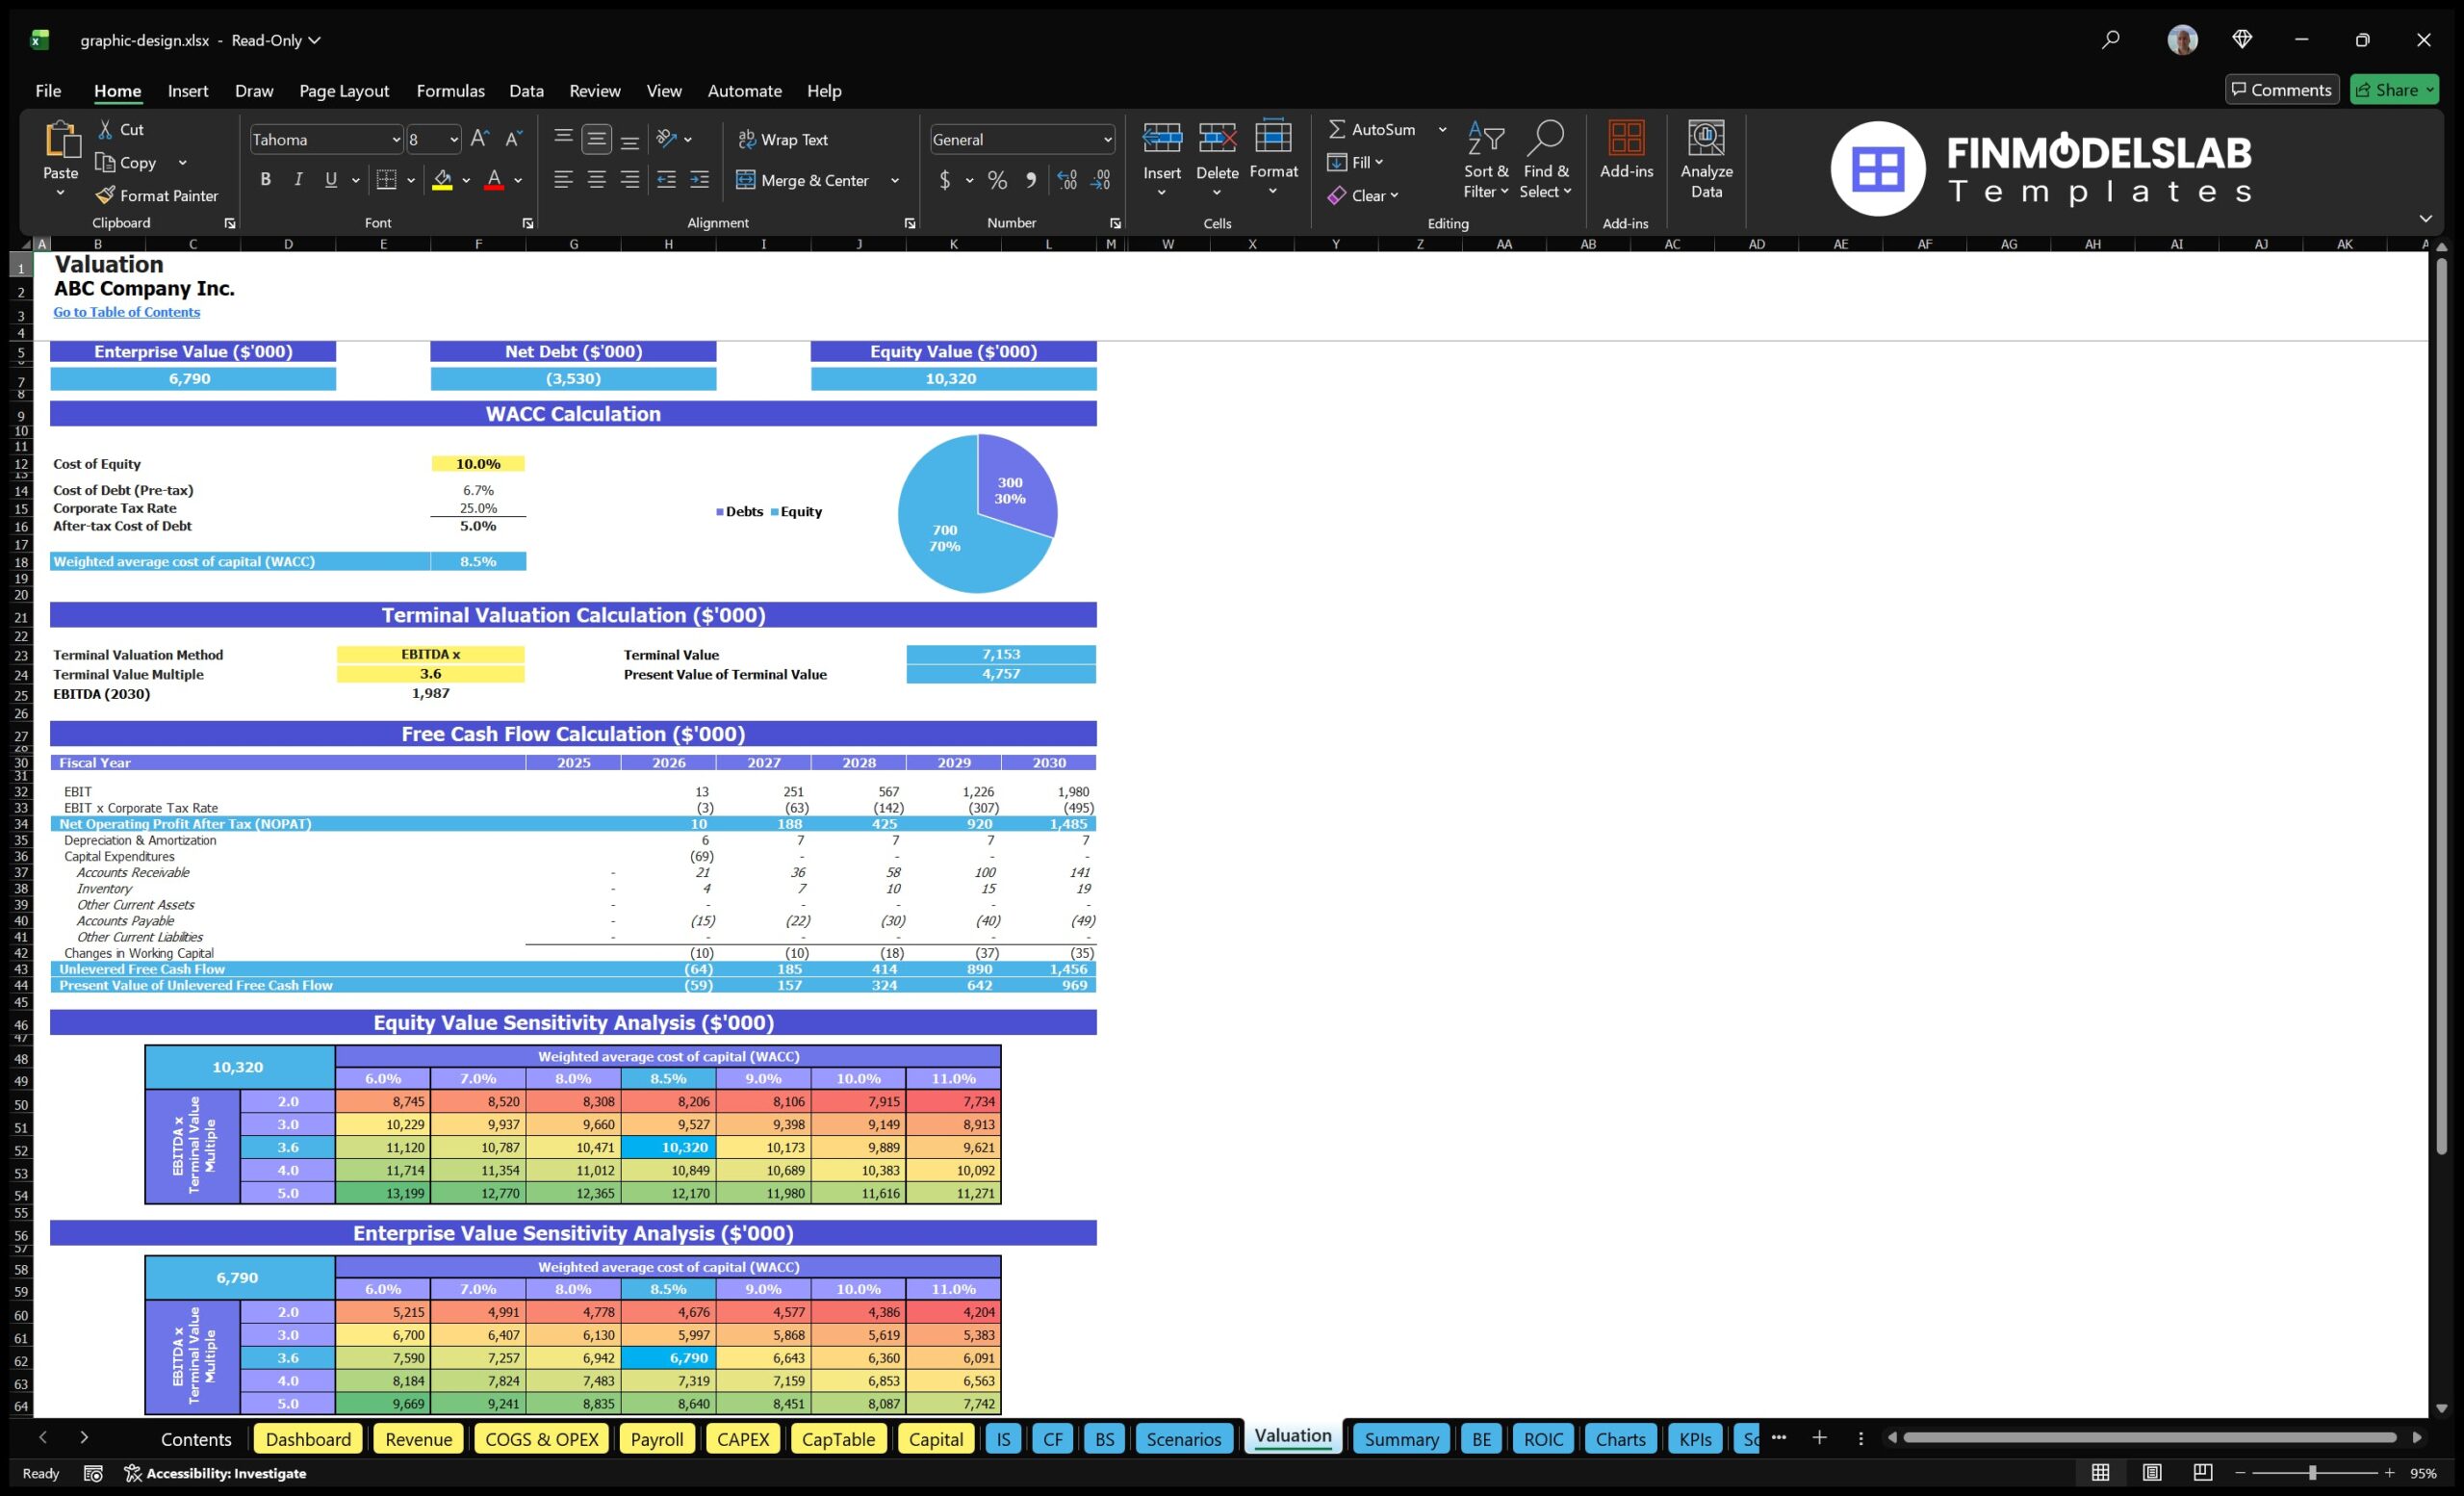
Financial Model Overview
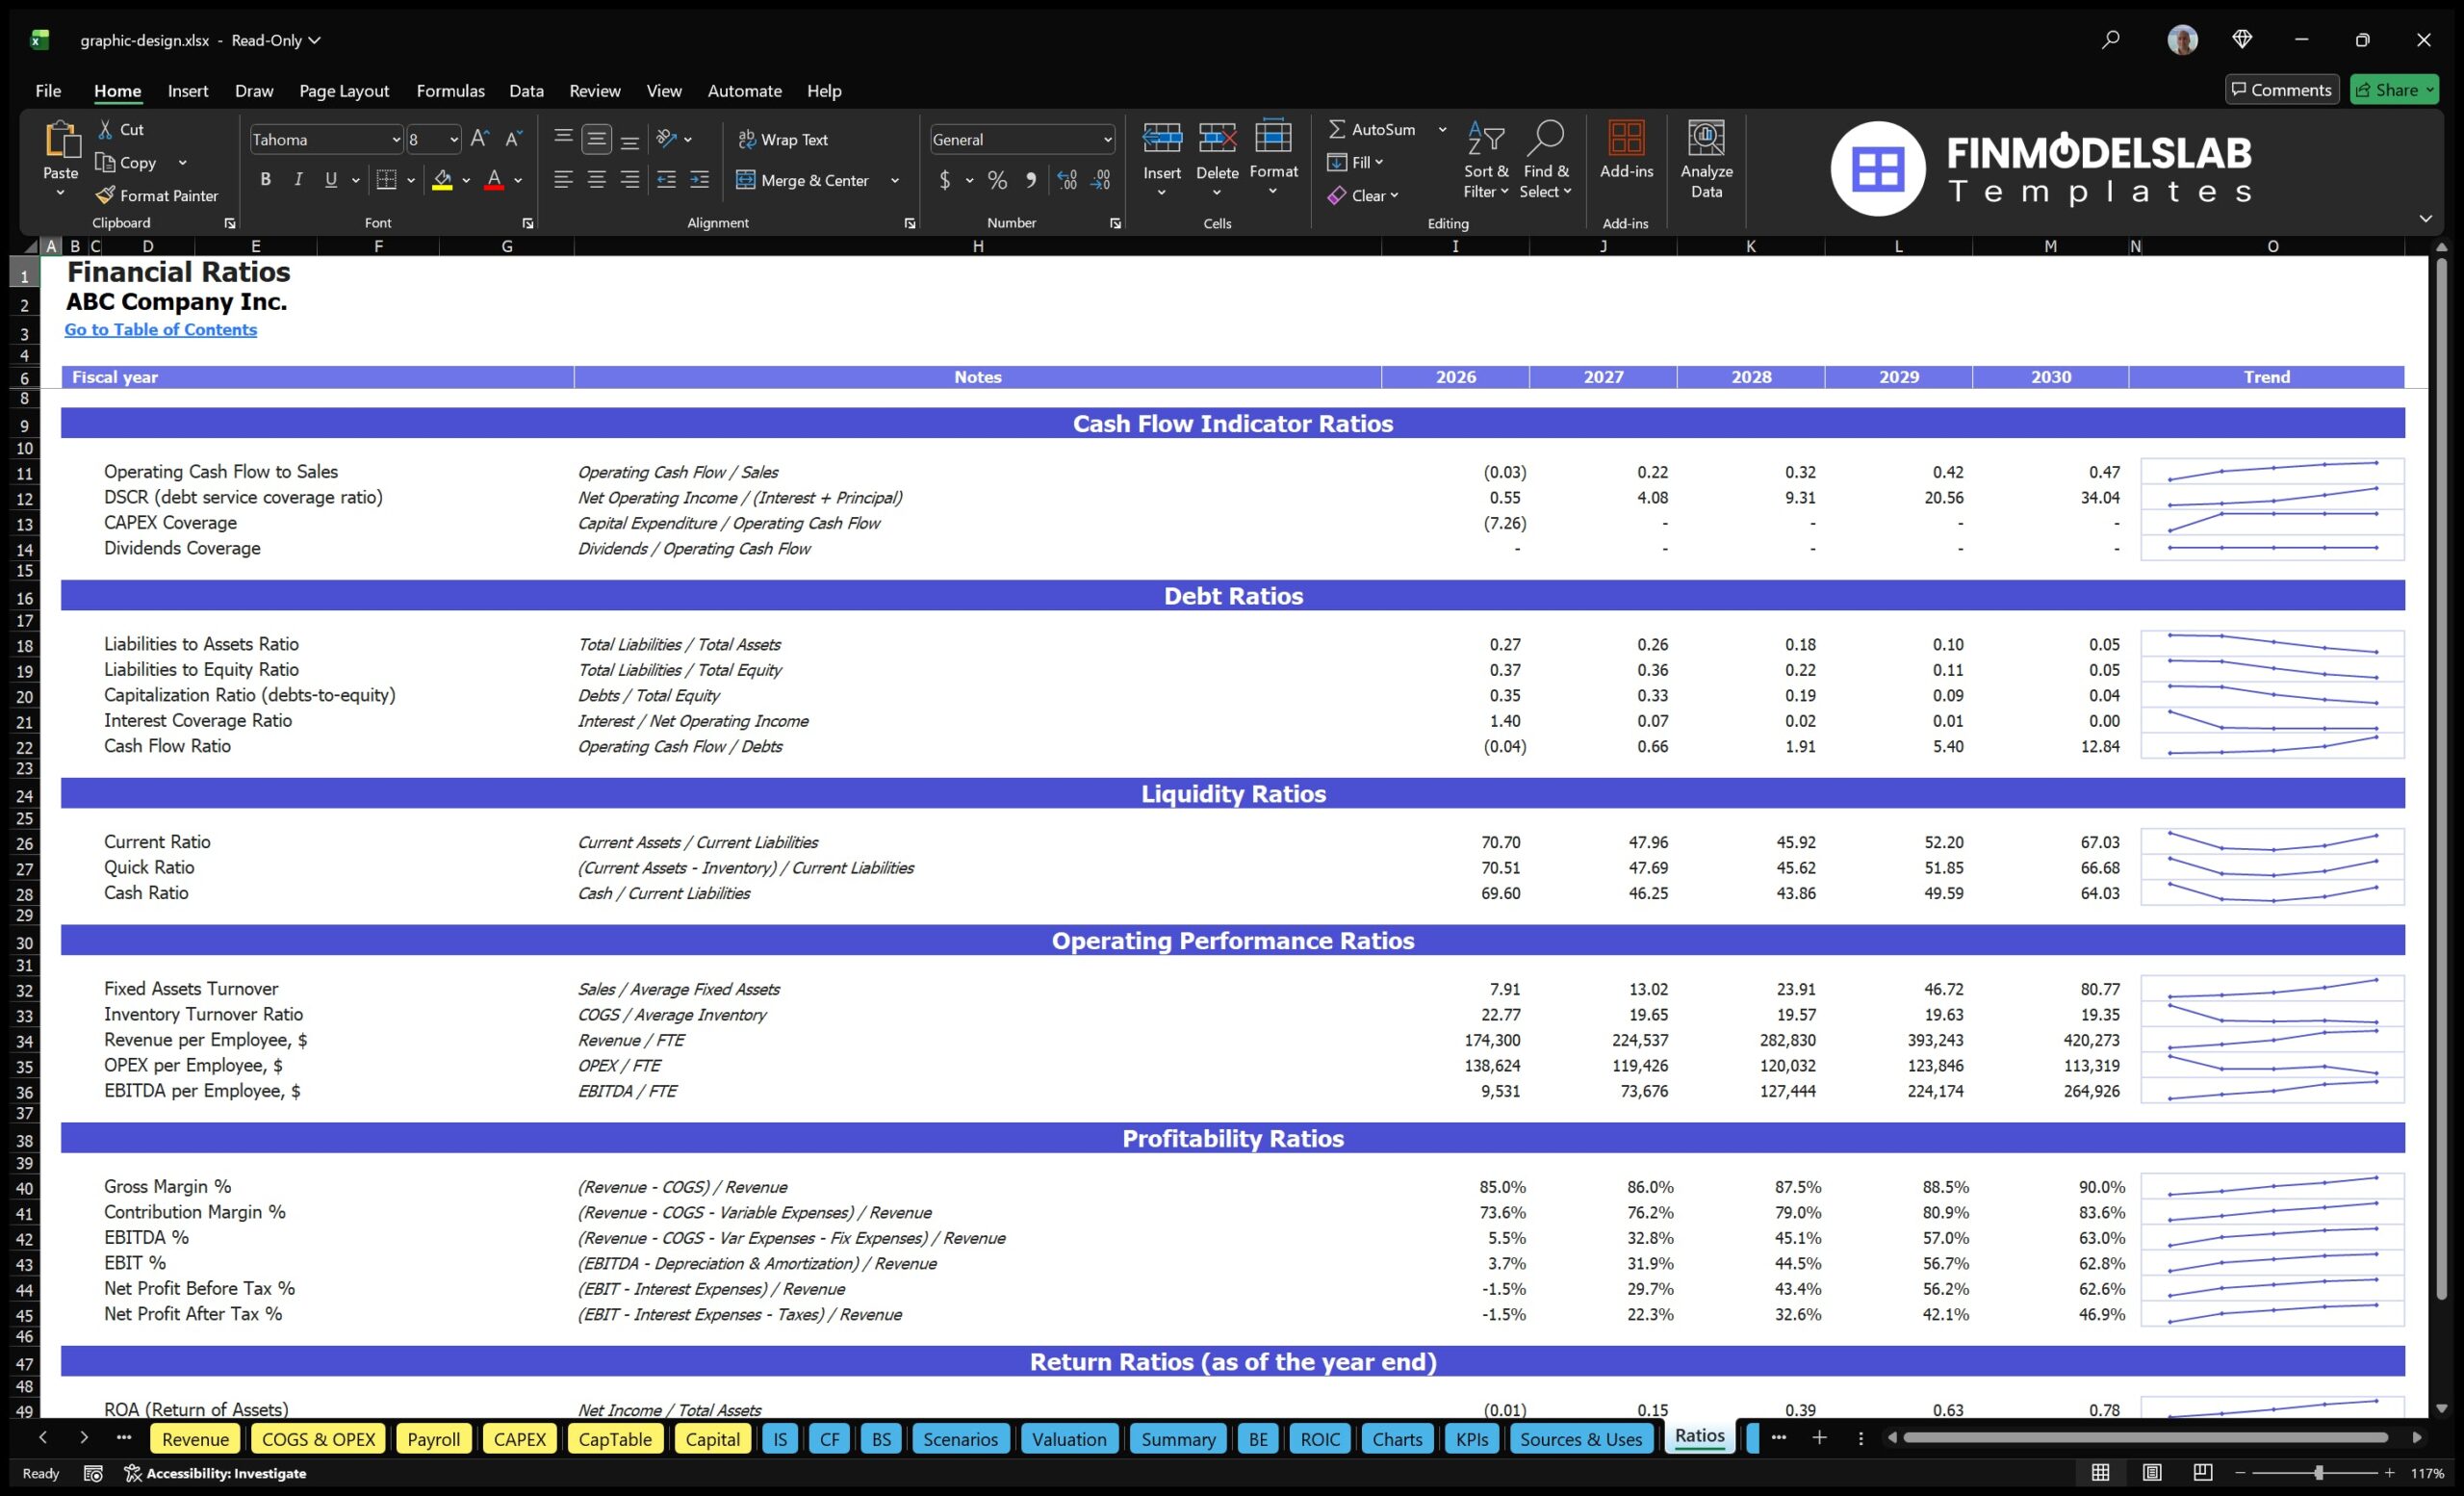
The Graphic Design Agency Financial Model Financial Model Template gives entrepreneurs, founders, agency owners, consultants, and analysts a structured way to plan the financial future of a creative services business. A graphic design agency depends on a combination of project-based revenue, recurring retainers, billable team capacity, freelance support, software tools, marketing investment, and client acquisition performance, so a generic spreadsheet often misses the details that matter. This template brings those moving parts into one editable planning tool, helping users forecast revenue, startup investment, operating expenses, payroll, cash flow, profitability, and funding requirements over a multi-year period. It is useful for preparing business plans, investor presentations, lender submissions, internal budgets, expansion plans, and strategic reviews. By using a pre-built framework with professional formatting, linked calculations, and presentation-ready outputs, users can focus on refining assumptions and making decisions rather than building formulas from scratch.
All-in-One Dashboard
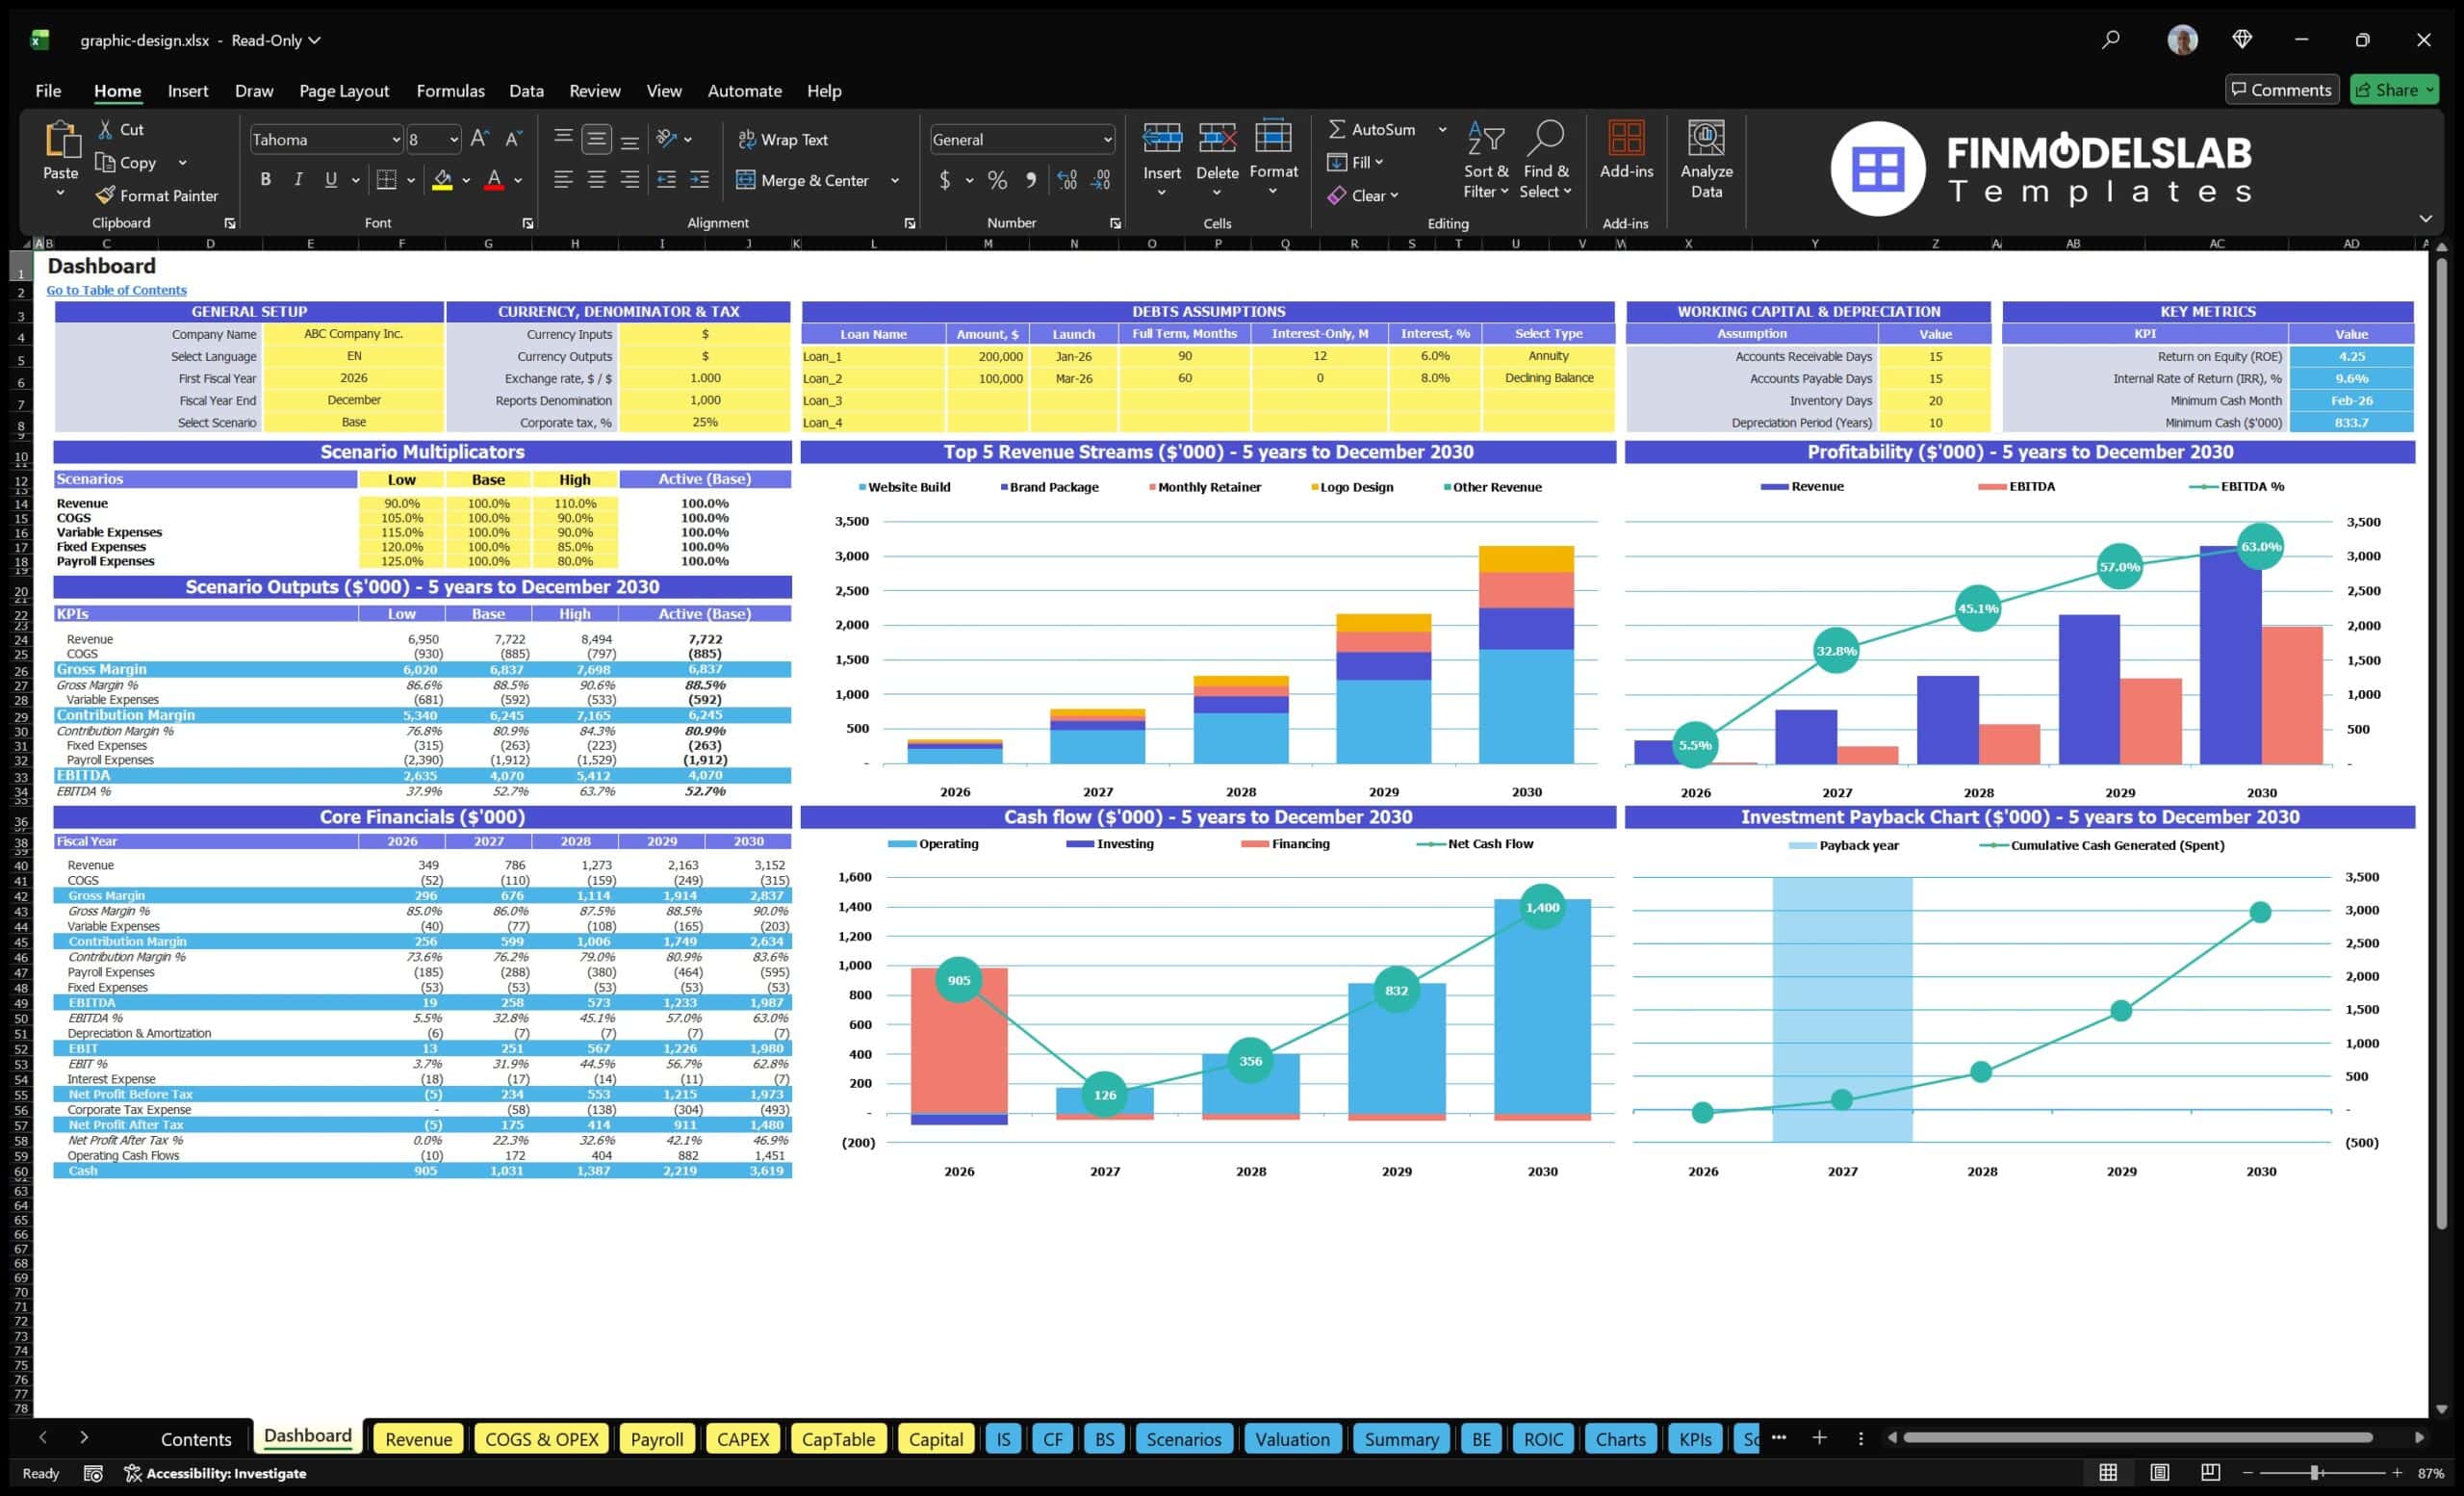
The all-in-one dashboard provides a central view of the model’s most important inputs and outputs, allowing users to quickly understand how the agency is expected to perform. It can summarize core assumptions such as pricing, customer growth, service mix, billable hours, payroll, contractor costs, software expenses, marketing spend, and startup investment, then connect those assumptions to high-level financial results. For a graphic design agency, this is especially valuable because profitability depends on balancing creative capacity with client demand and keeping operating overhead under control. The dashboard helps users review projected revenue, gross margin, EBITDA, net profit, cash position, and other key figures without searching through multiple tabs. It is designed for both planning and communication, making it easier to explain the agency’s financial story to partners, lenders, investors, or internal decision-makers. Because the fields are editable, users can adjust assumptions and see how the outputs respond, which supports faster financial planning and more confident business decisions.
Low, Base, and High Scenario Analysis
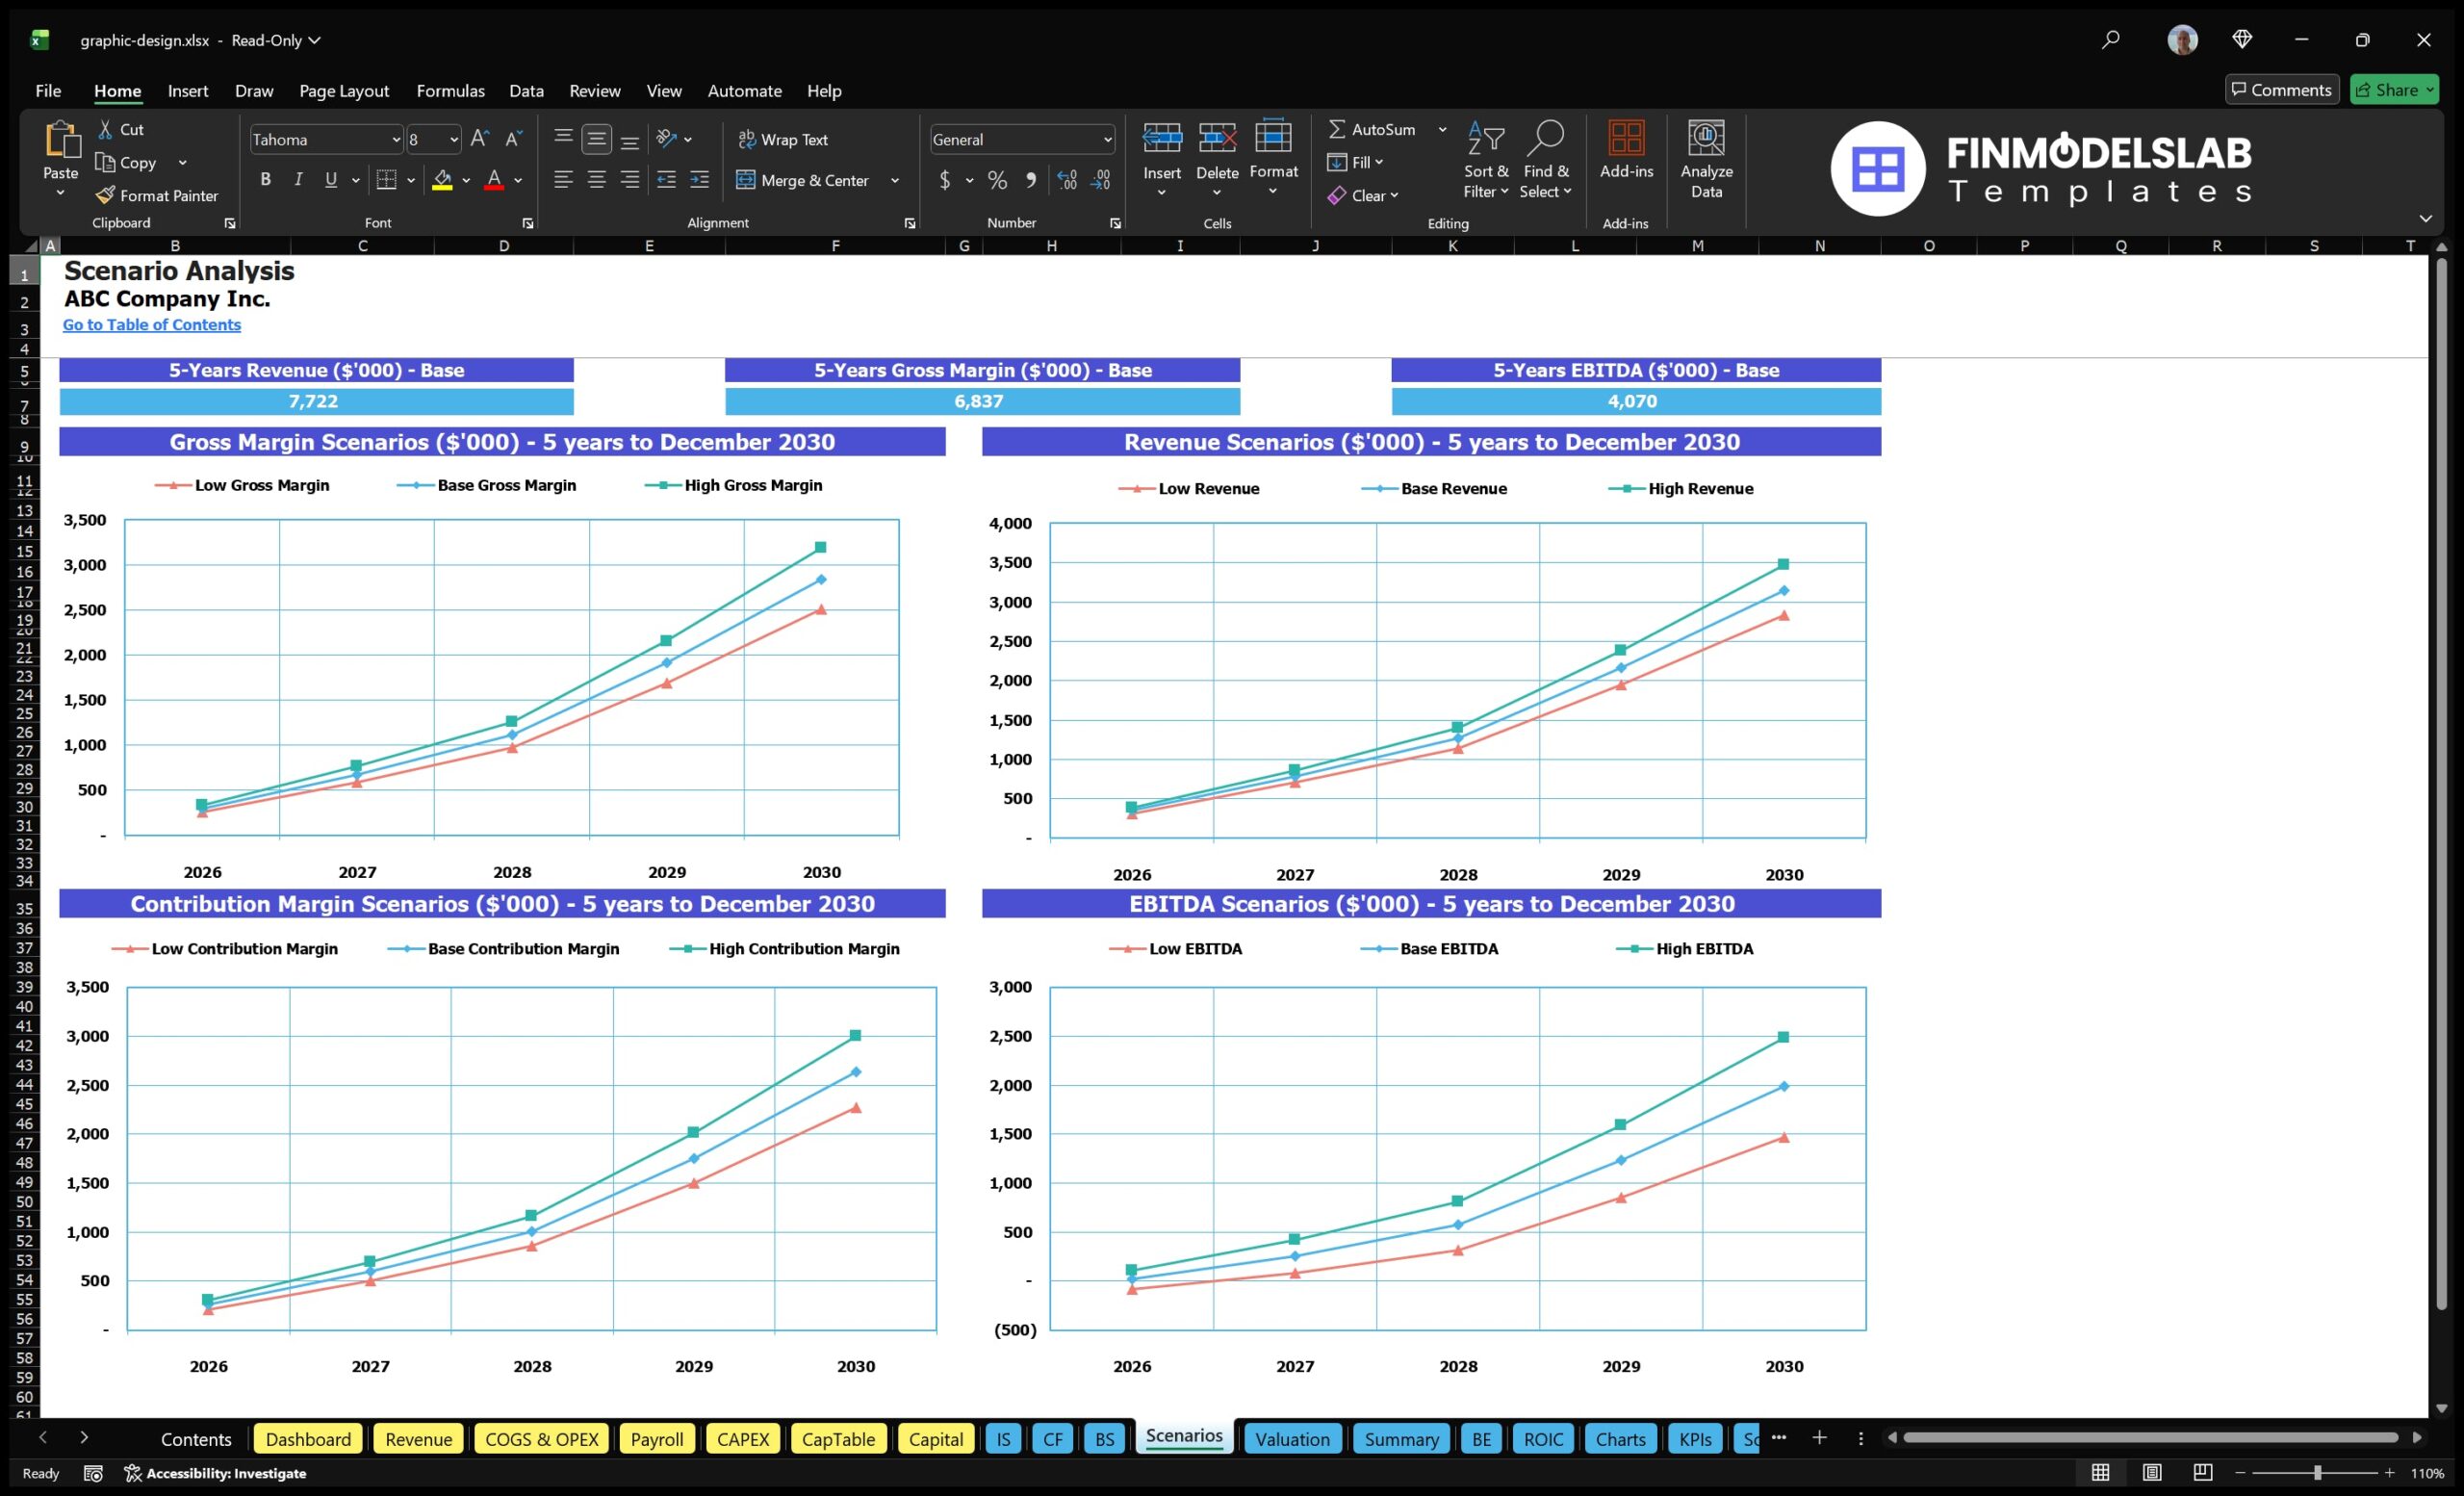
The low, base, and high scenario analysis section helps users test how the agency may perform under different market conditions and strategic assumptions. A design agency’s results can change significantly depending on how quickly it acquires clients, how many billable hours it sells, whether customers choose one-off projects or monthly retainers, and how efficiently the team delivers work. This component lets users compare conservative, expected, and optimistic outcomes by changing variables such as pricing, client volume, utilization, direct costs, payroll timing, marketing efficiency, and service mix. The outputs help show how revenue, expenses, margins, cash flow, and profitability may shift across each scenario. This is useful for business planning because it highlights both upside potential and downside risk. It also helps users prepare for funding conversations by demonstrating that they have considered multiple possible outcomes rather than relying on a single forecast. For founders and agency owners, scenario analysis supports better decisions about hiring, software commitments, client acquisition budgets, and the timing of expansion.
Professional Charts and Visual Reports
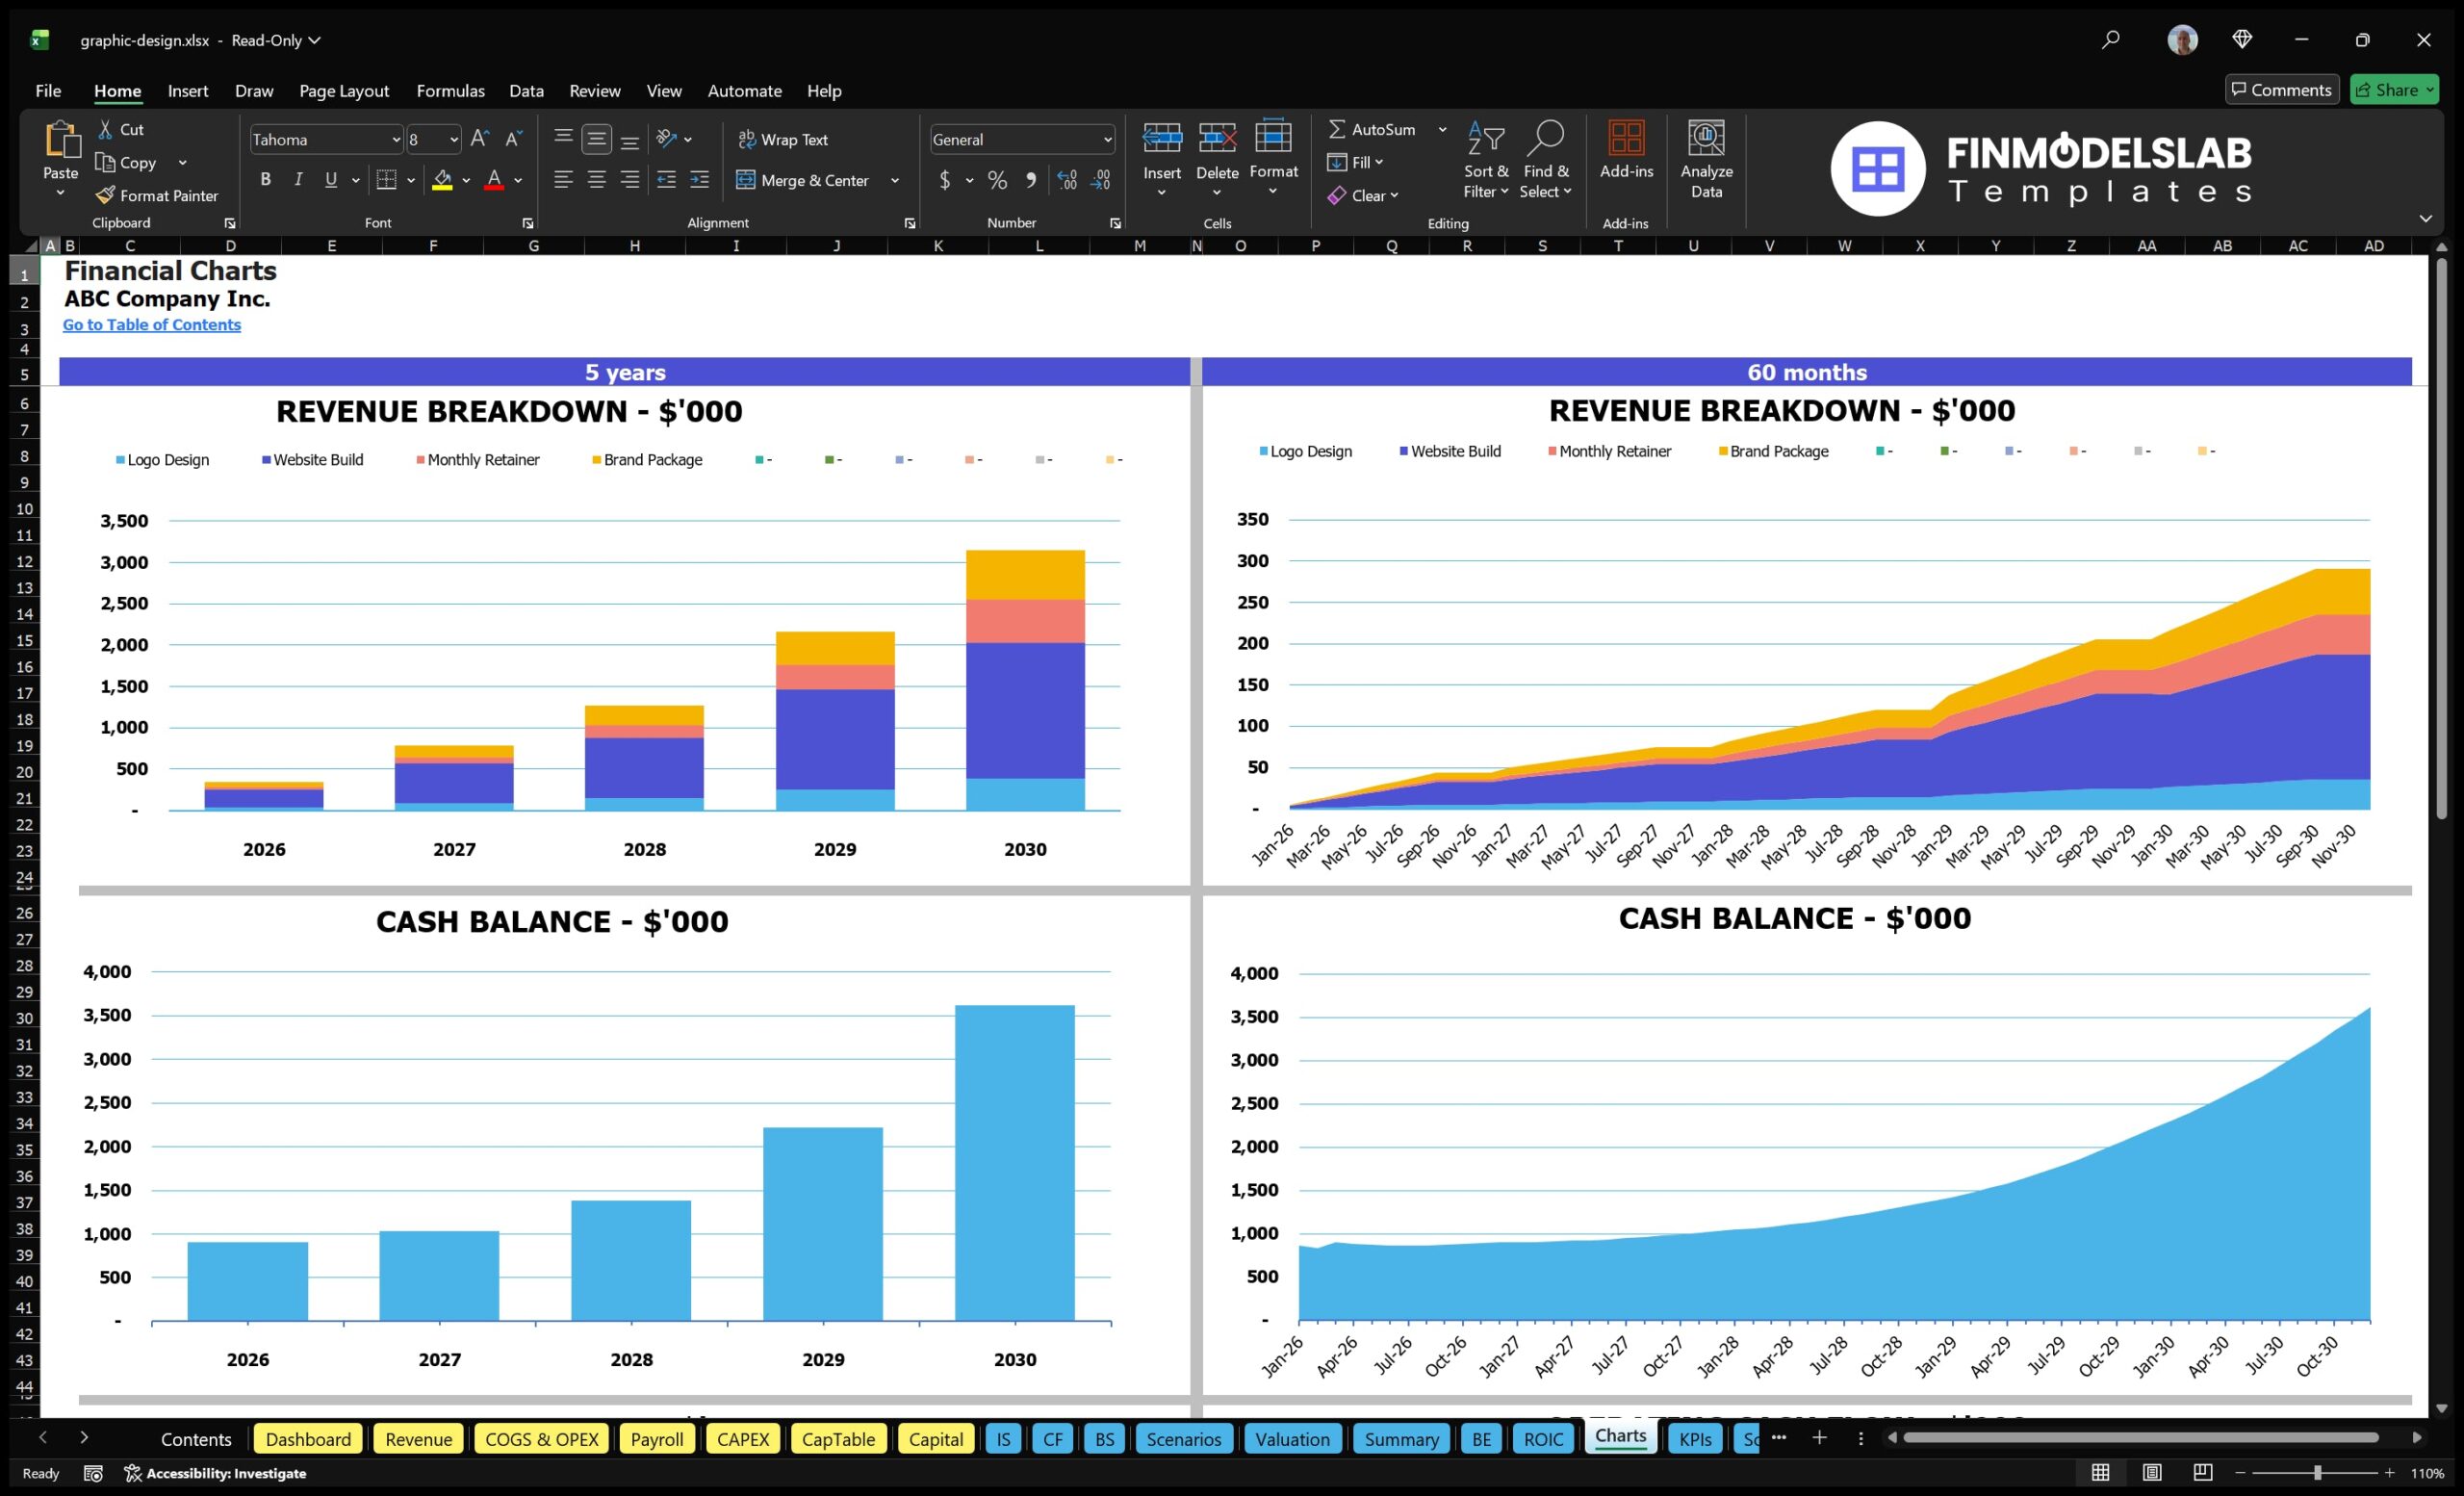
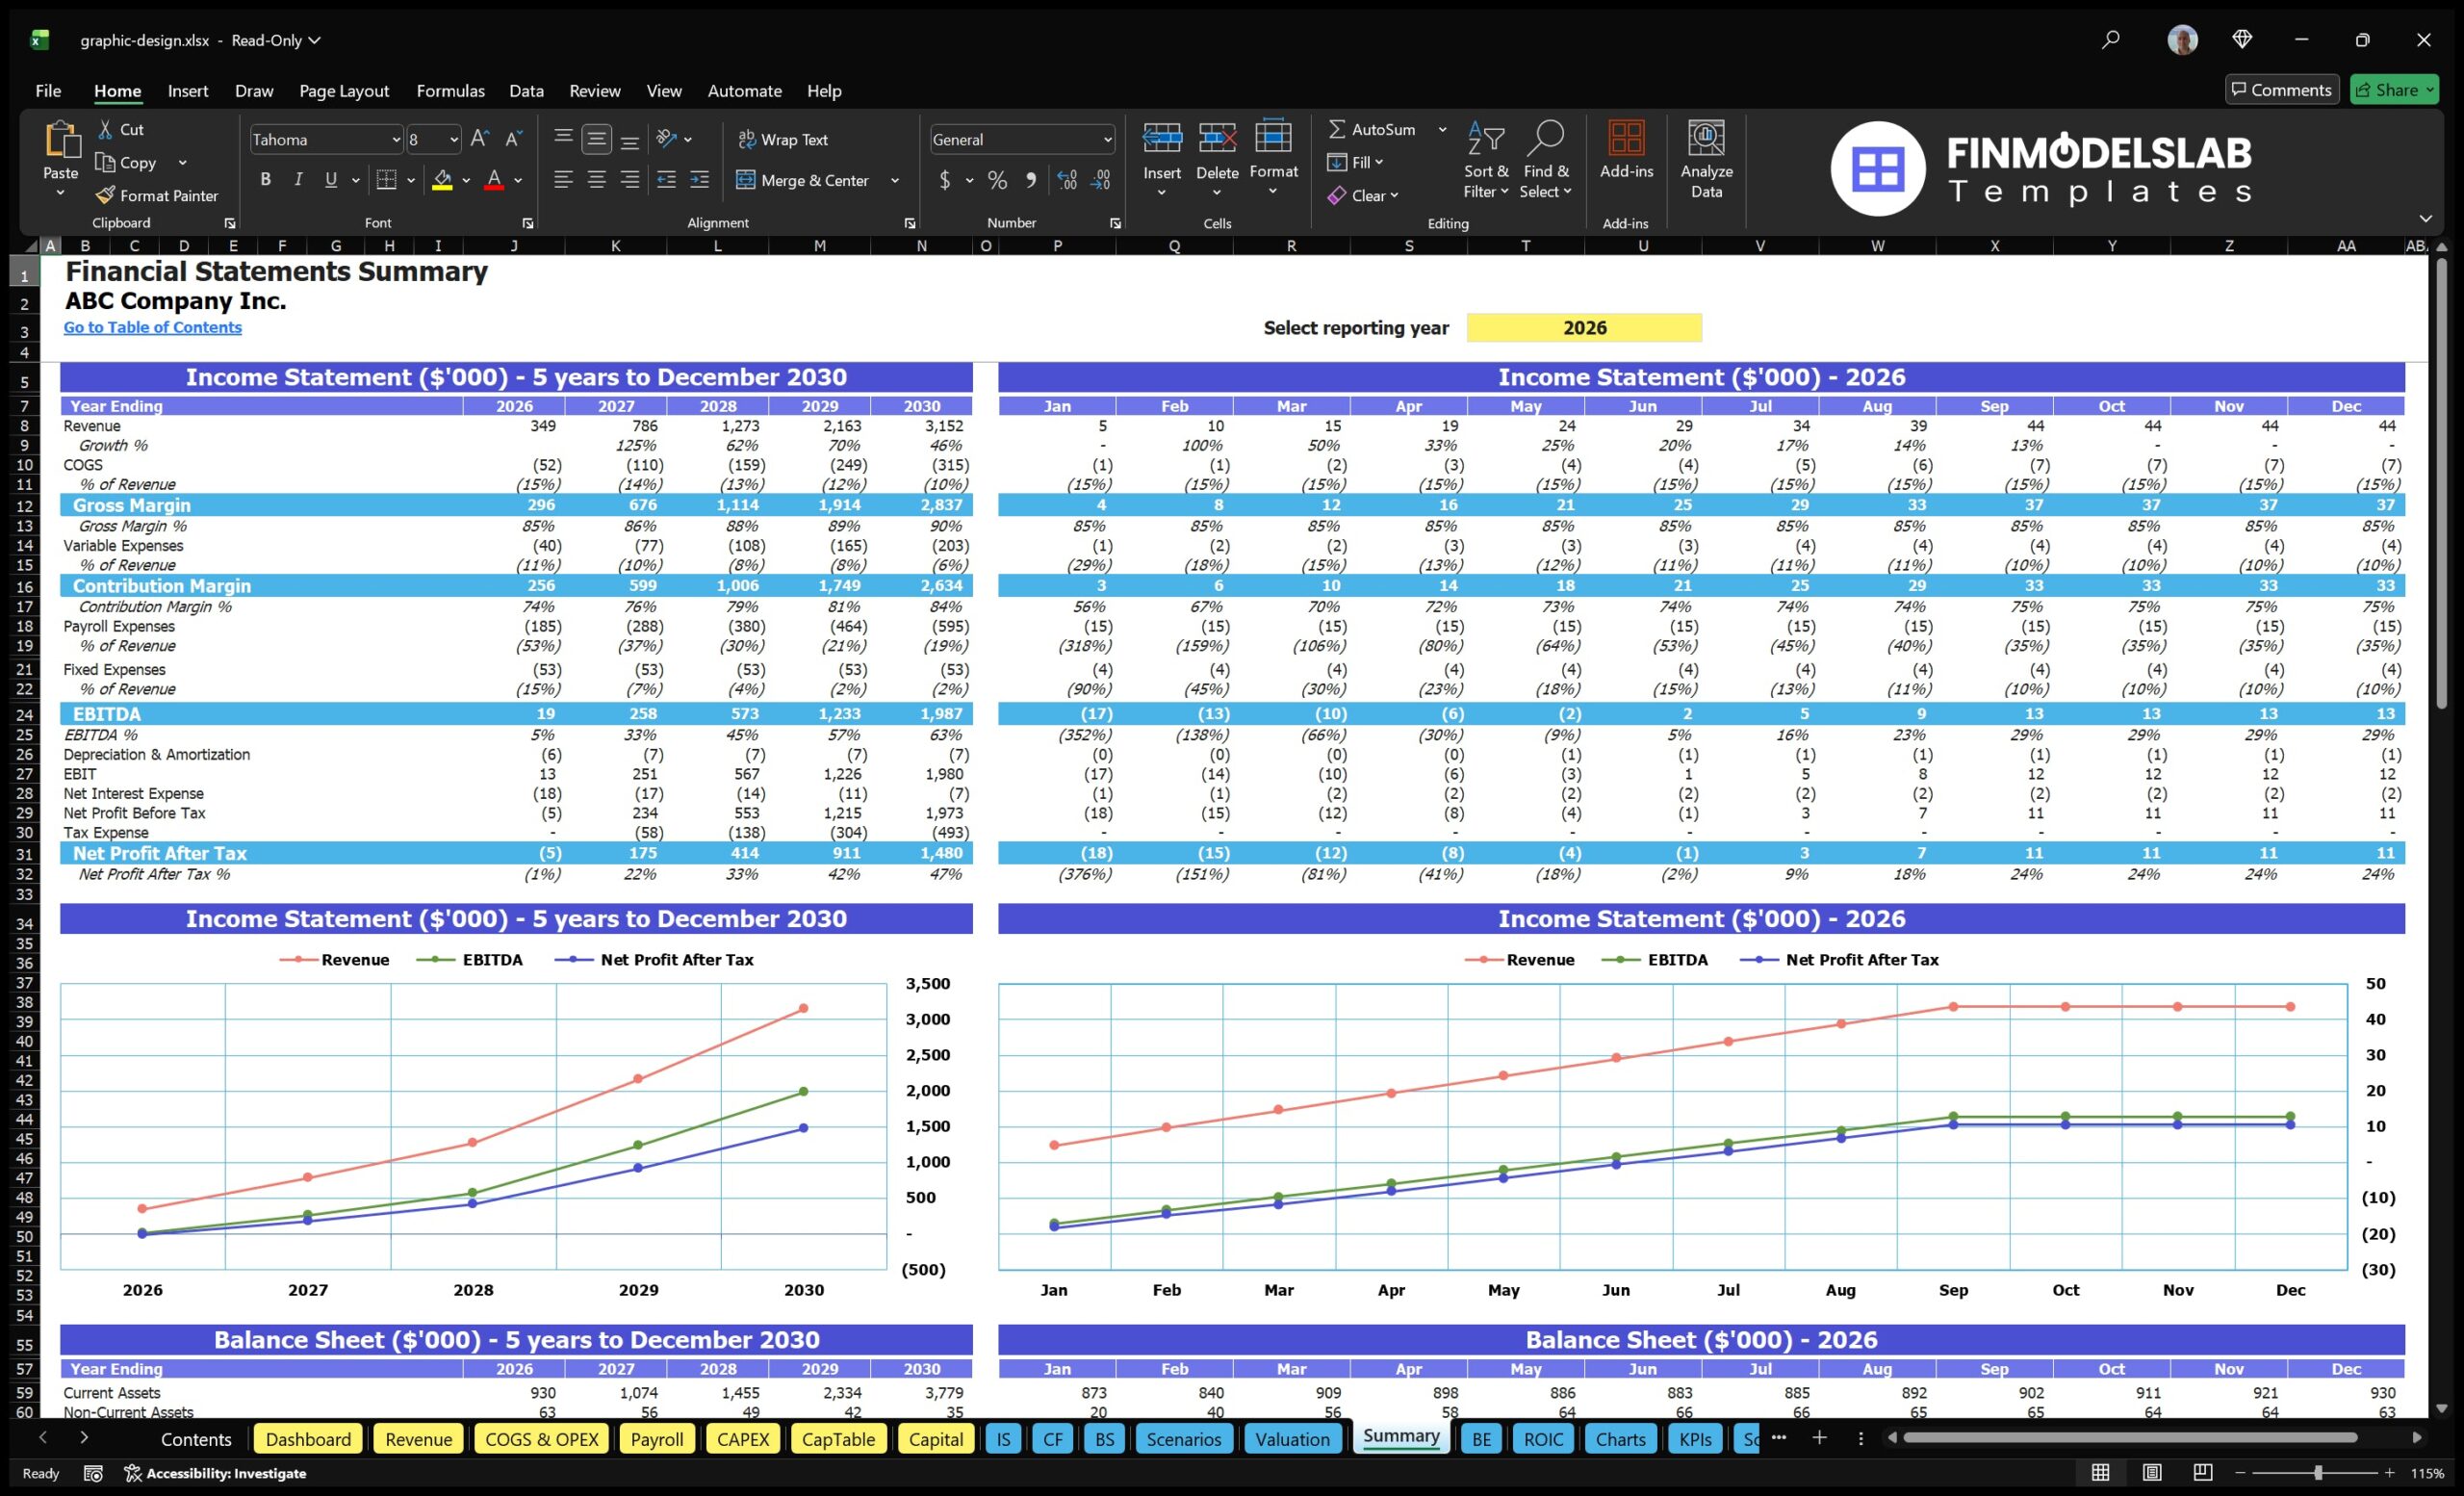
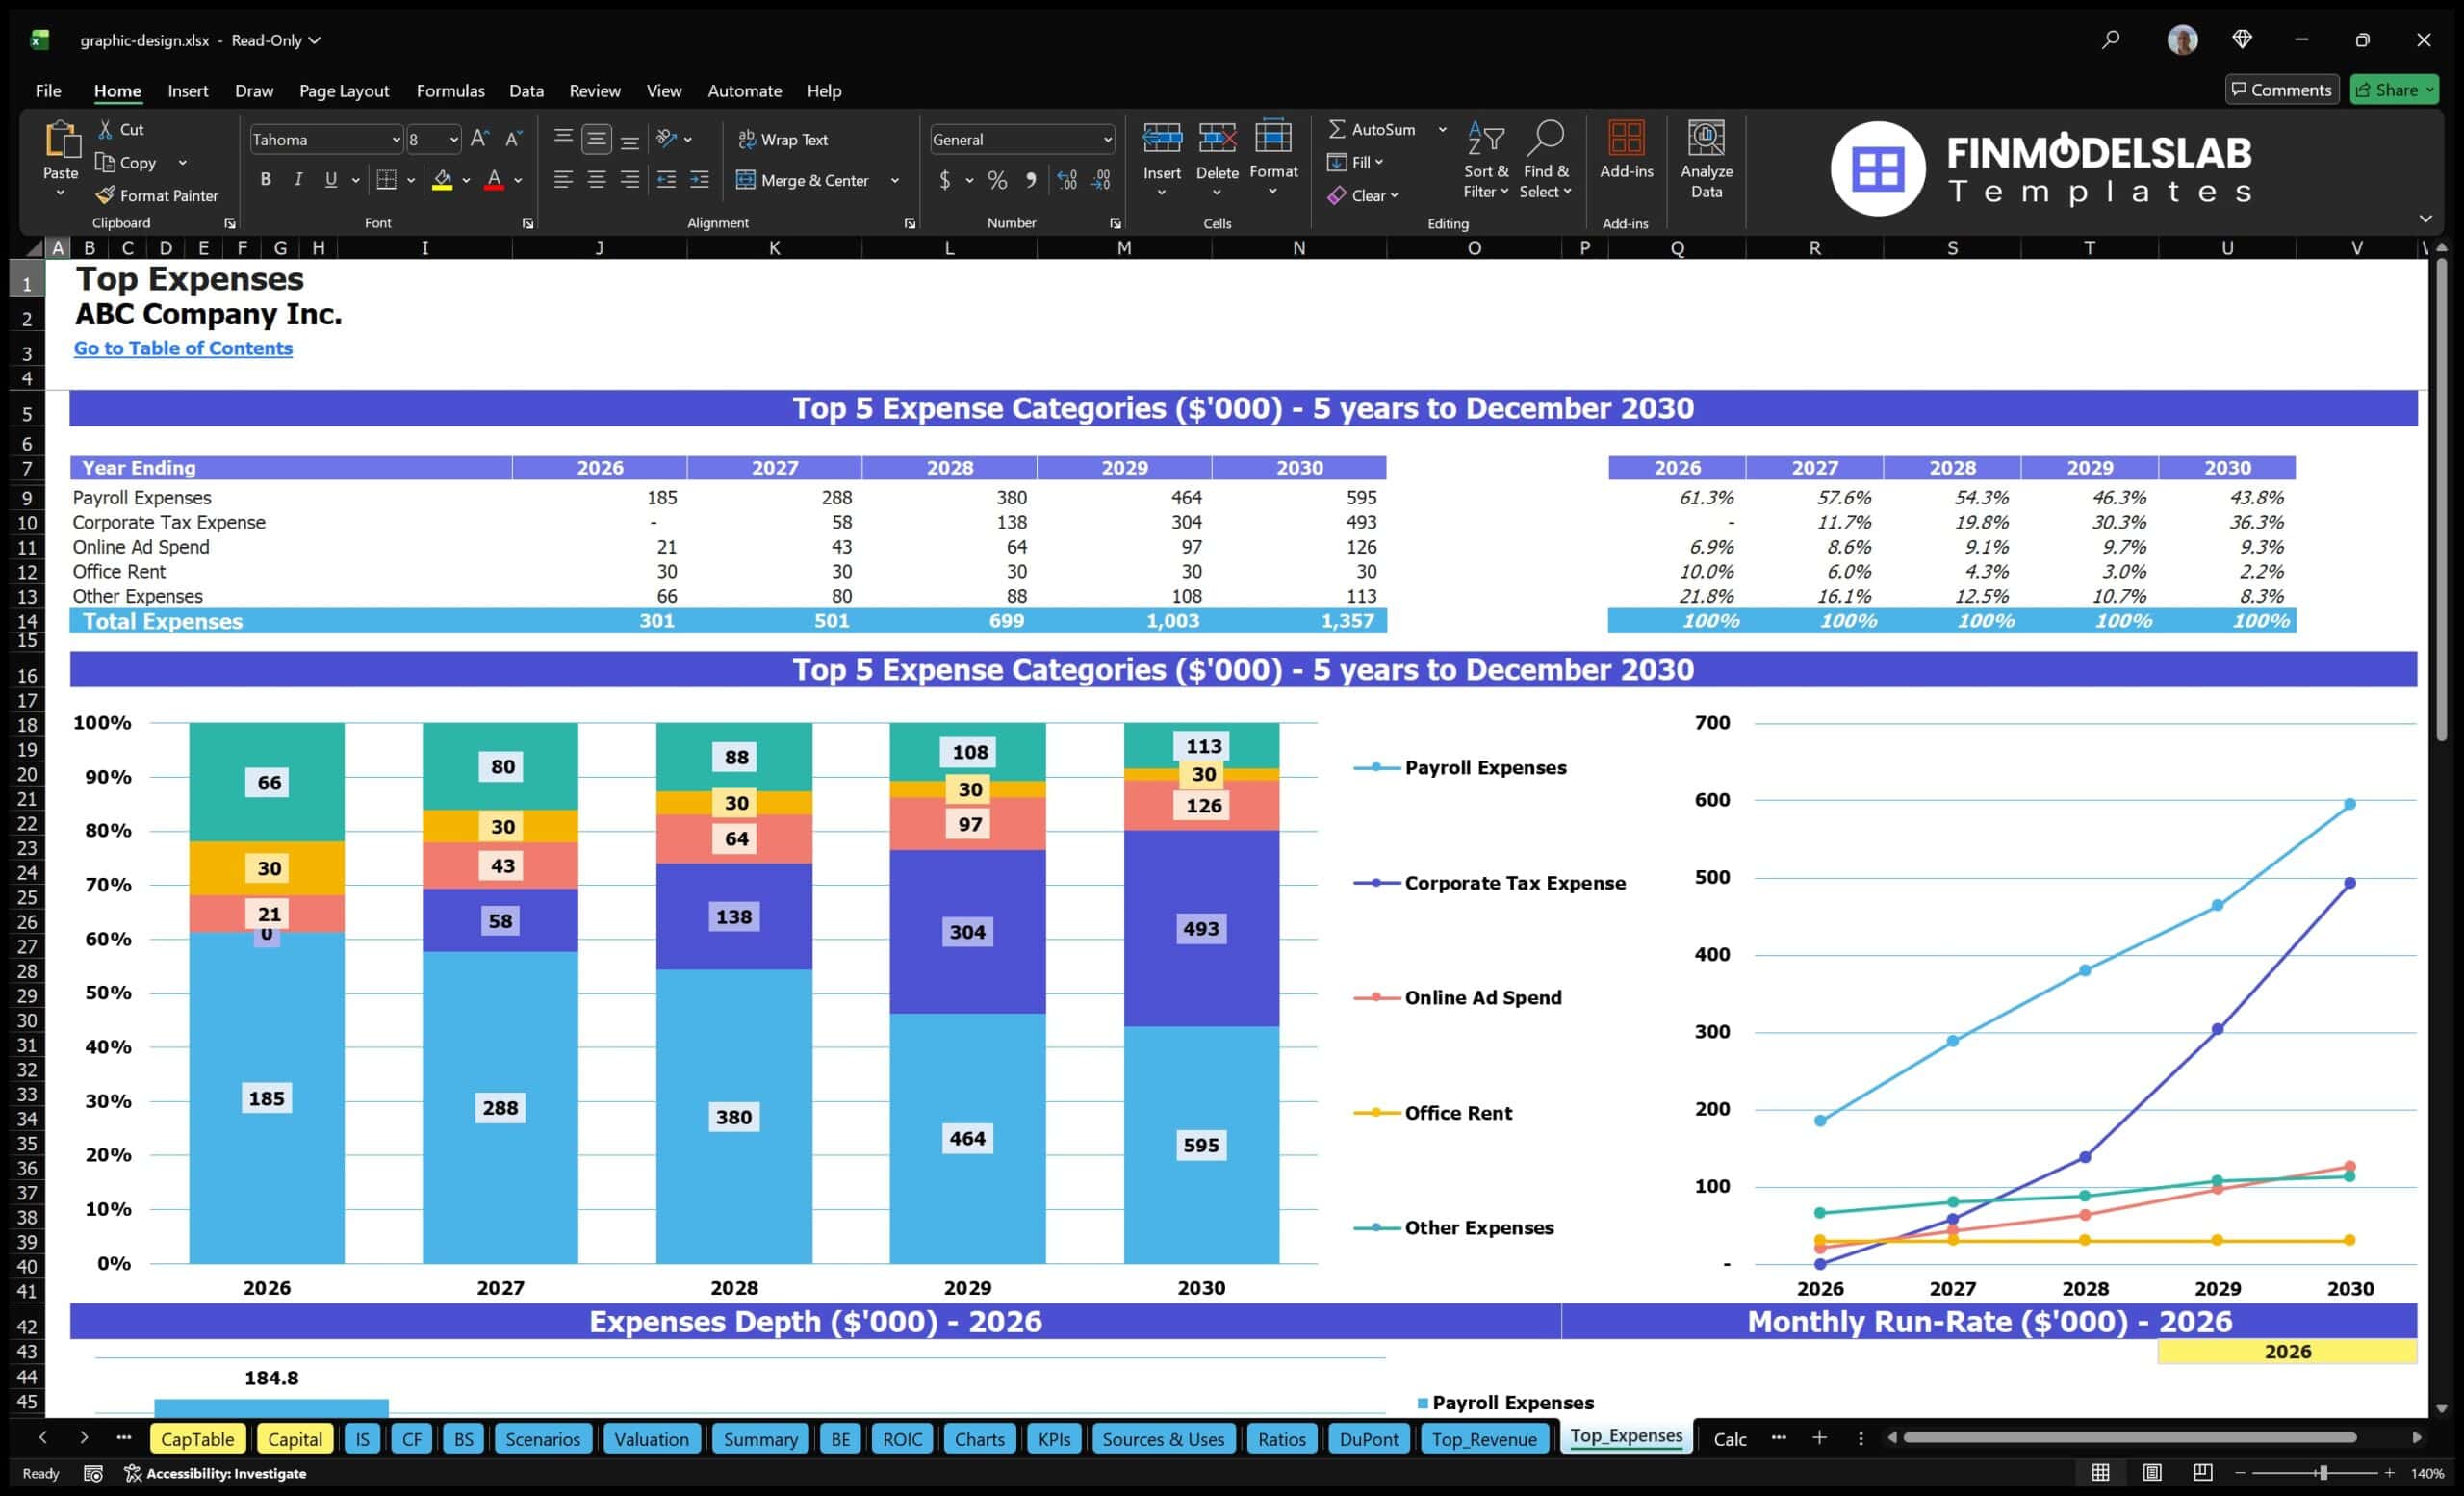
The professional charts and visual reports component translates the model’s calculations into clear visual outputs that are easier to review and present. Financial projections can become difficult to interpret when they are only shown as rows of numbers, especially for stakeholders who want to understand the agency’s direction quickly. This section can display revenue growth, expense trends, profit movement, cash flow changes, margin performance, and other key metrics through clean graphs and visual summaries. For a graphic design agency, these reports can help show how one-off design projects, website builds, and recurring retainers contribute to the overall financial plan. They also make it easier to compare planned performance across months and years, identify turning points, and spot areas that need attention. These charts are useful for pitch decks, management meetings, lender discussions, and internal planning sessions because they support a more professional and accessible presentation of the forecast. Users can update the underlying assumptions and use the visuals to communicate the financial impact clearly.
ROE Components and DuPont Analysis
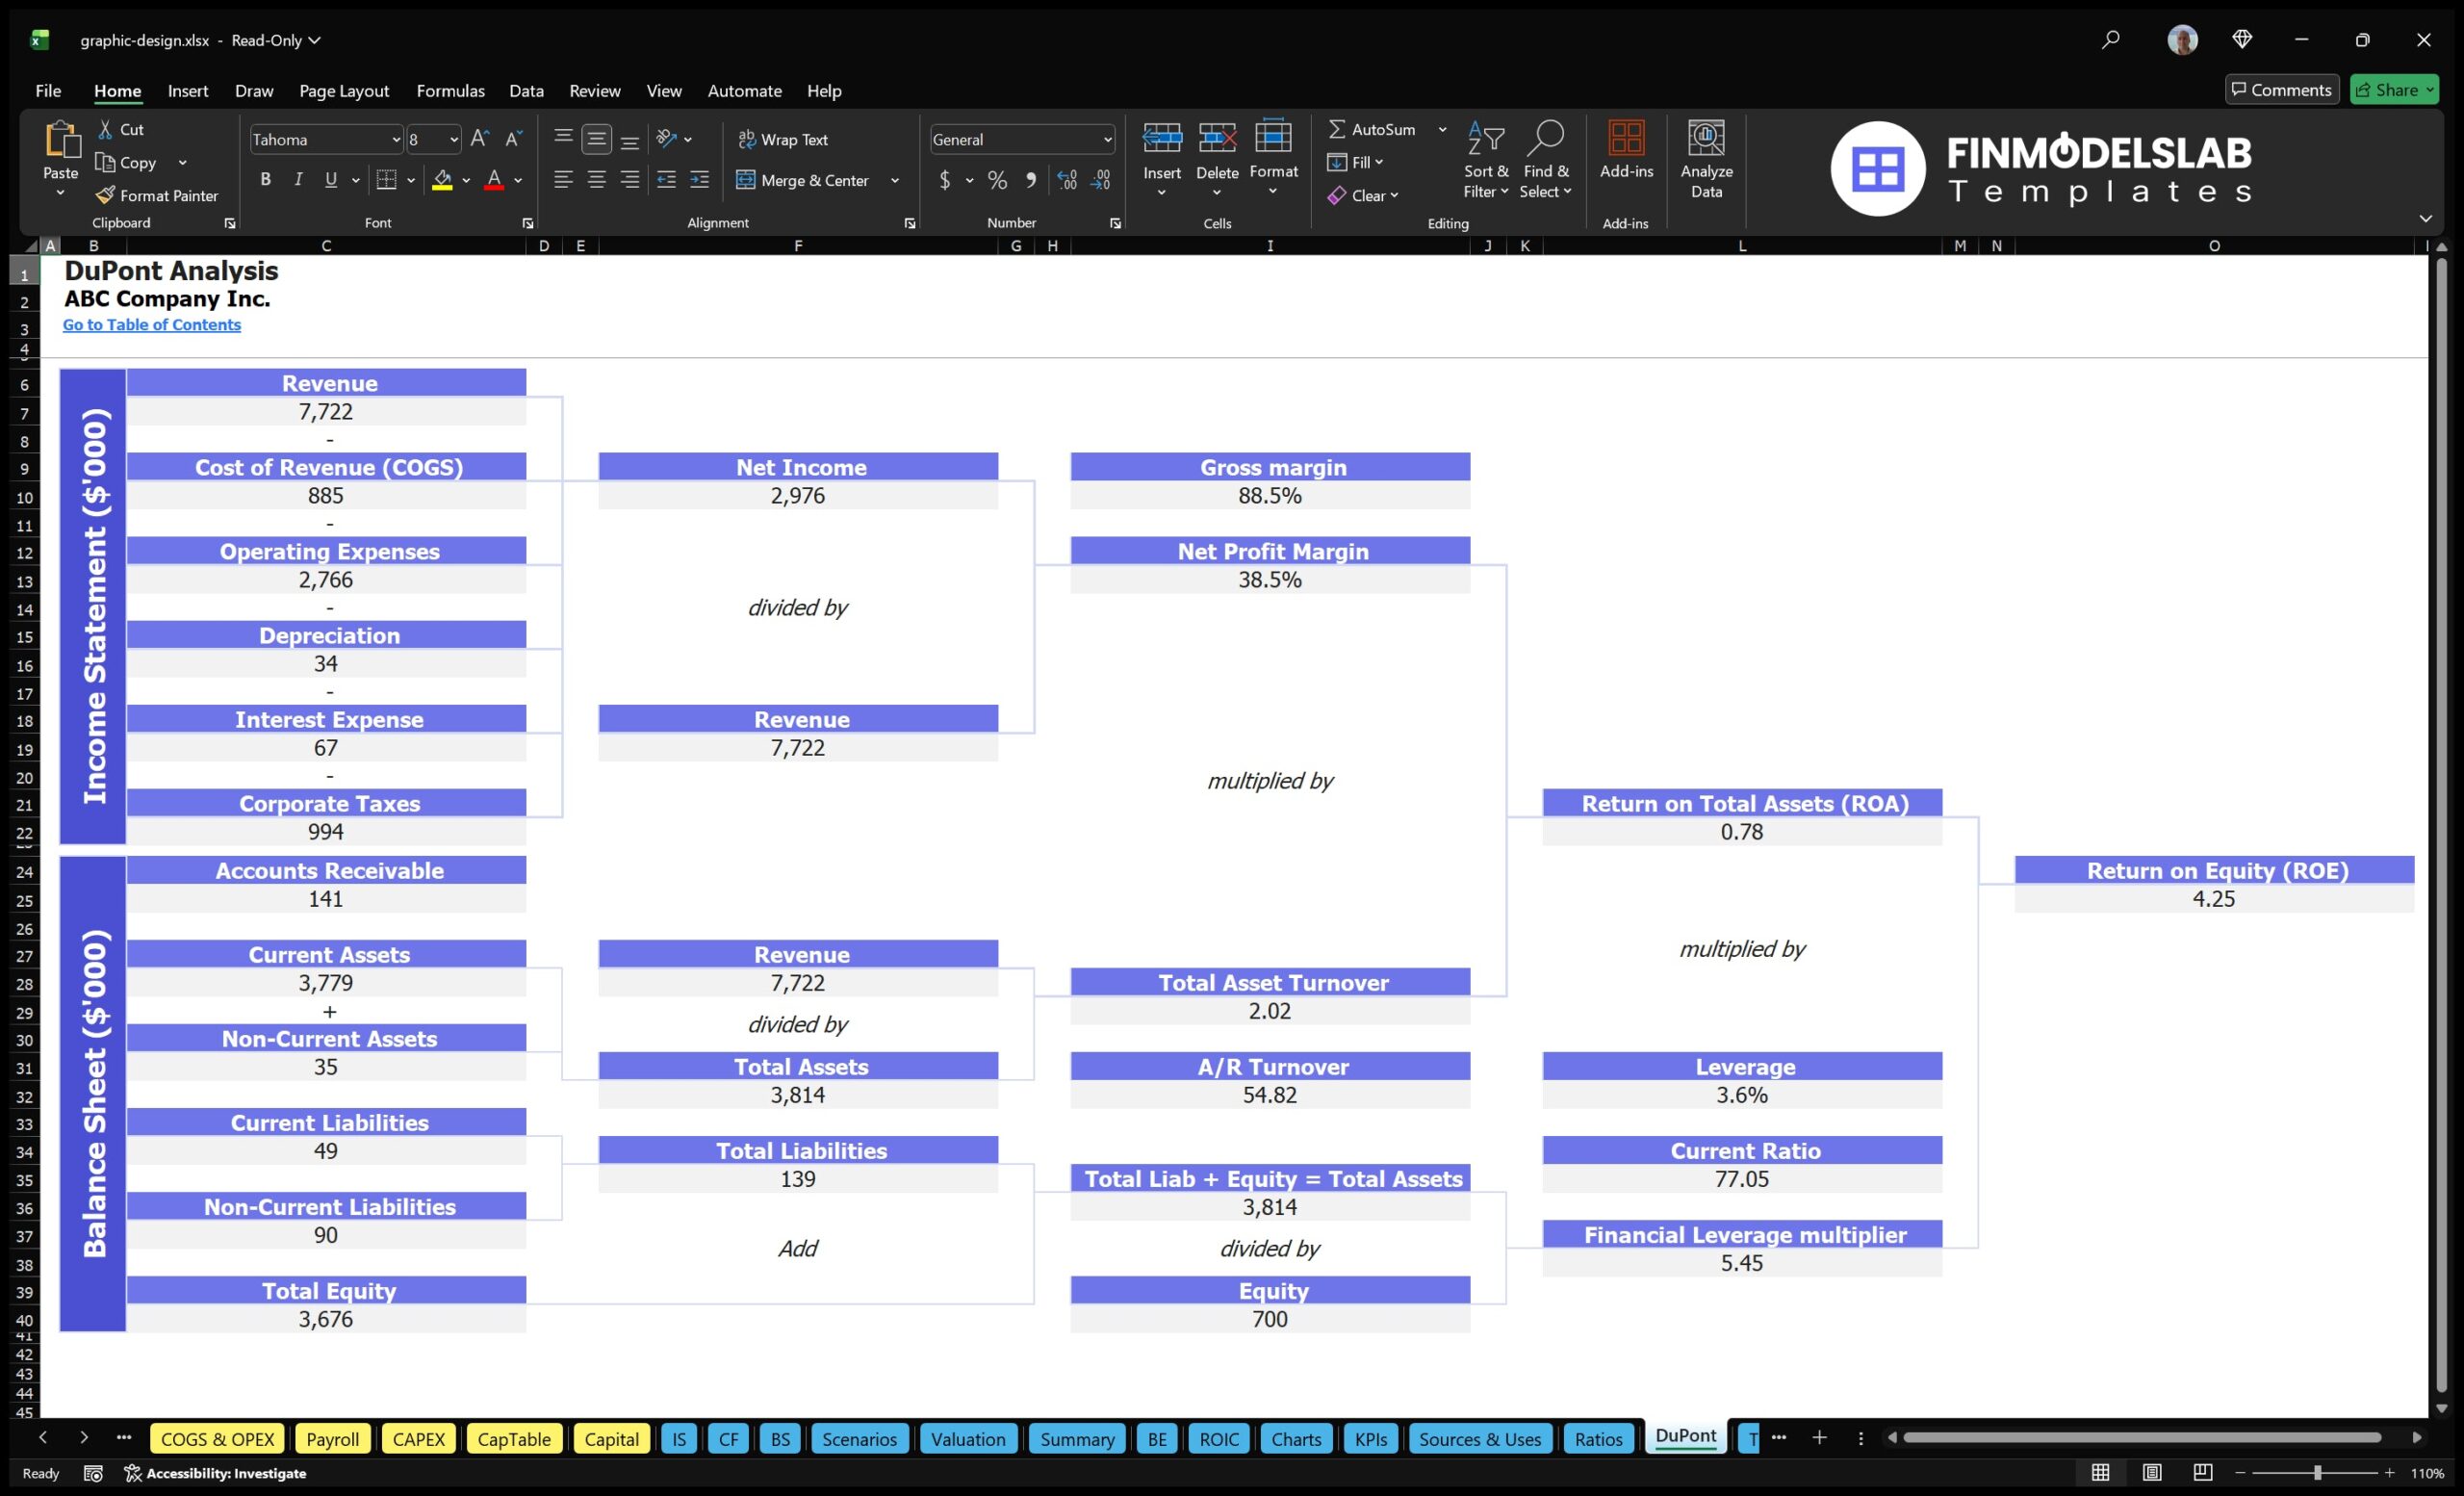
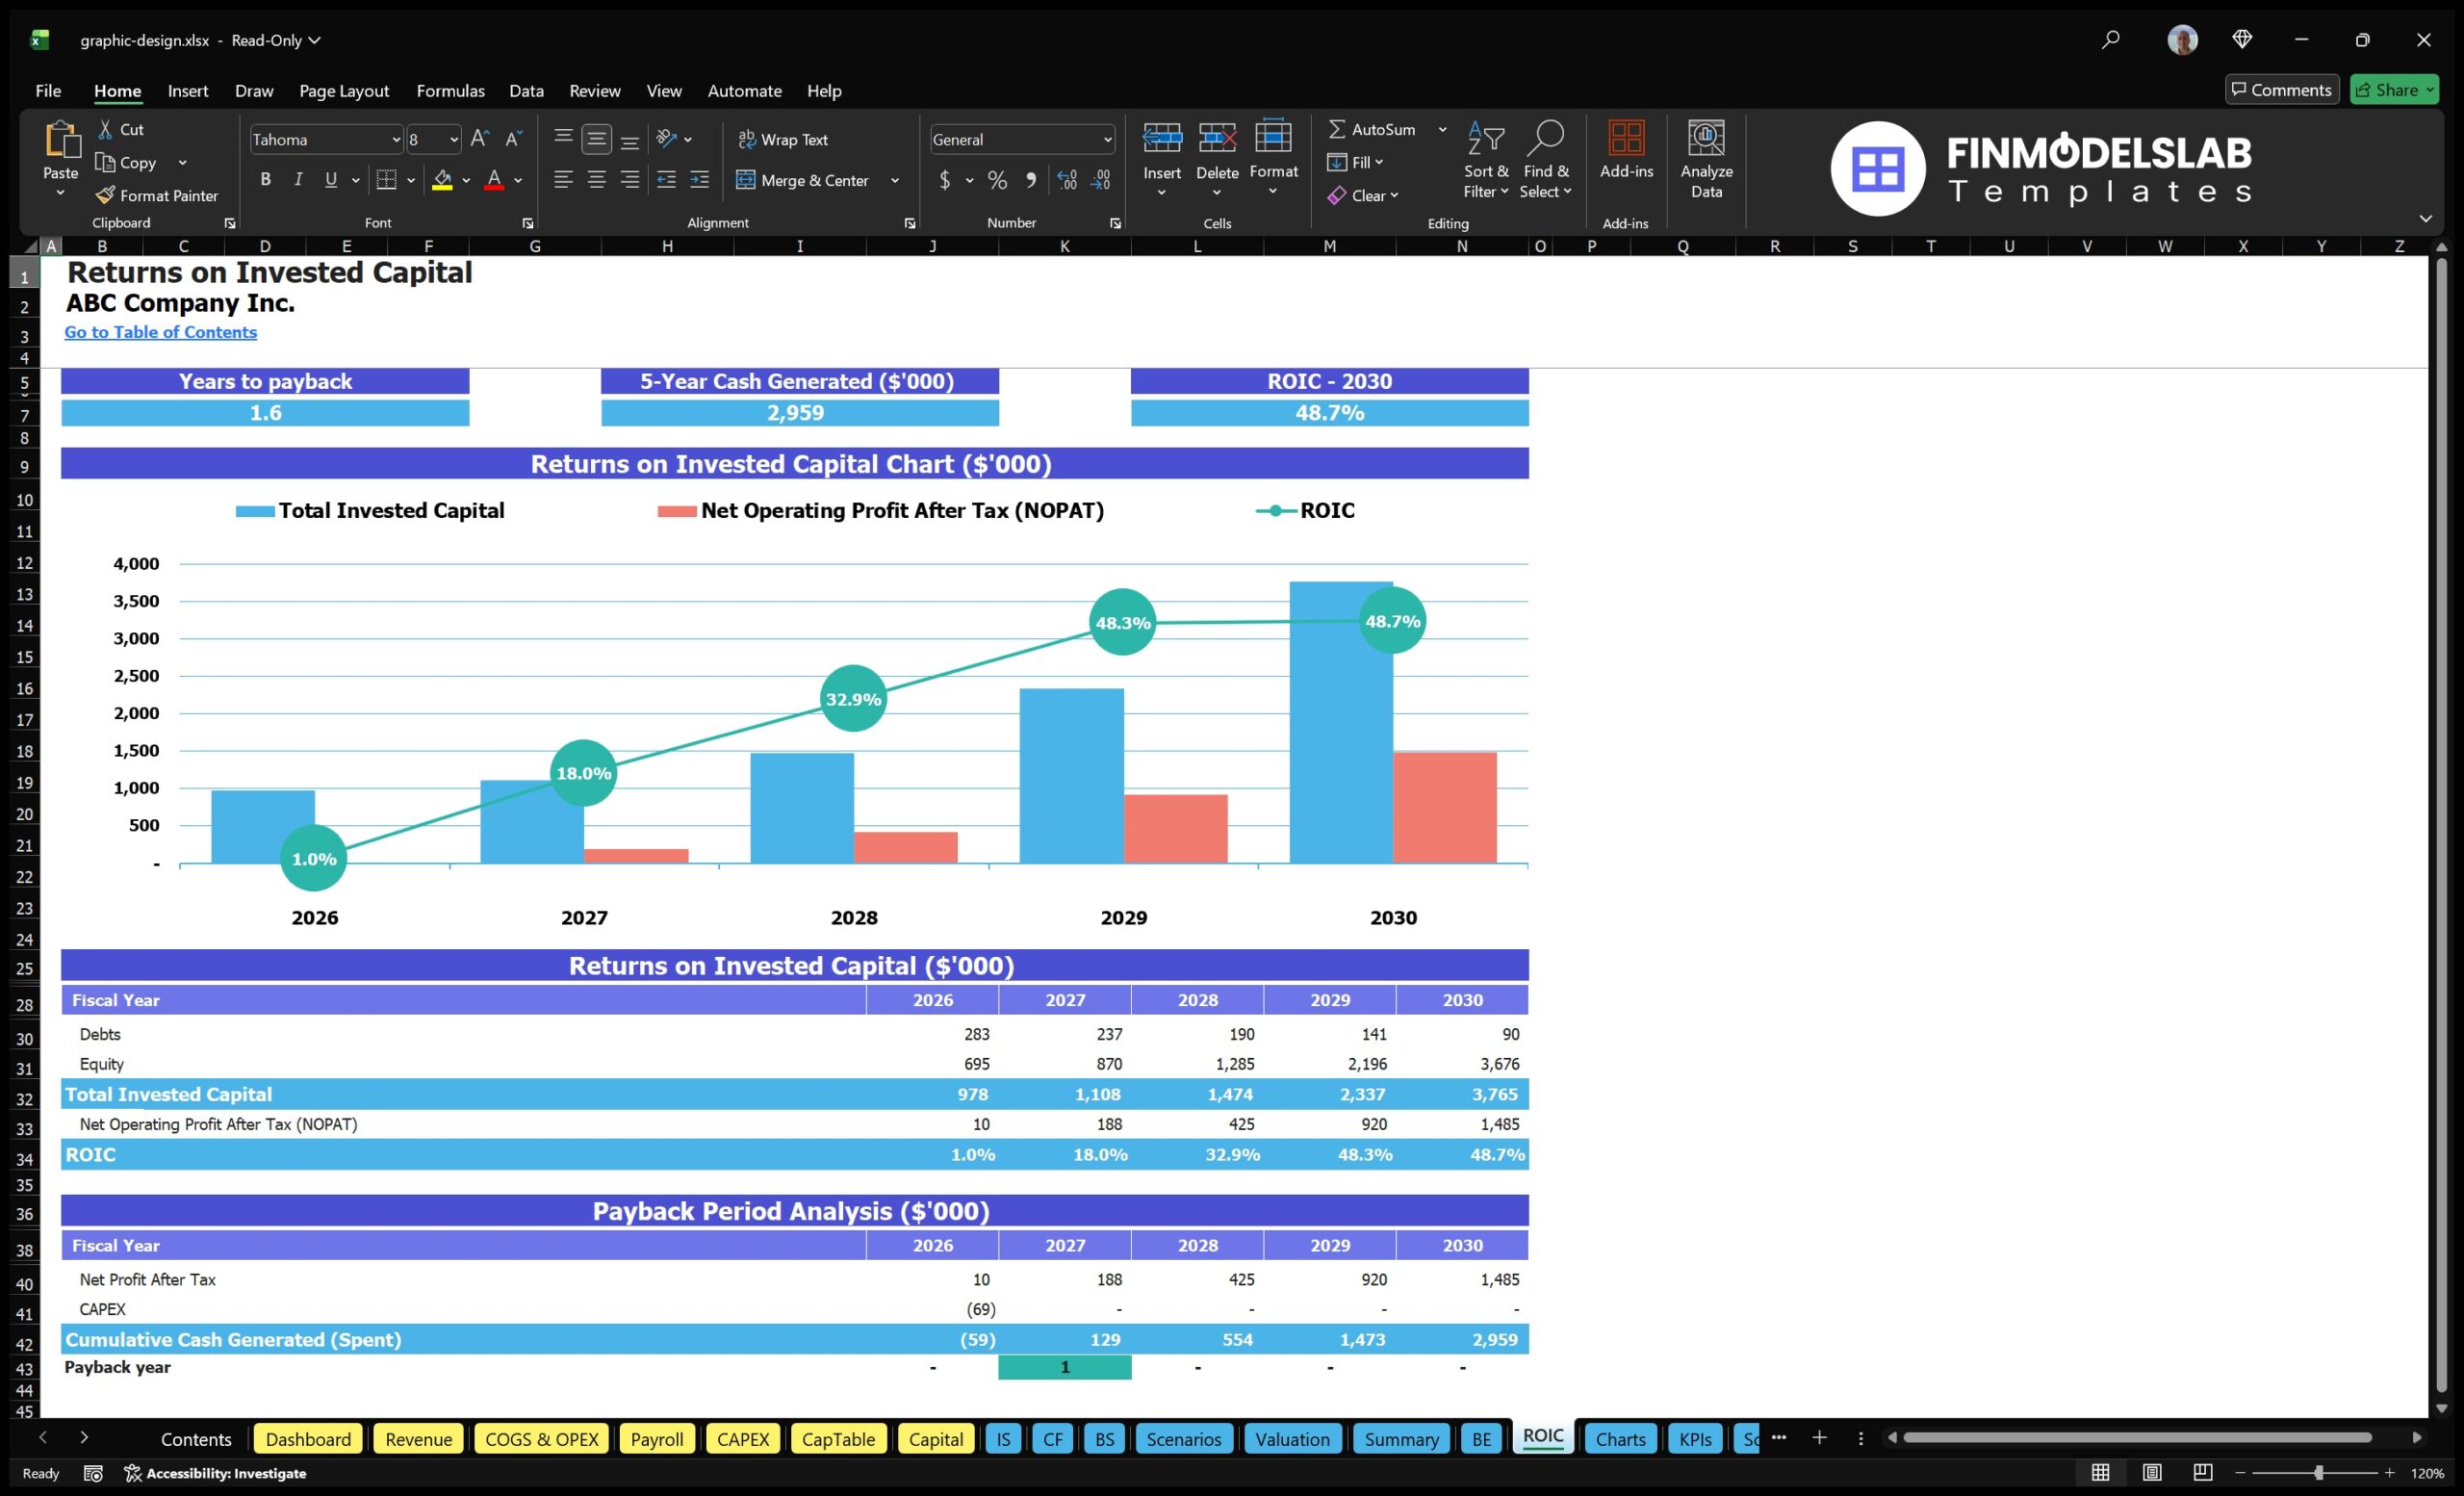
The ROE components and DuPont analysis section helps users understand the drivers behind return on equity rather than only looking at the final return figure. This is useful for a graphic design agency because strong returns can come from several different sources, including operating profitability, efficient use of assets, manageable debt levels, and disciplined cost control. The component may break return on equity into related factors such as profit margin, asset turnover, and financial leverage, giving users a more detailed view of how the business creates value. Inputs can include net income, total assets, equity, revenue, expenses, and financing assumptions, while outputs can show how changes in profitability or capital structure affect returns. This analysis is especially helpful for investors, founders, and financial planners who want to evaluate whether the agency is using capital efficiently. It also supports decision-making around hiring, equipment purchases, software investments, borrowing, and owner equity contributions by showing how those choices may influence long-term financial performance.
Revenue Inputs and Assumption Planning
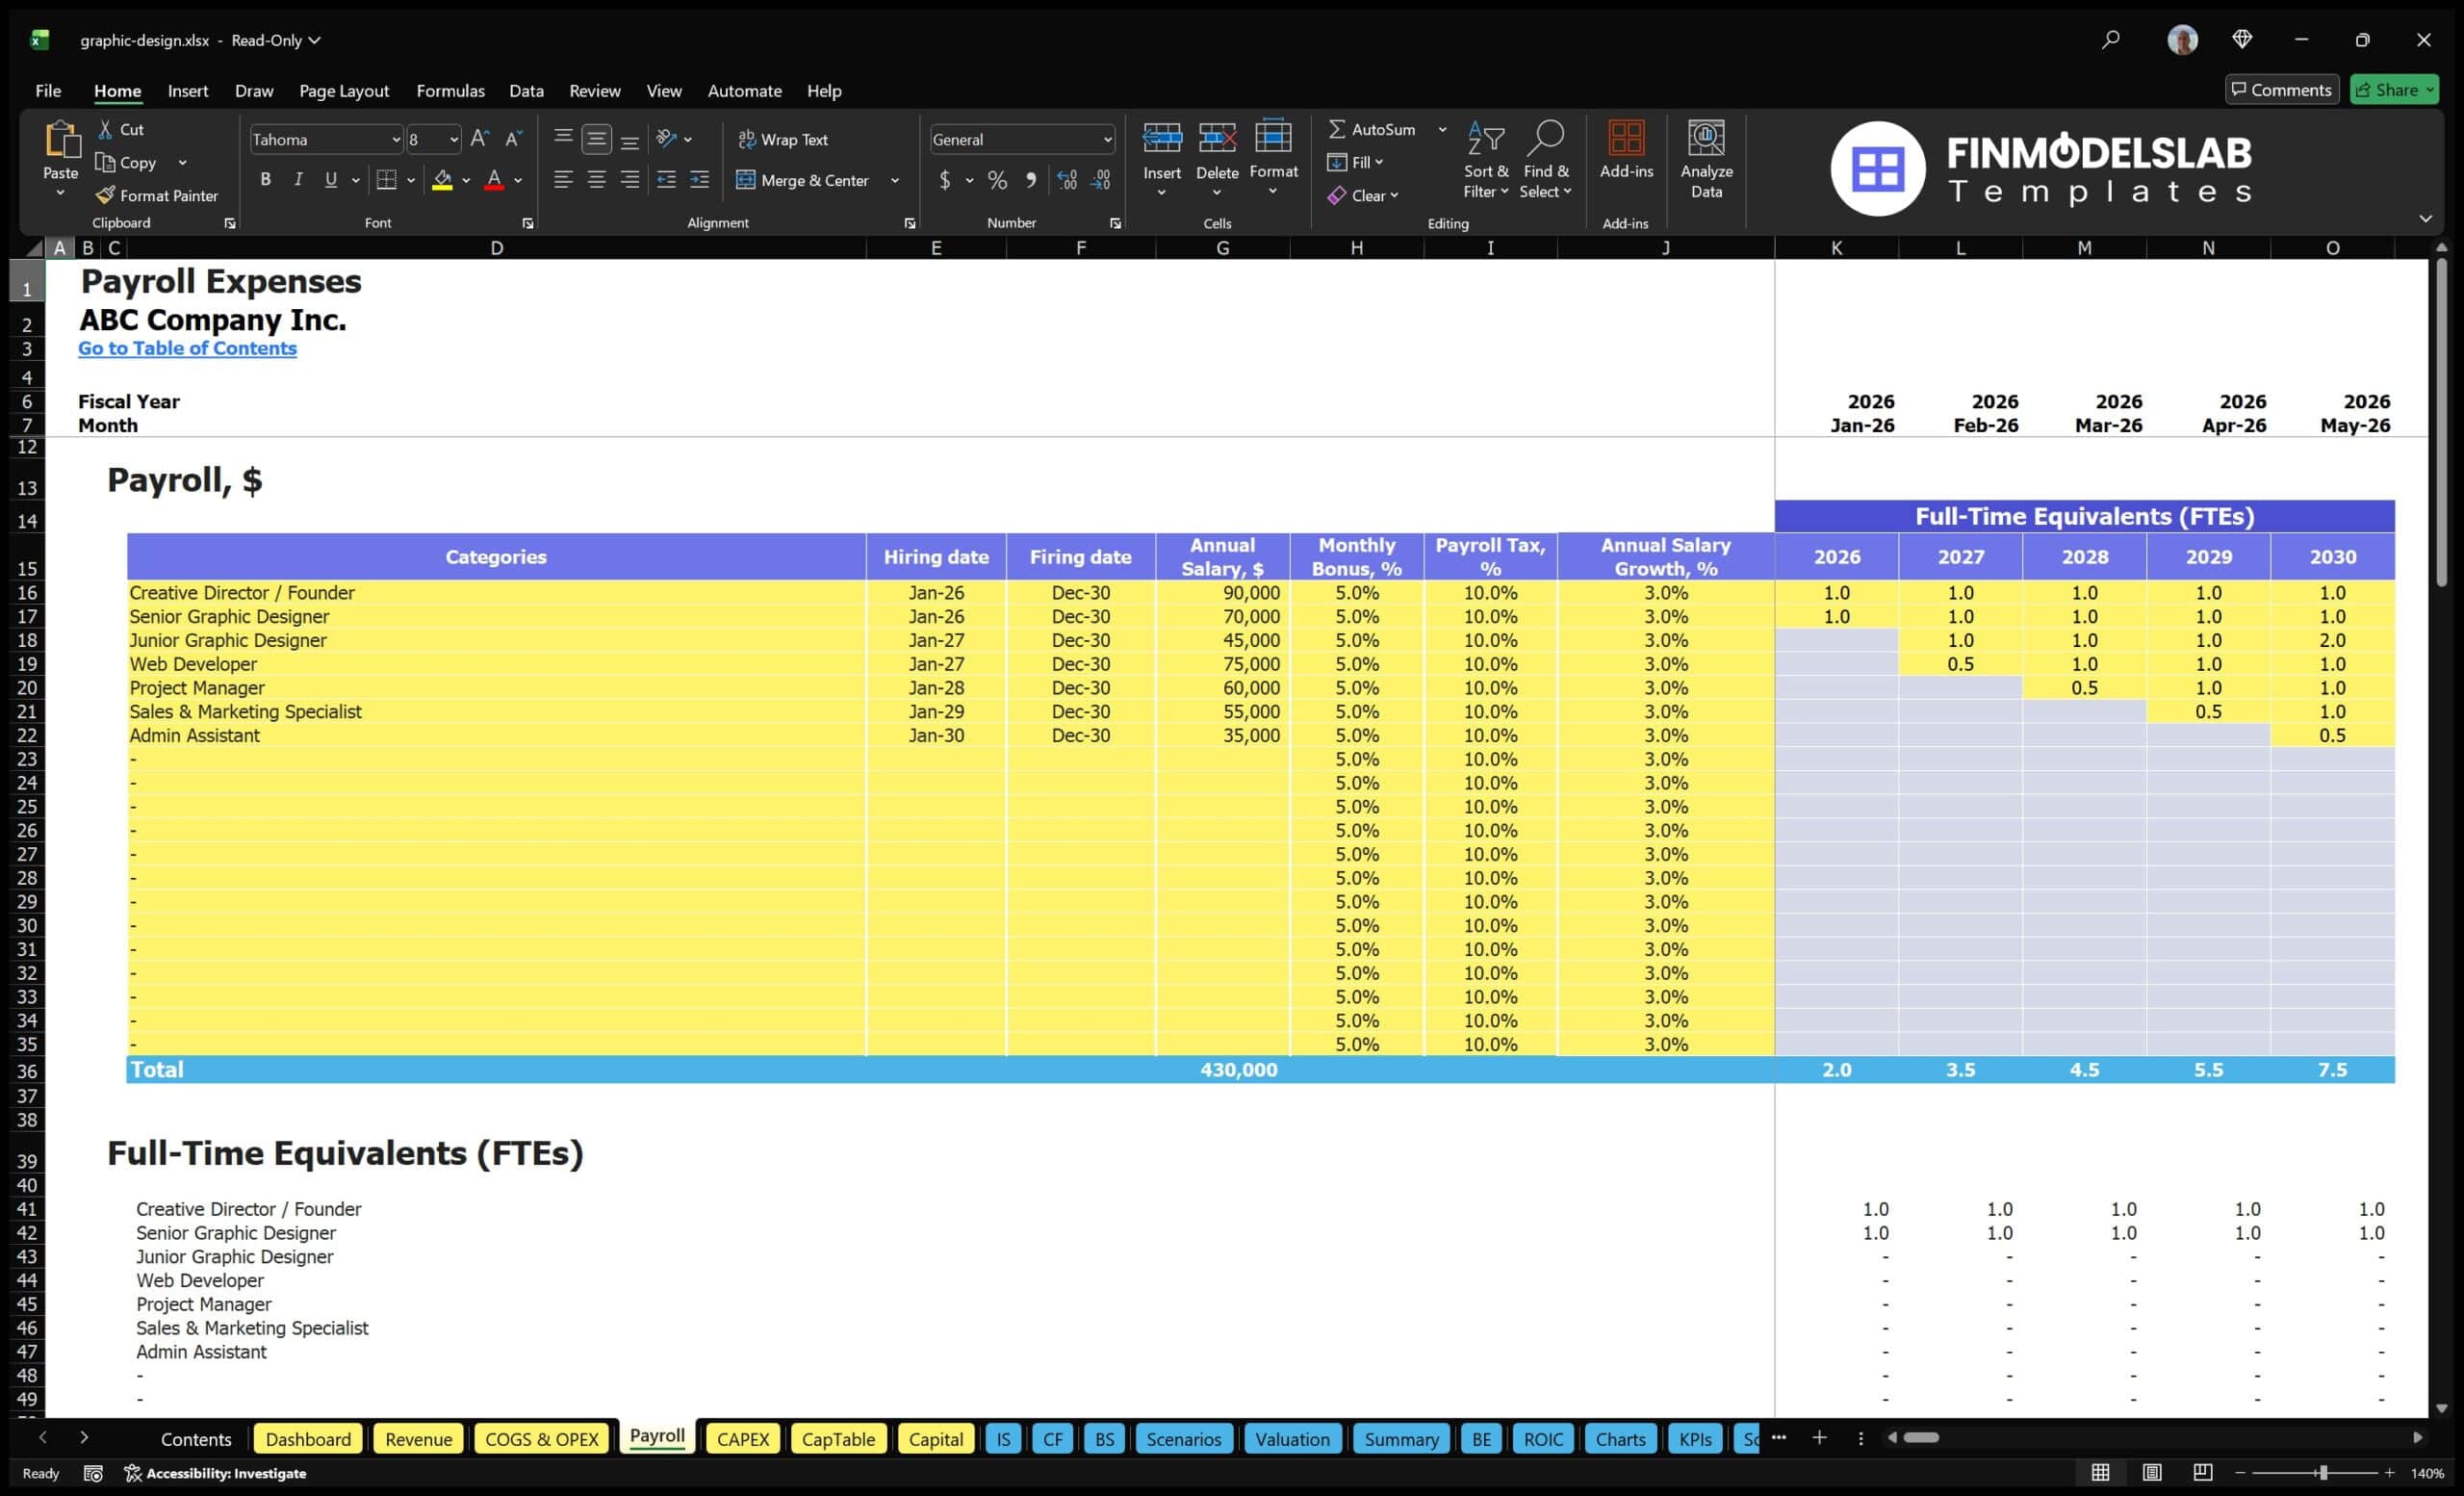
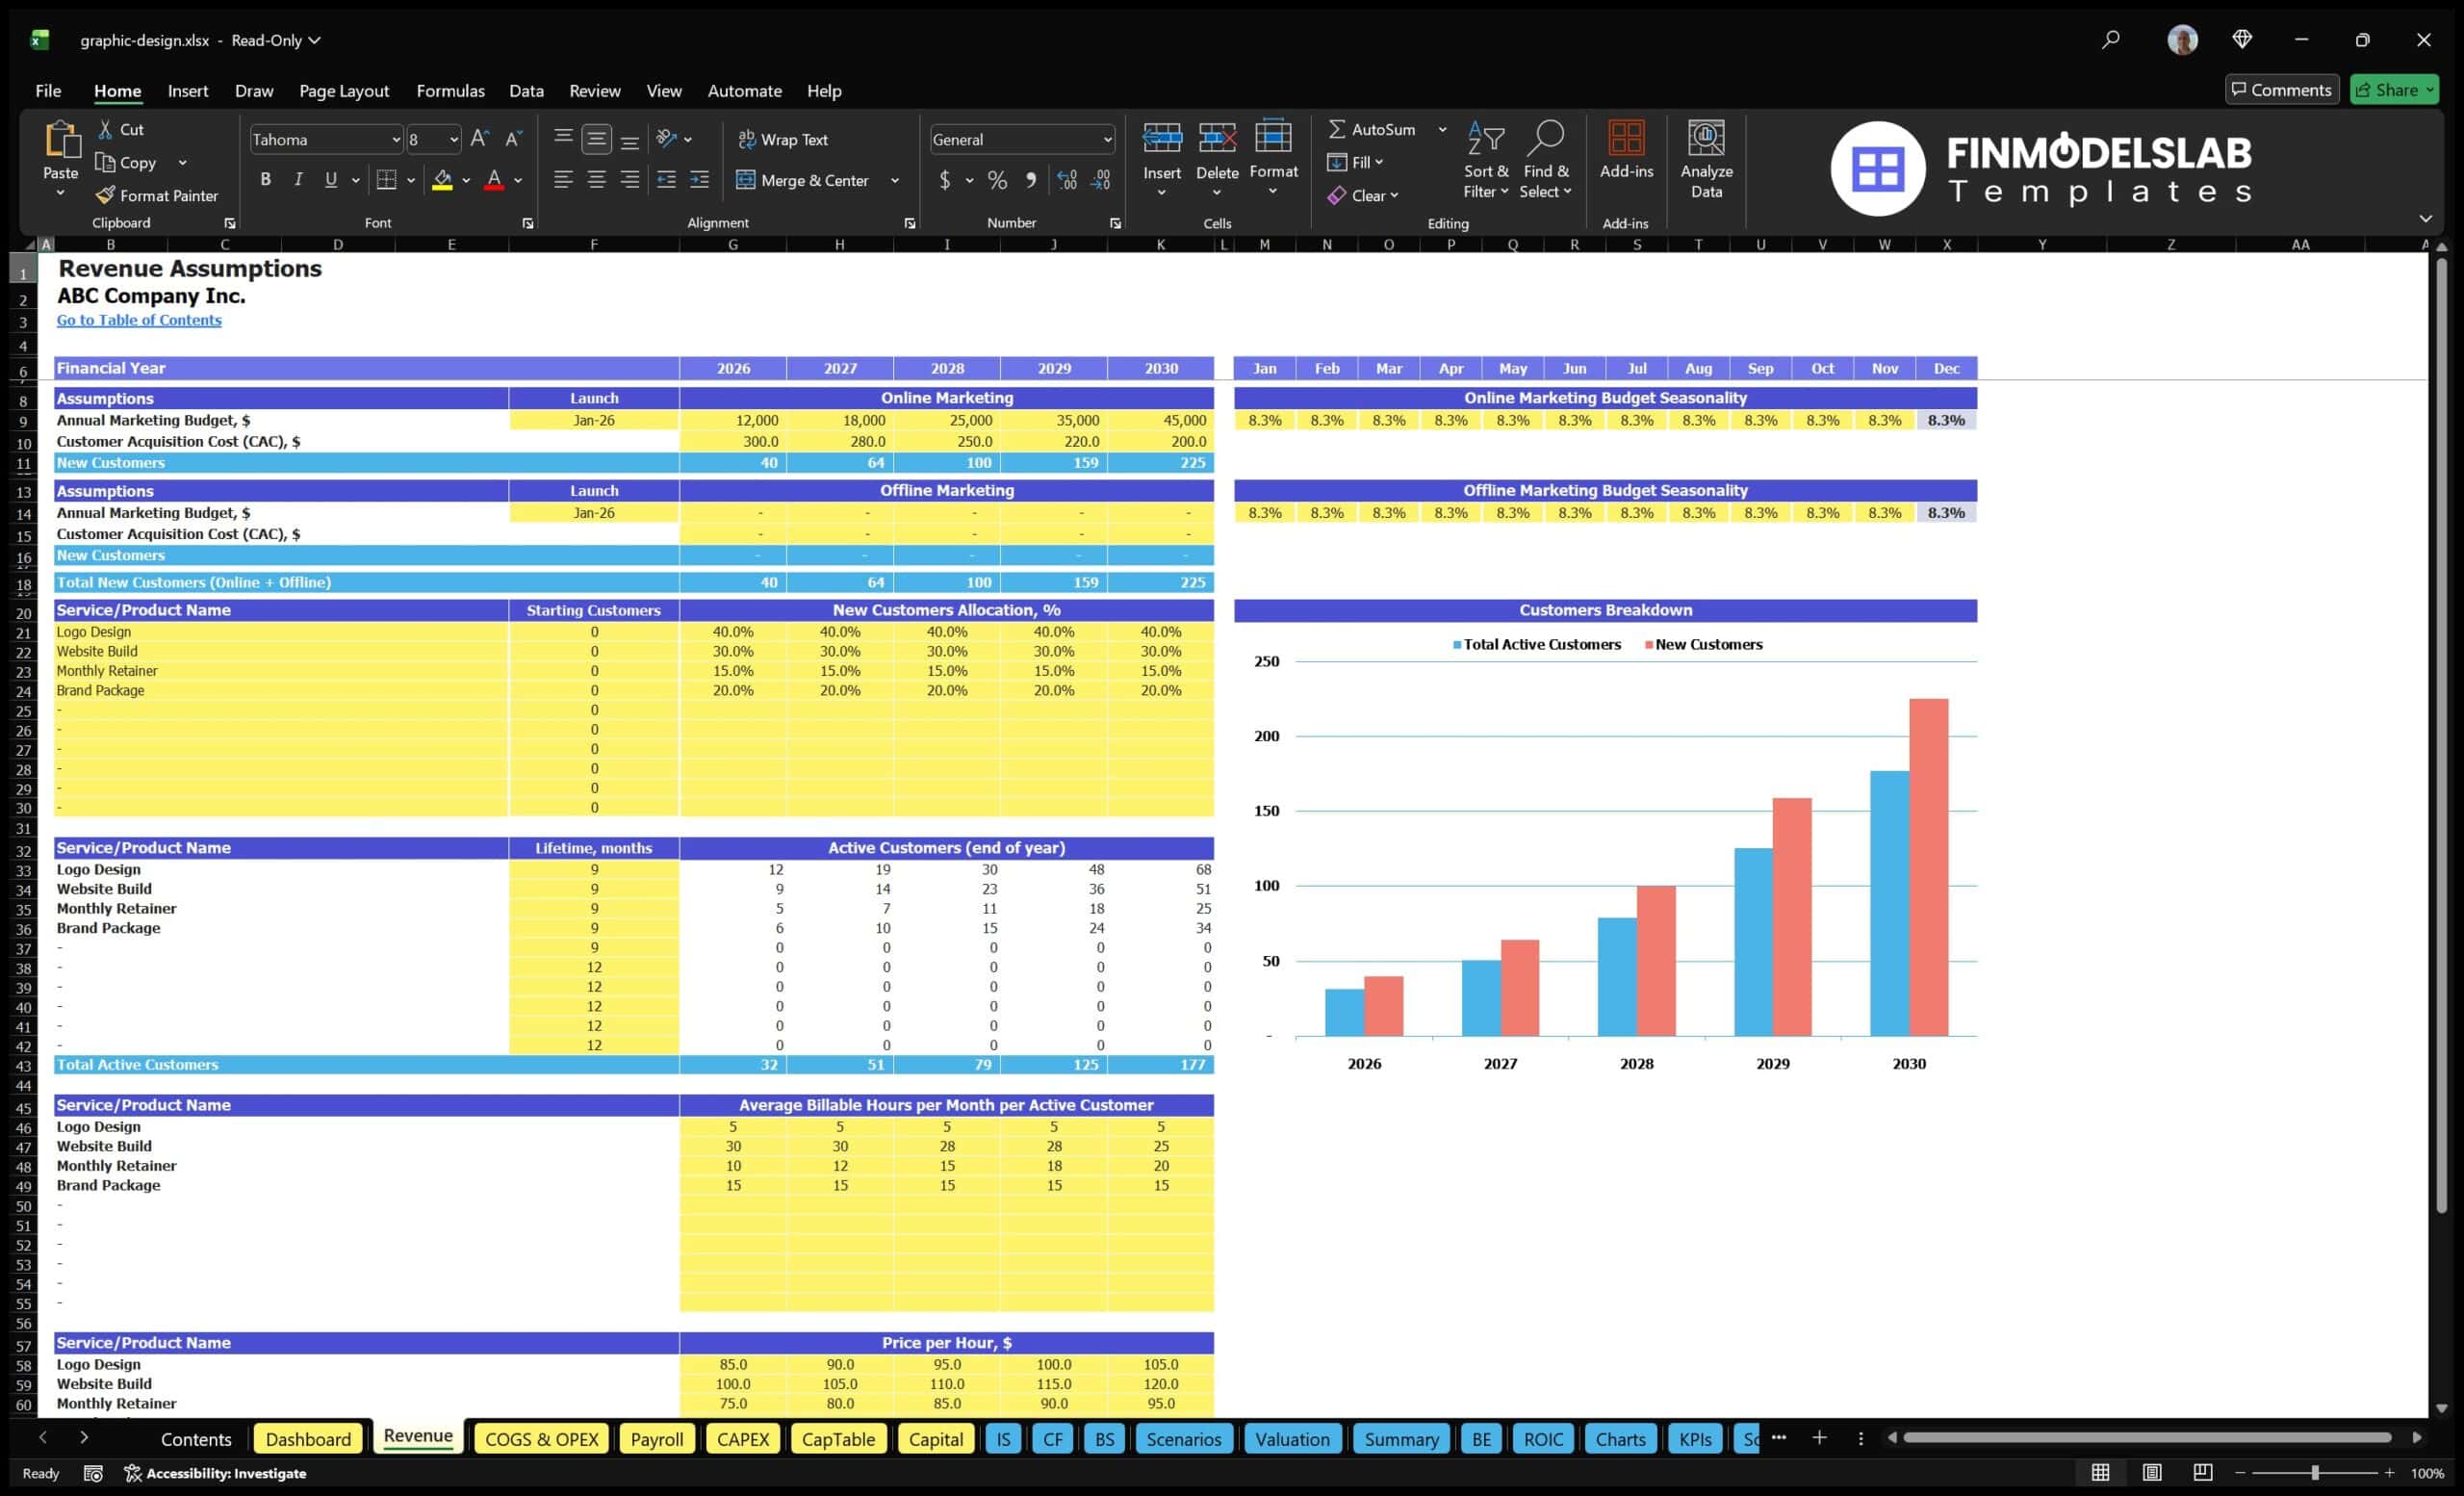
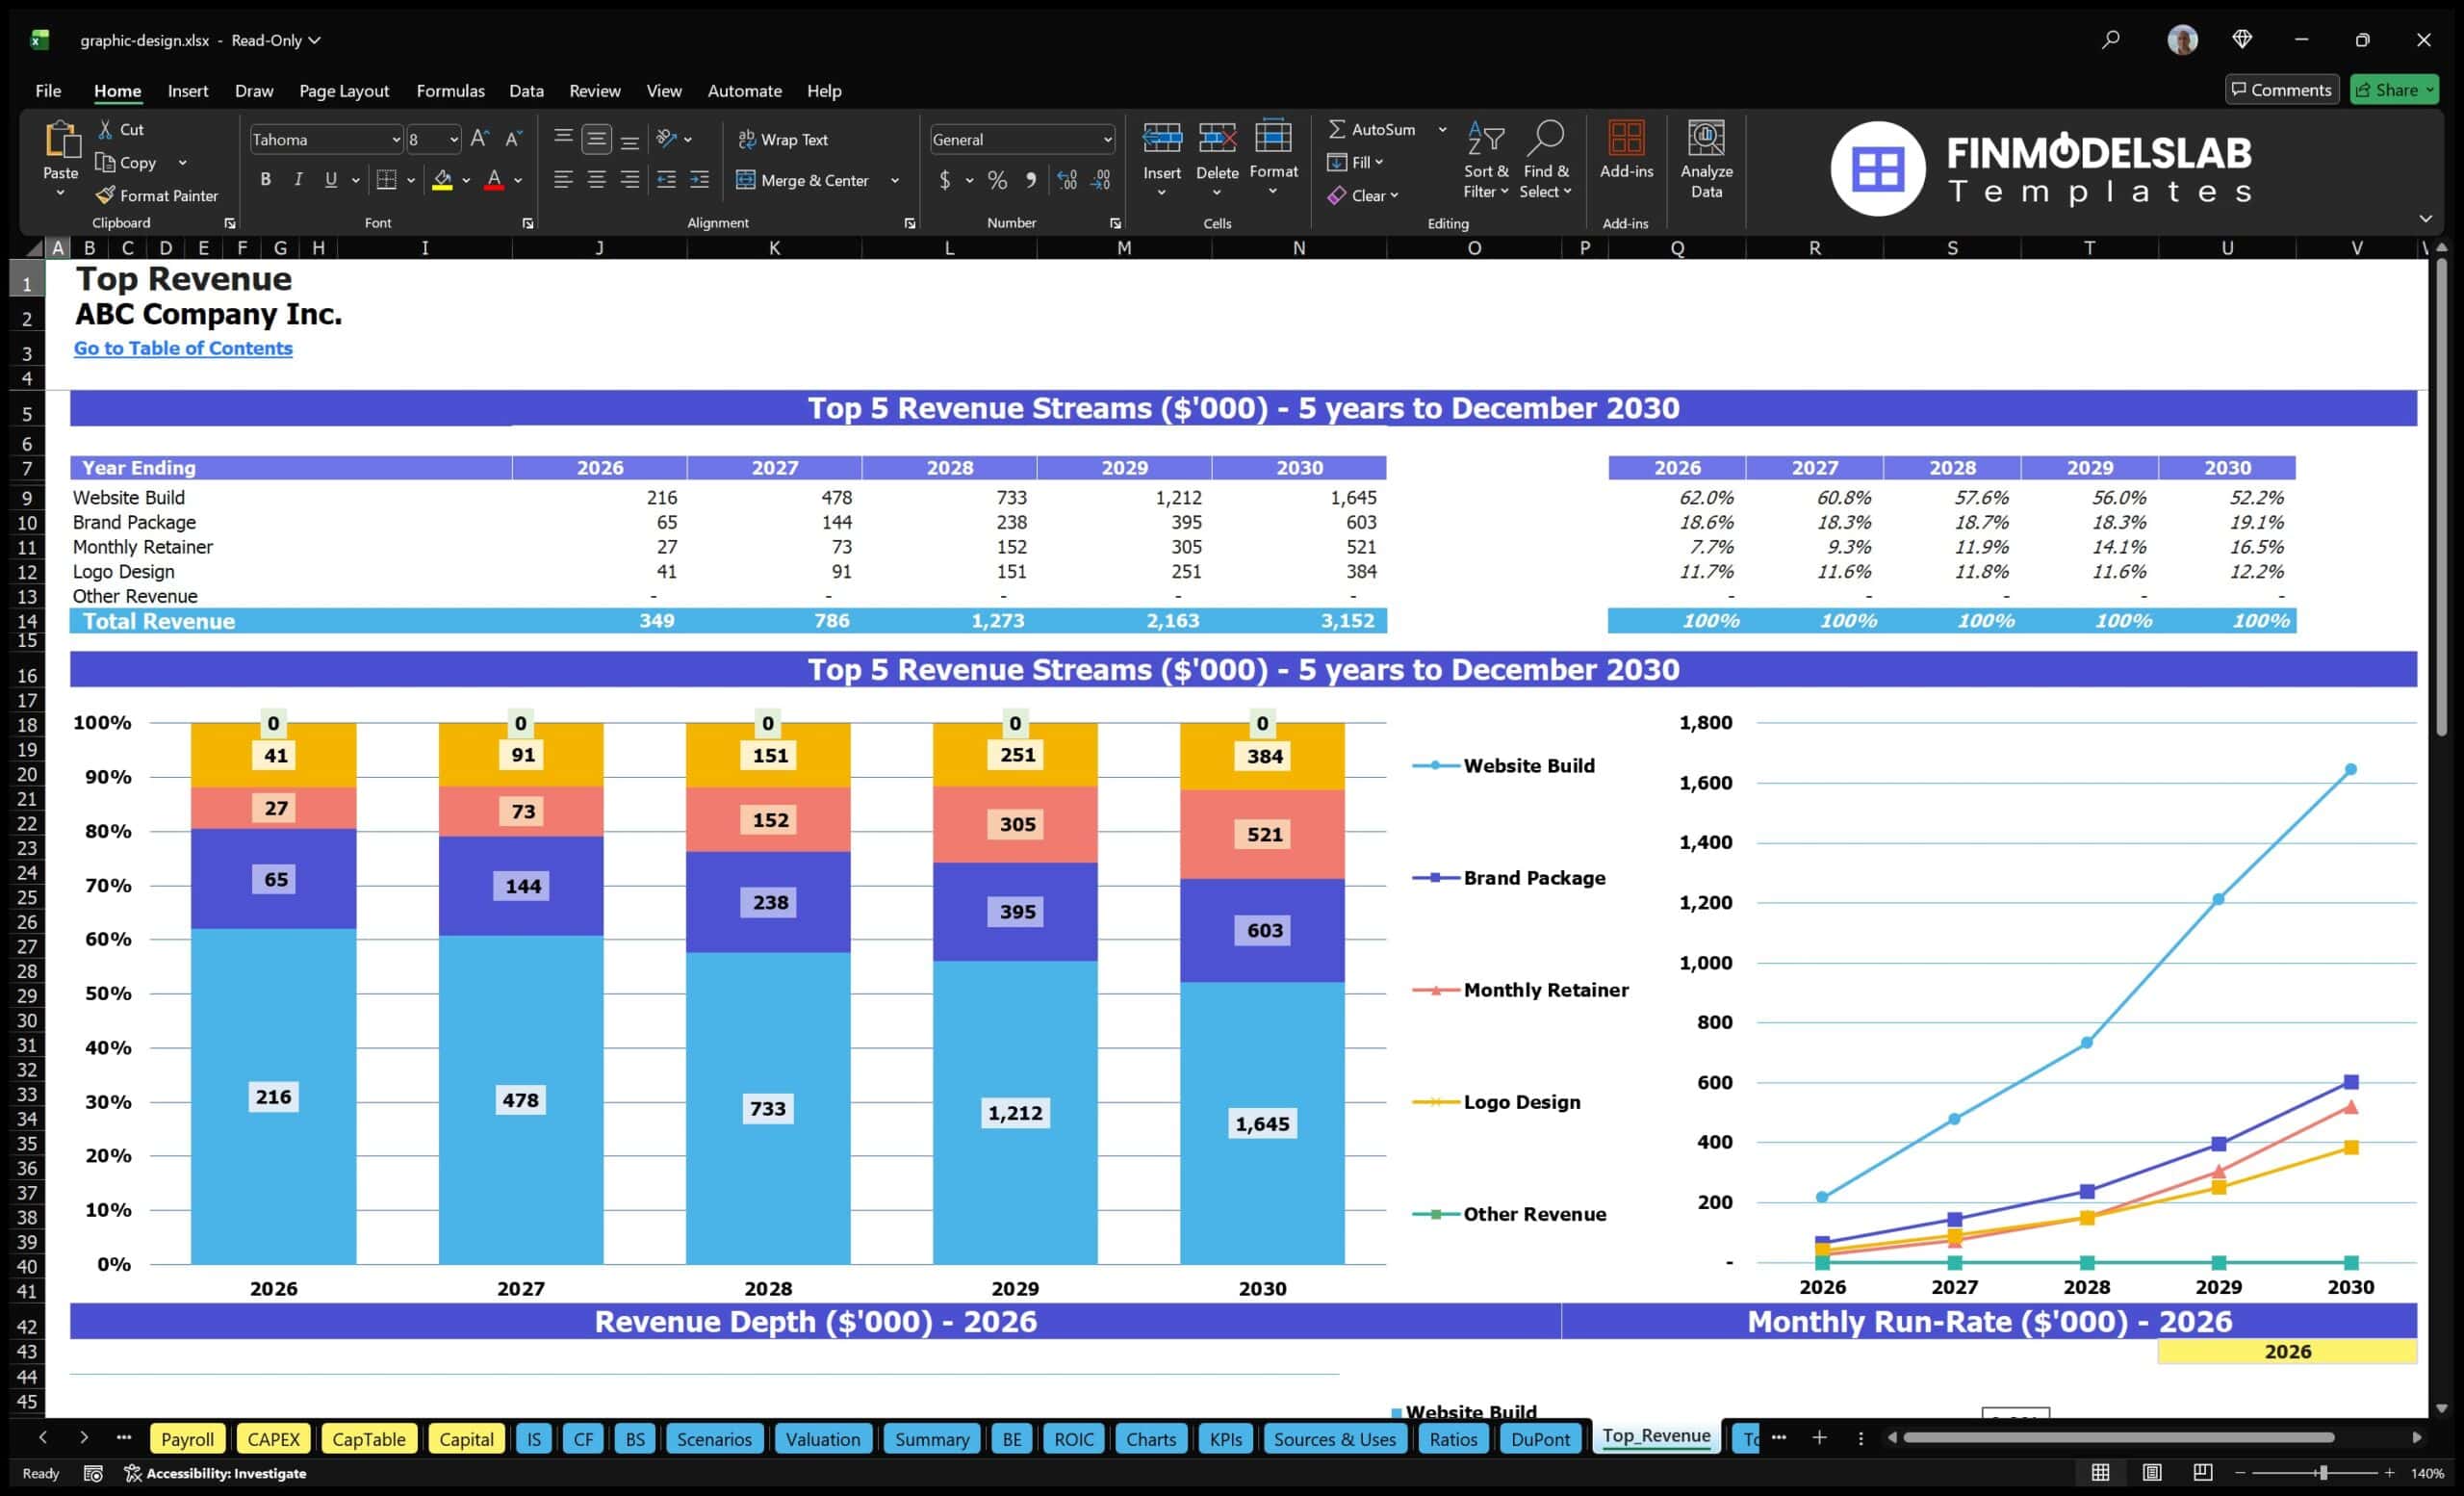
The revenue inputs and assumption planning section is where users define the commercial engine of the graphic design agency. It can include assumptions for service categories such as logo design, website builds, brand packages, creative strategy, and monthly retainers, along with pricing, active customers, billable hours, conversion rates, customer growth, and service mix. For an agency, revenue is not just a single sales number; it is the result of how many clients are served, what services they buy, how much time each project requires, and how pricing changes over time. This component helps users document those assumptions clearly and connect them to the forecast. It can also support planning for a shift from one-off project work toward more predictable recurring retainer income, which is often important for stabilizing cash flow and improving margins. By organizing revenue drivers in one place, the model allows users to test pricing strategies, estimate capacity needs, validate growth plans, and build a more credible revenue forecast for business plans, funding requests, or internal budgets.
Bank-Ready Financial Reports
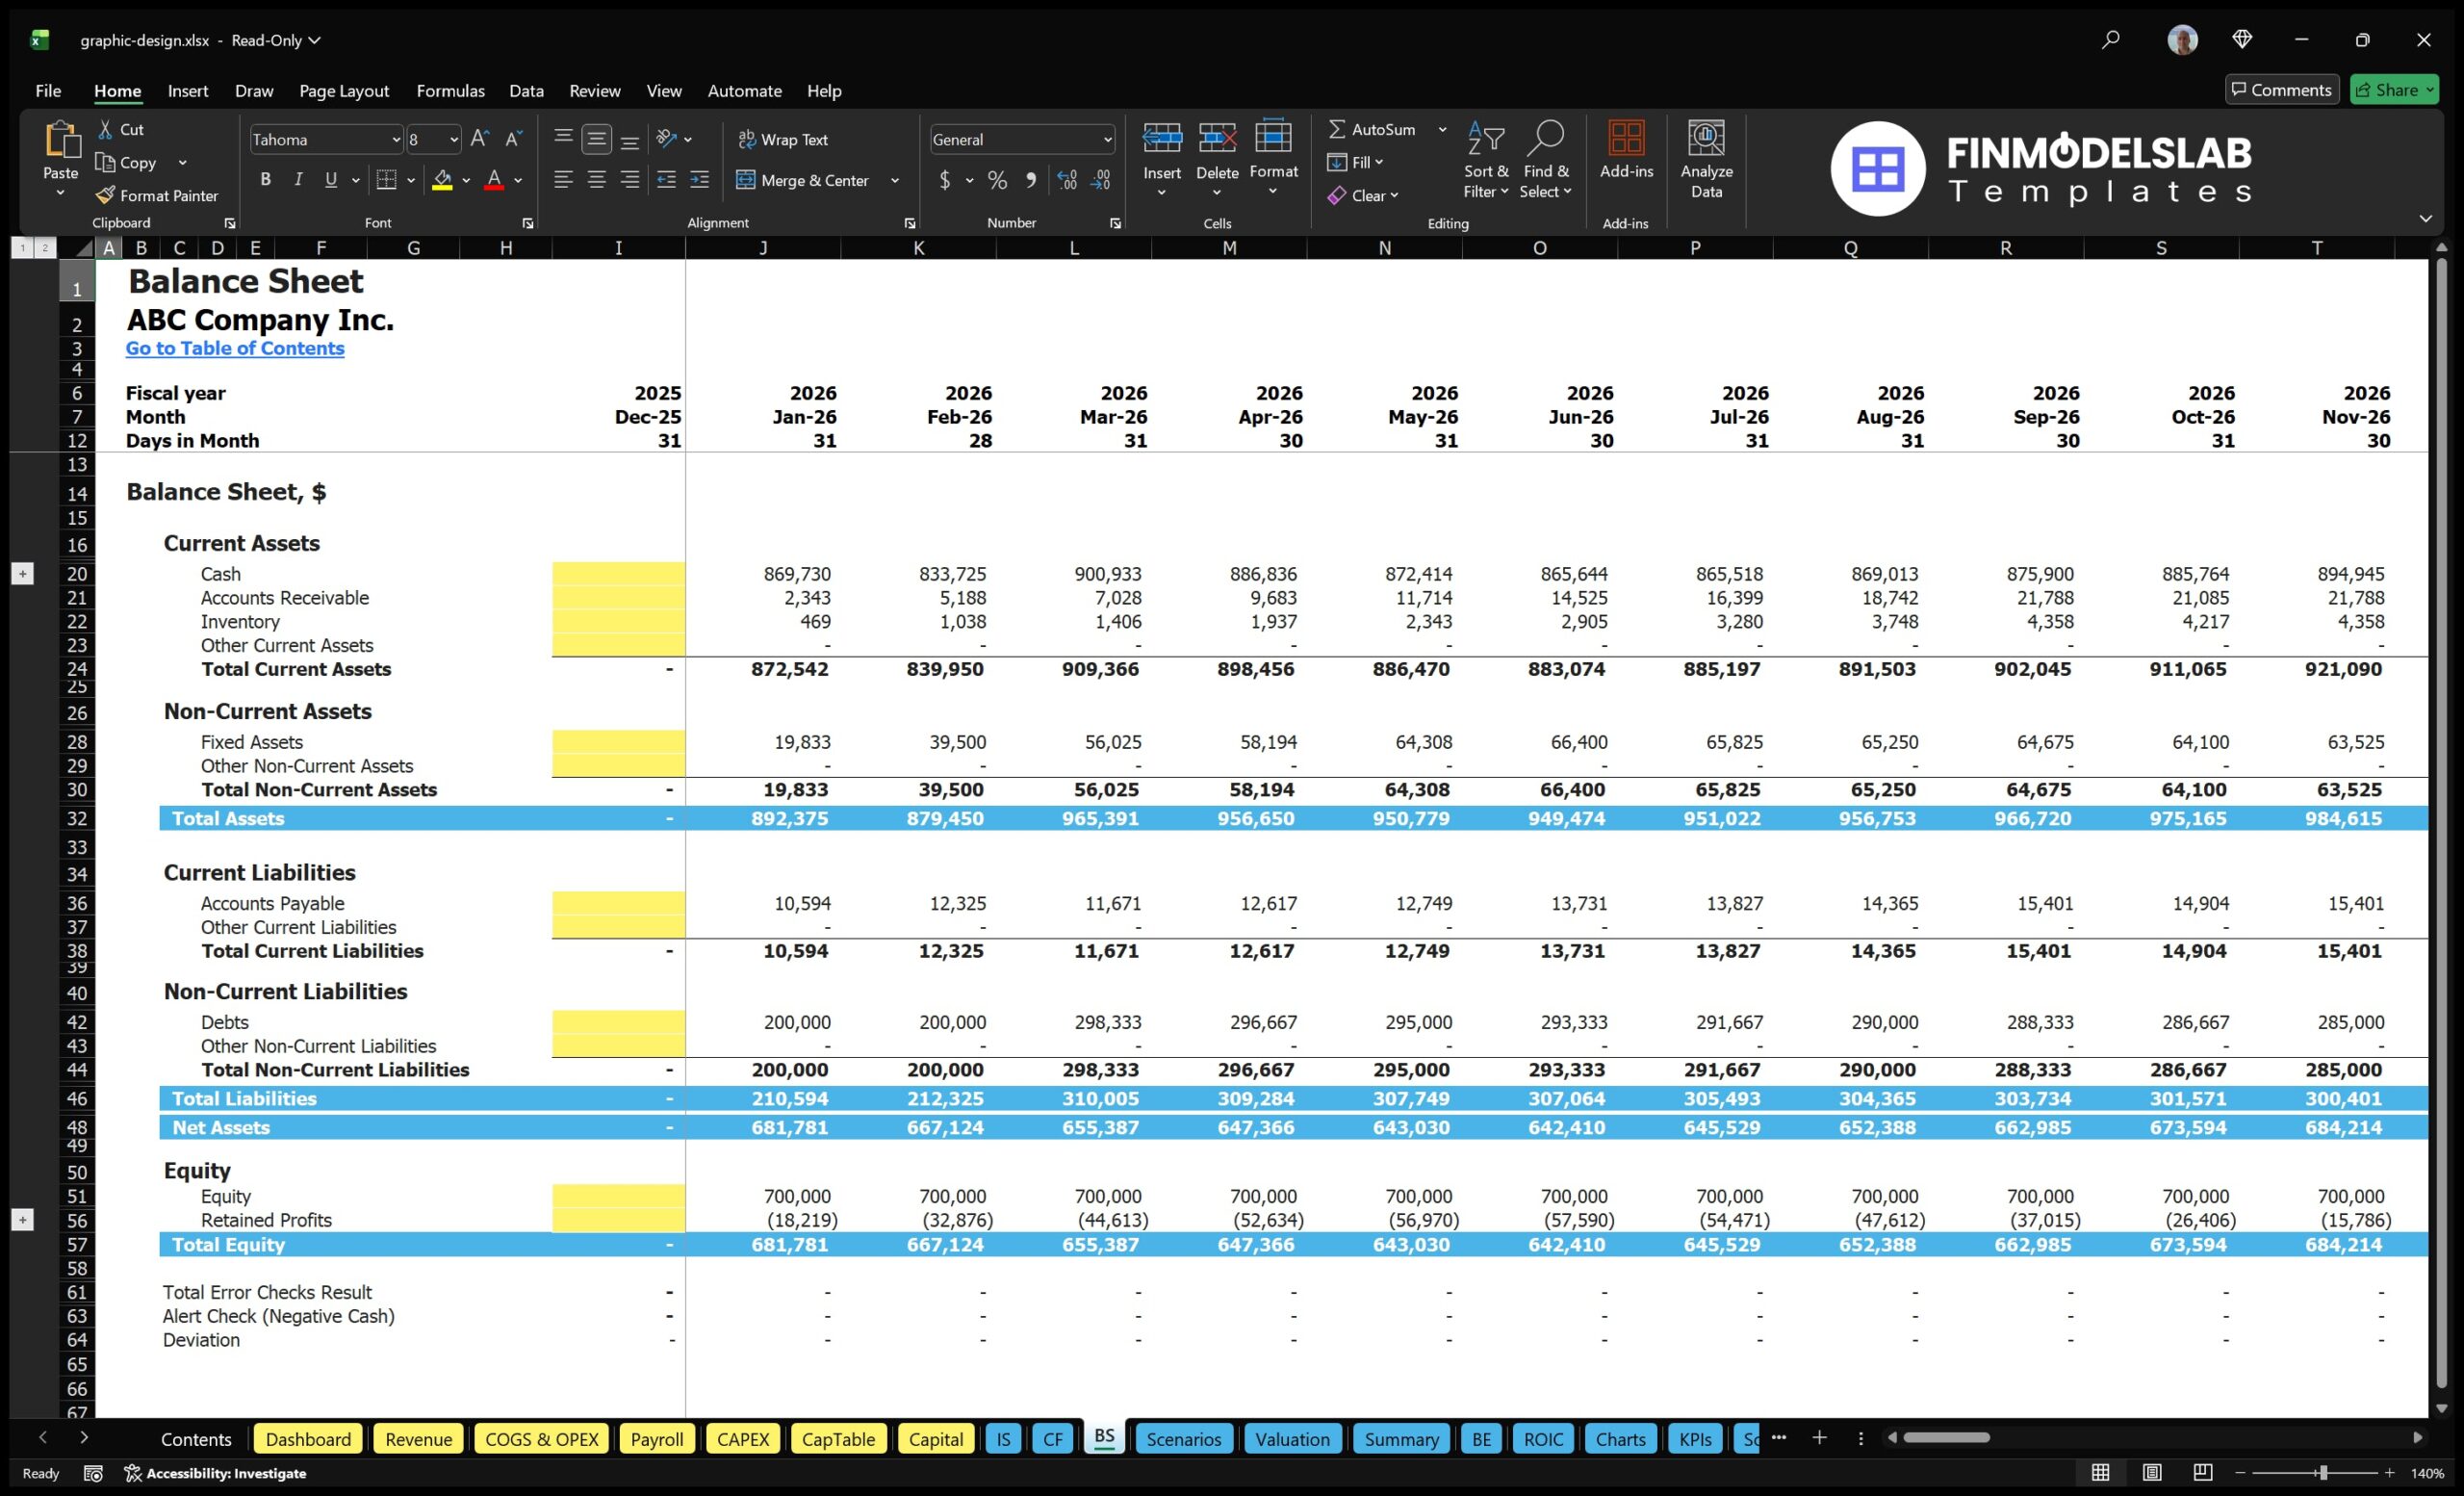
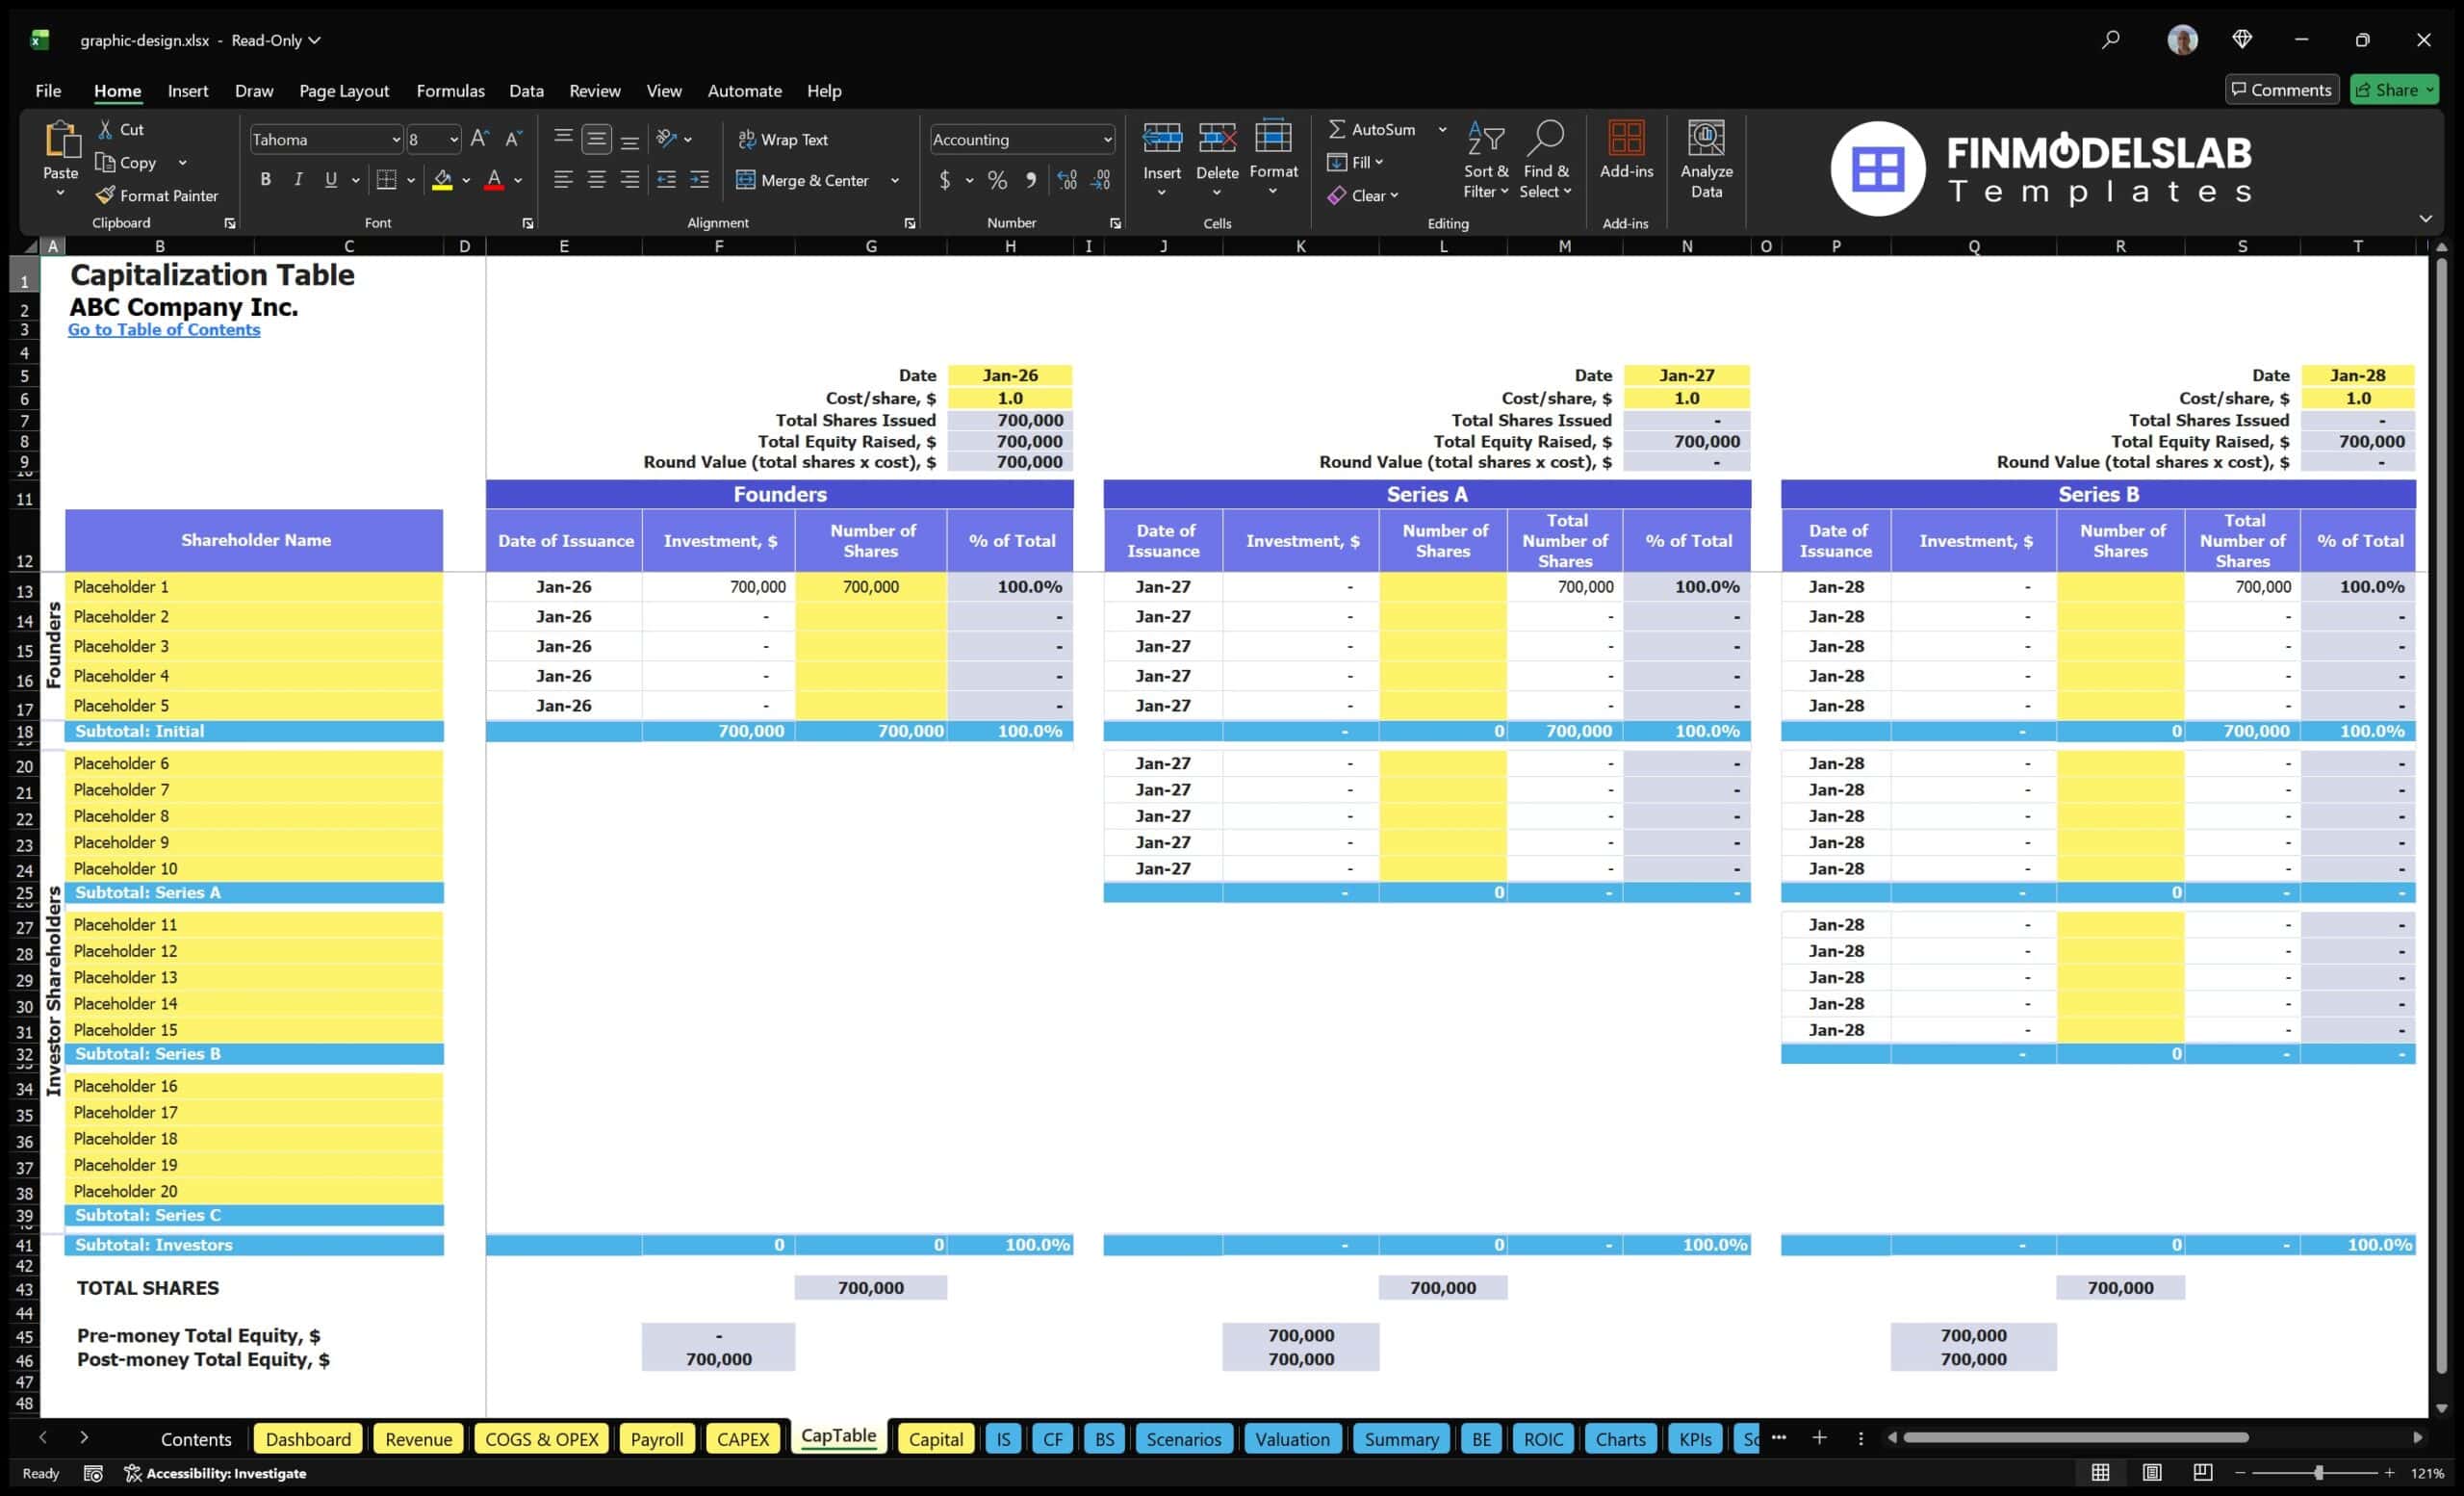
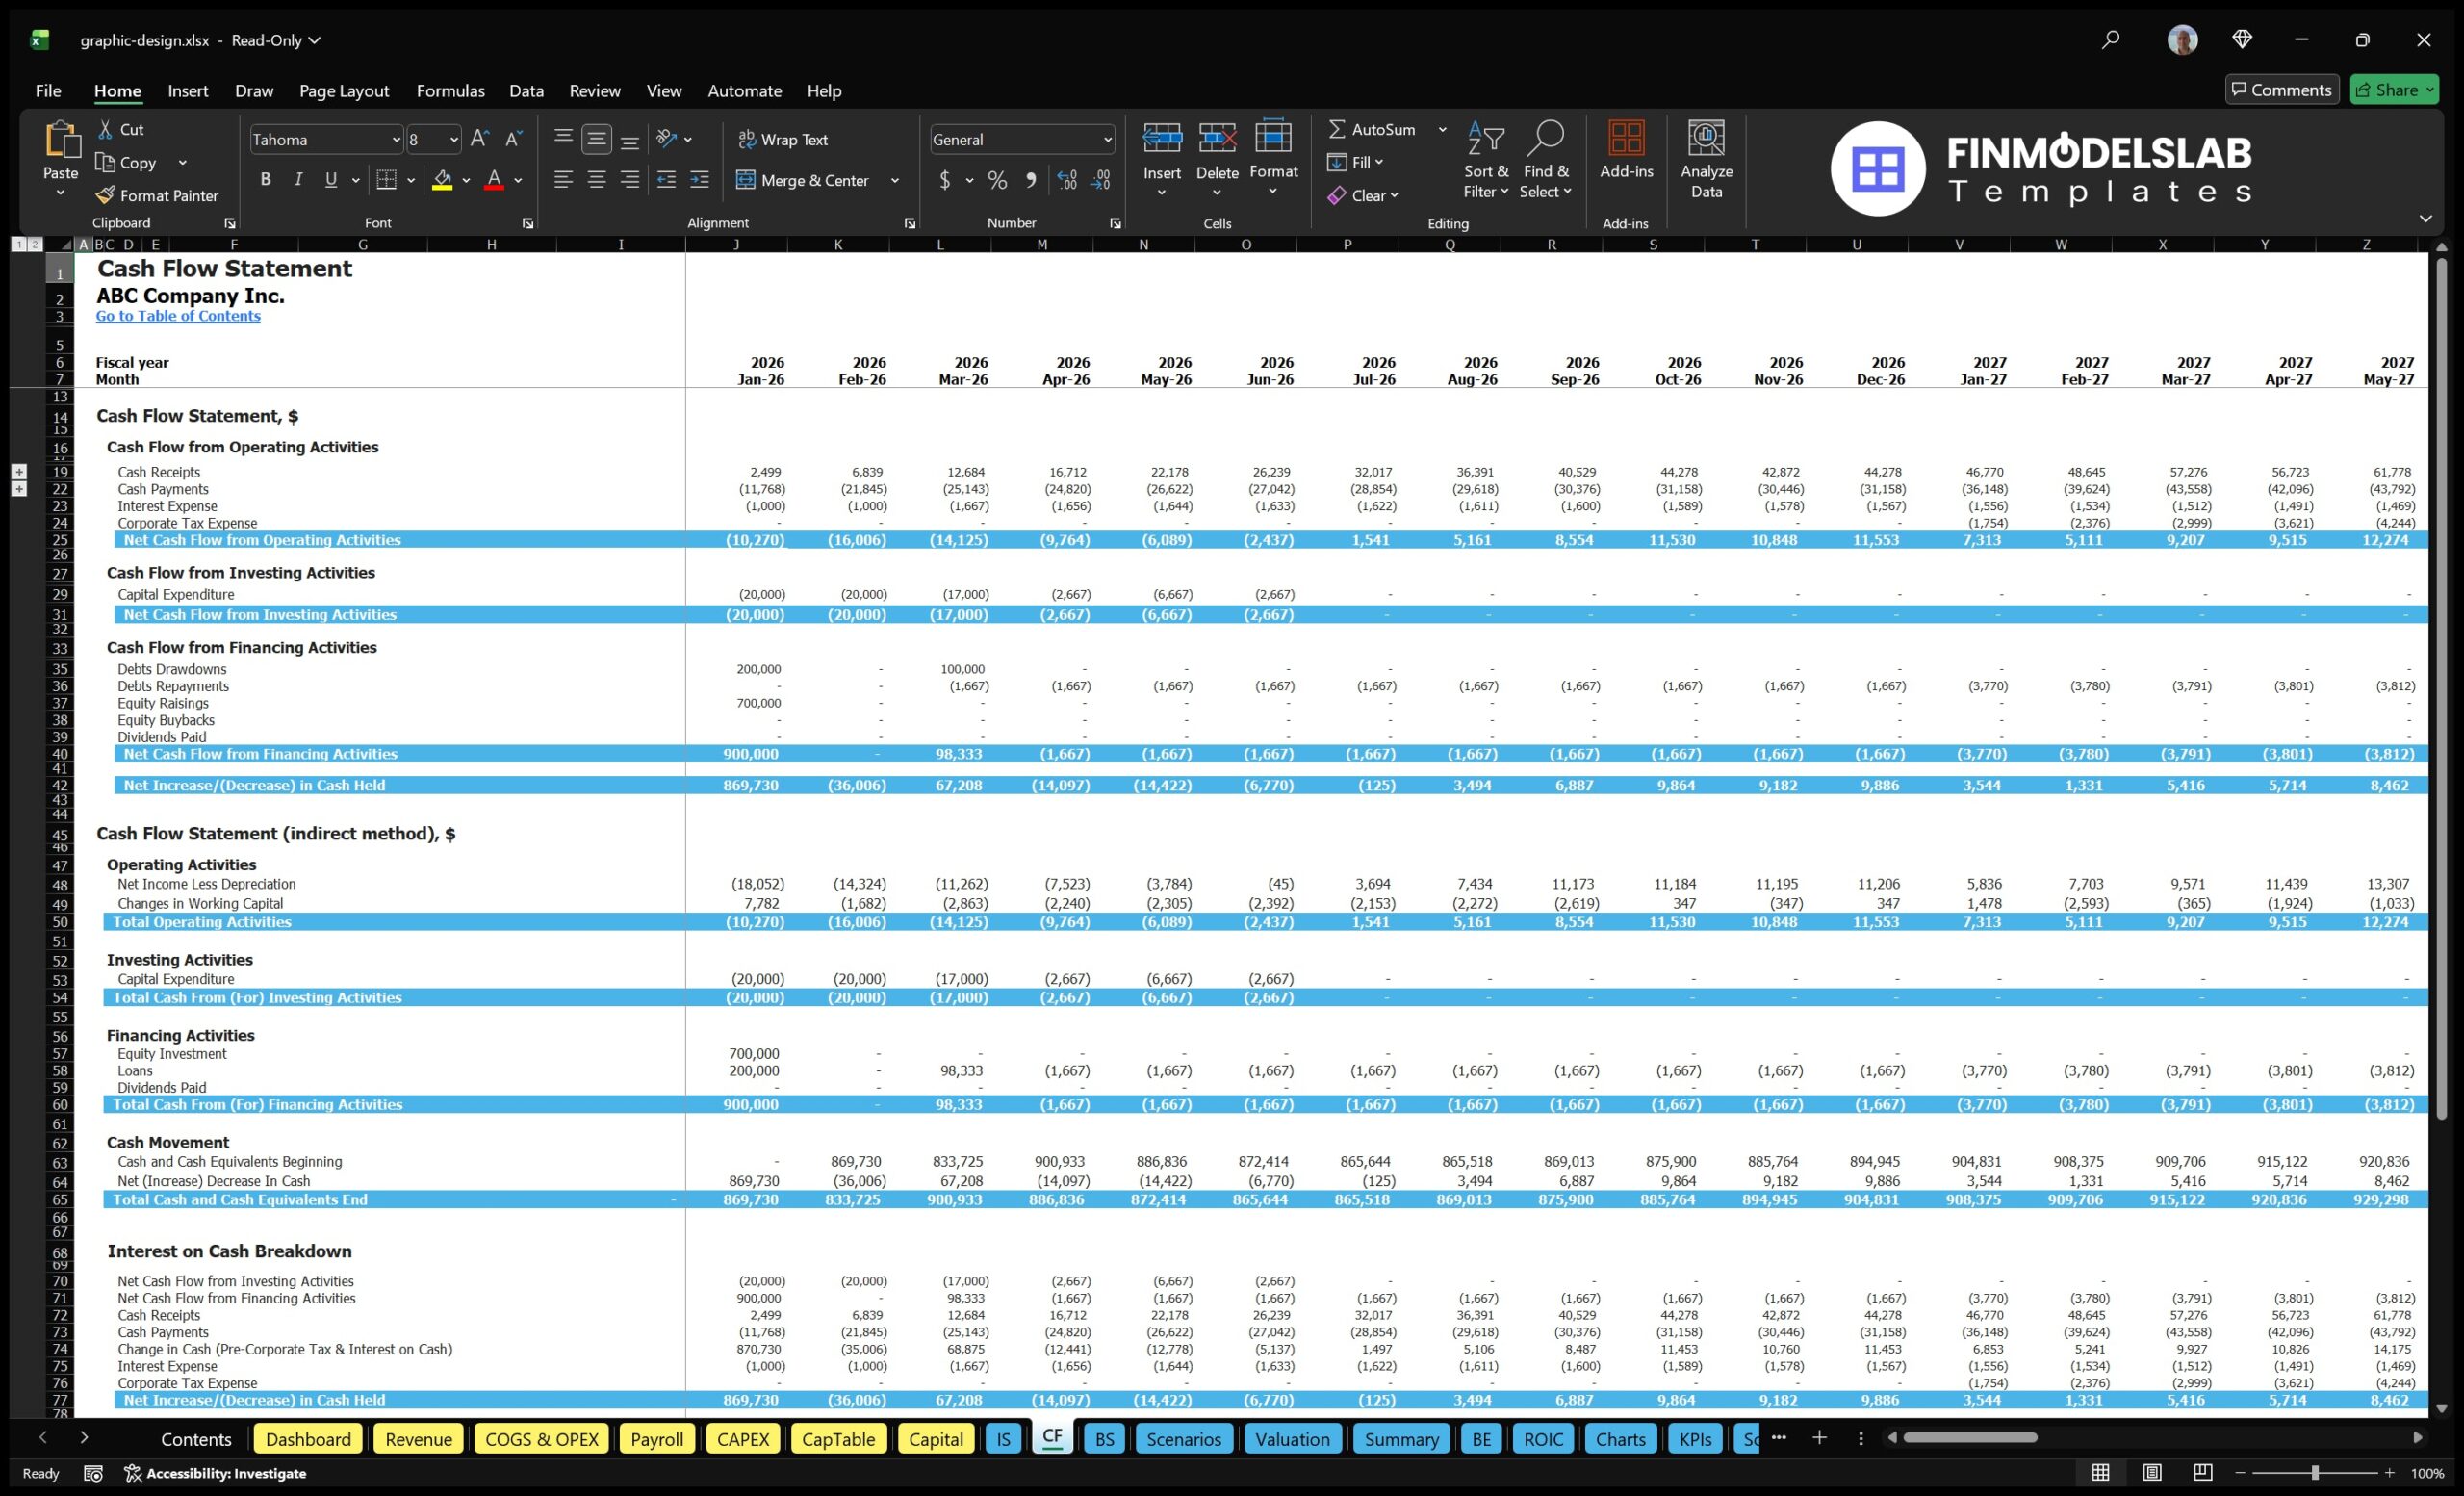
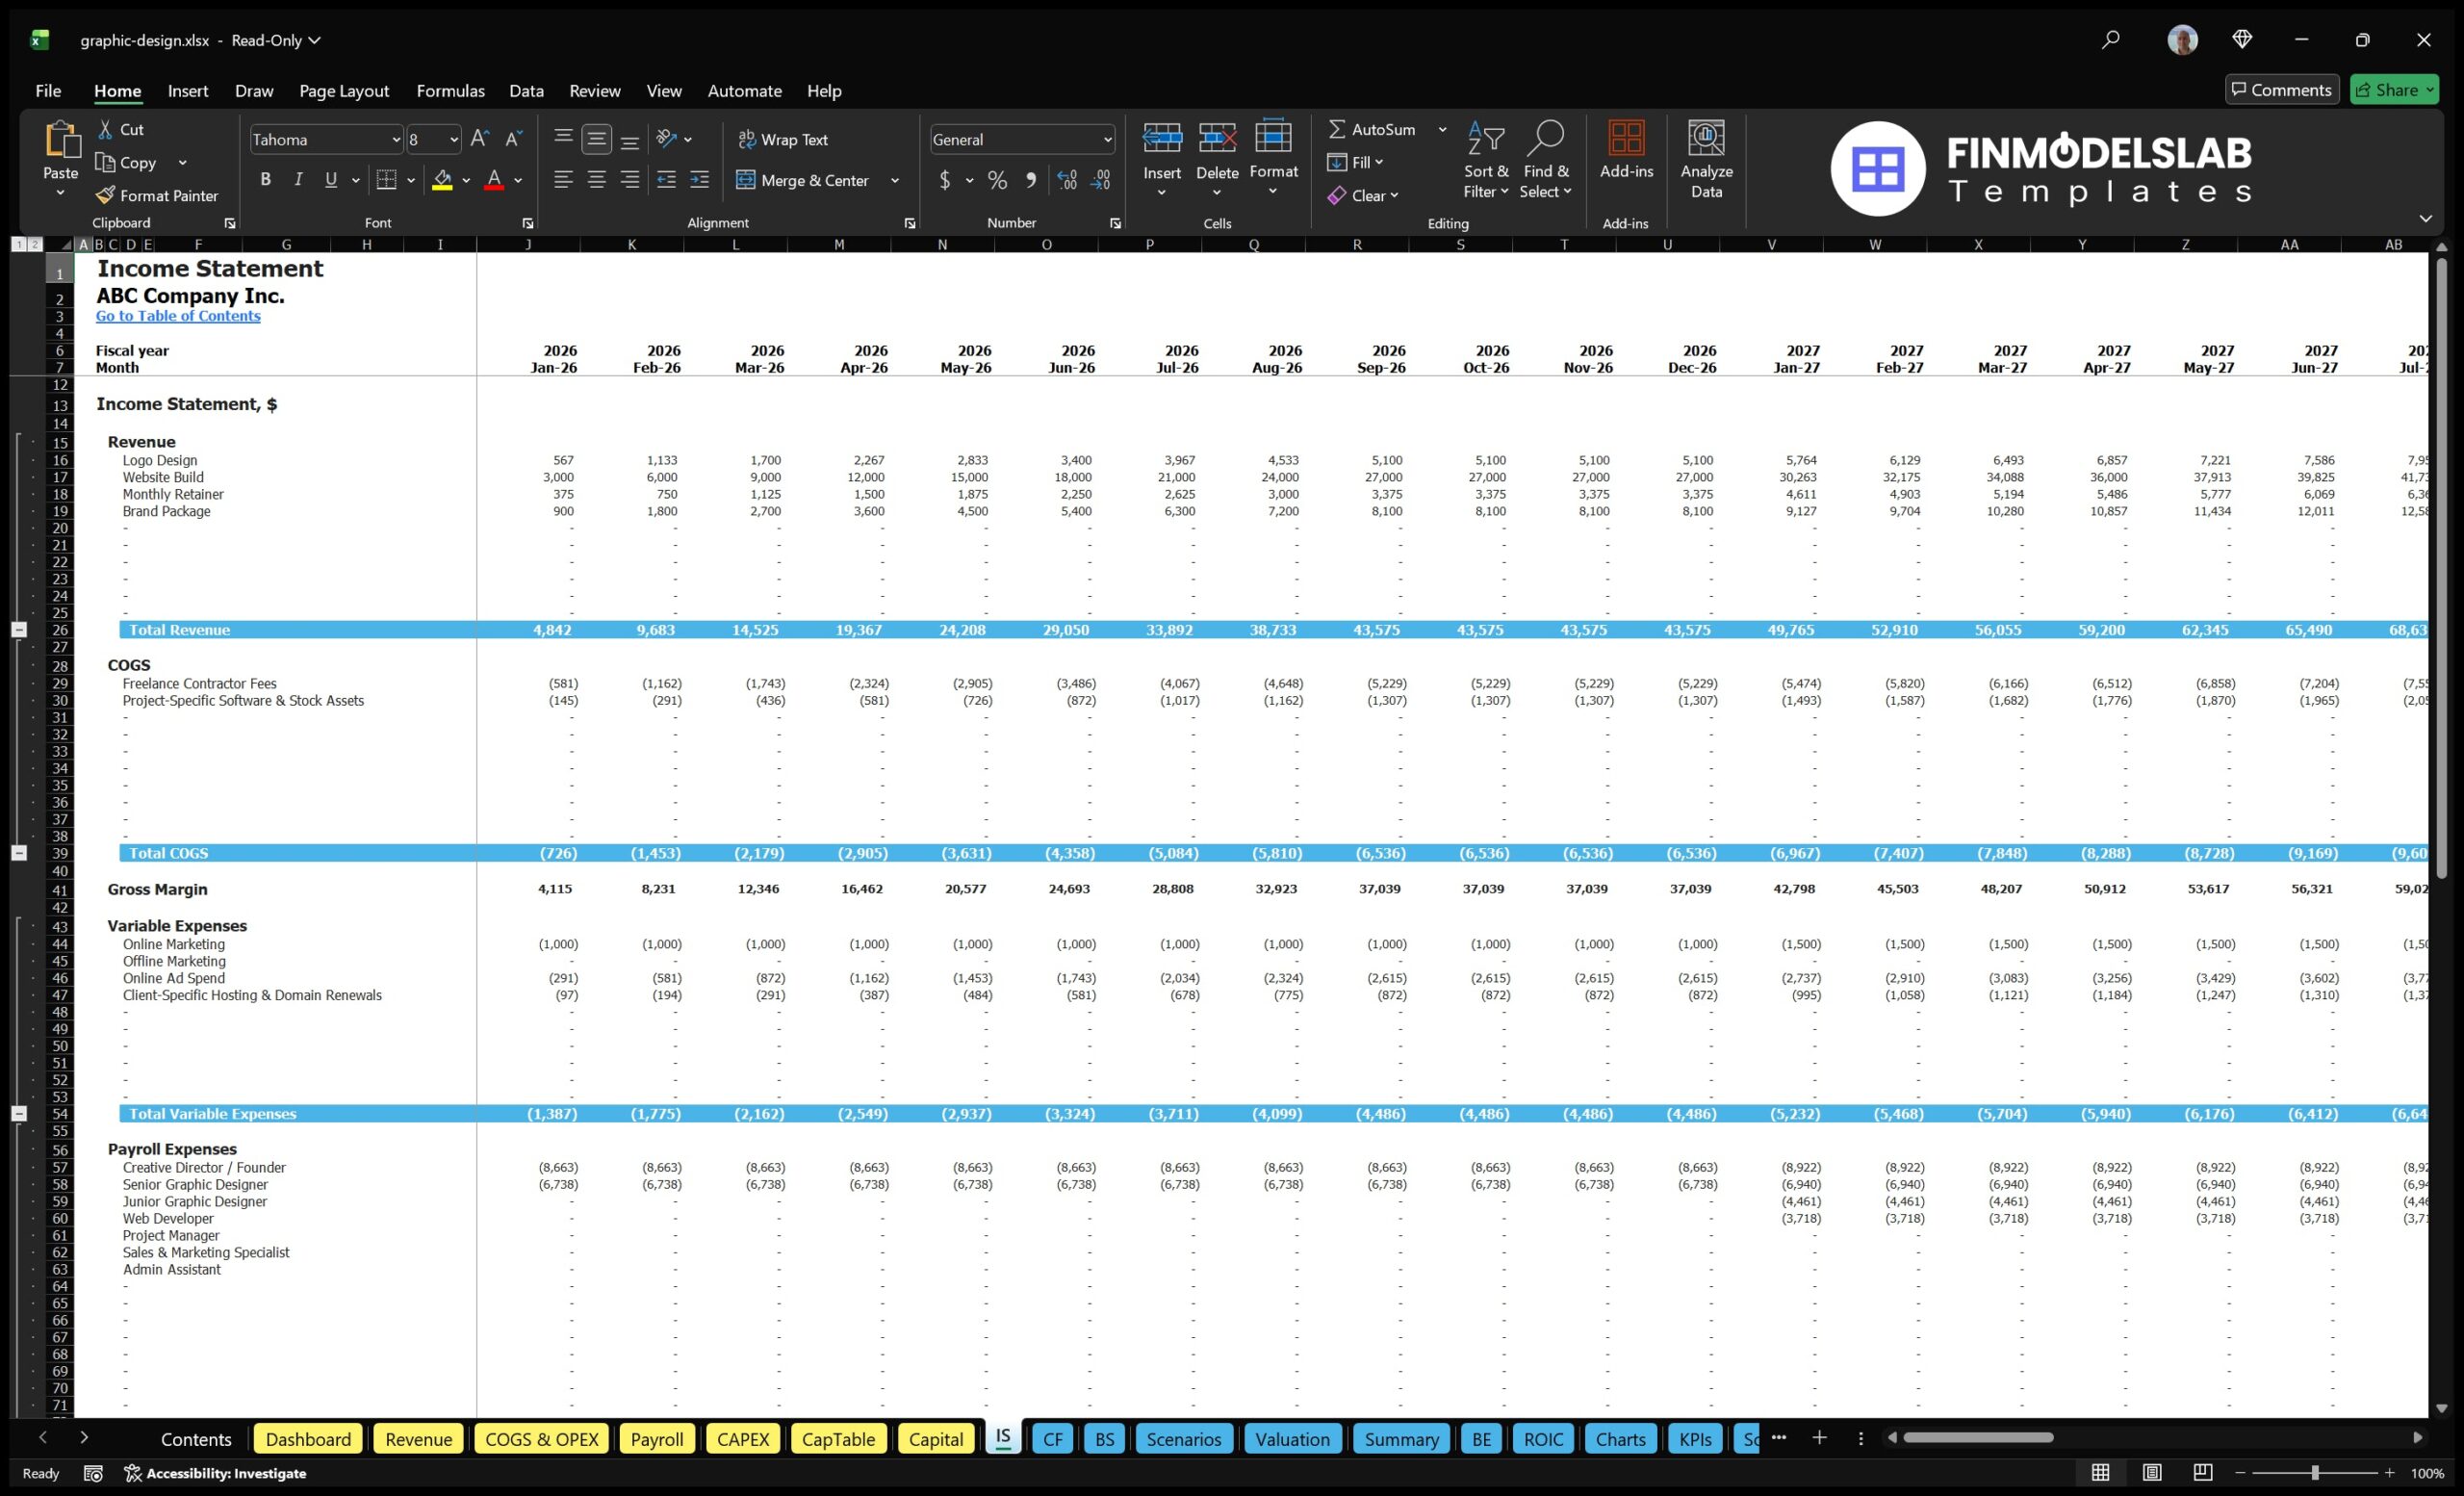
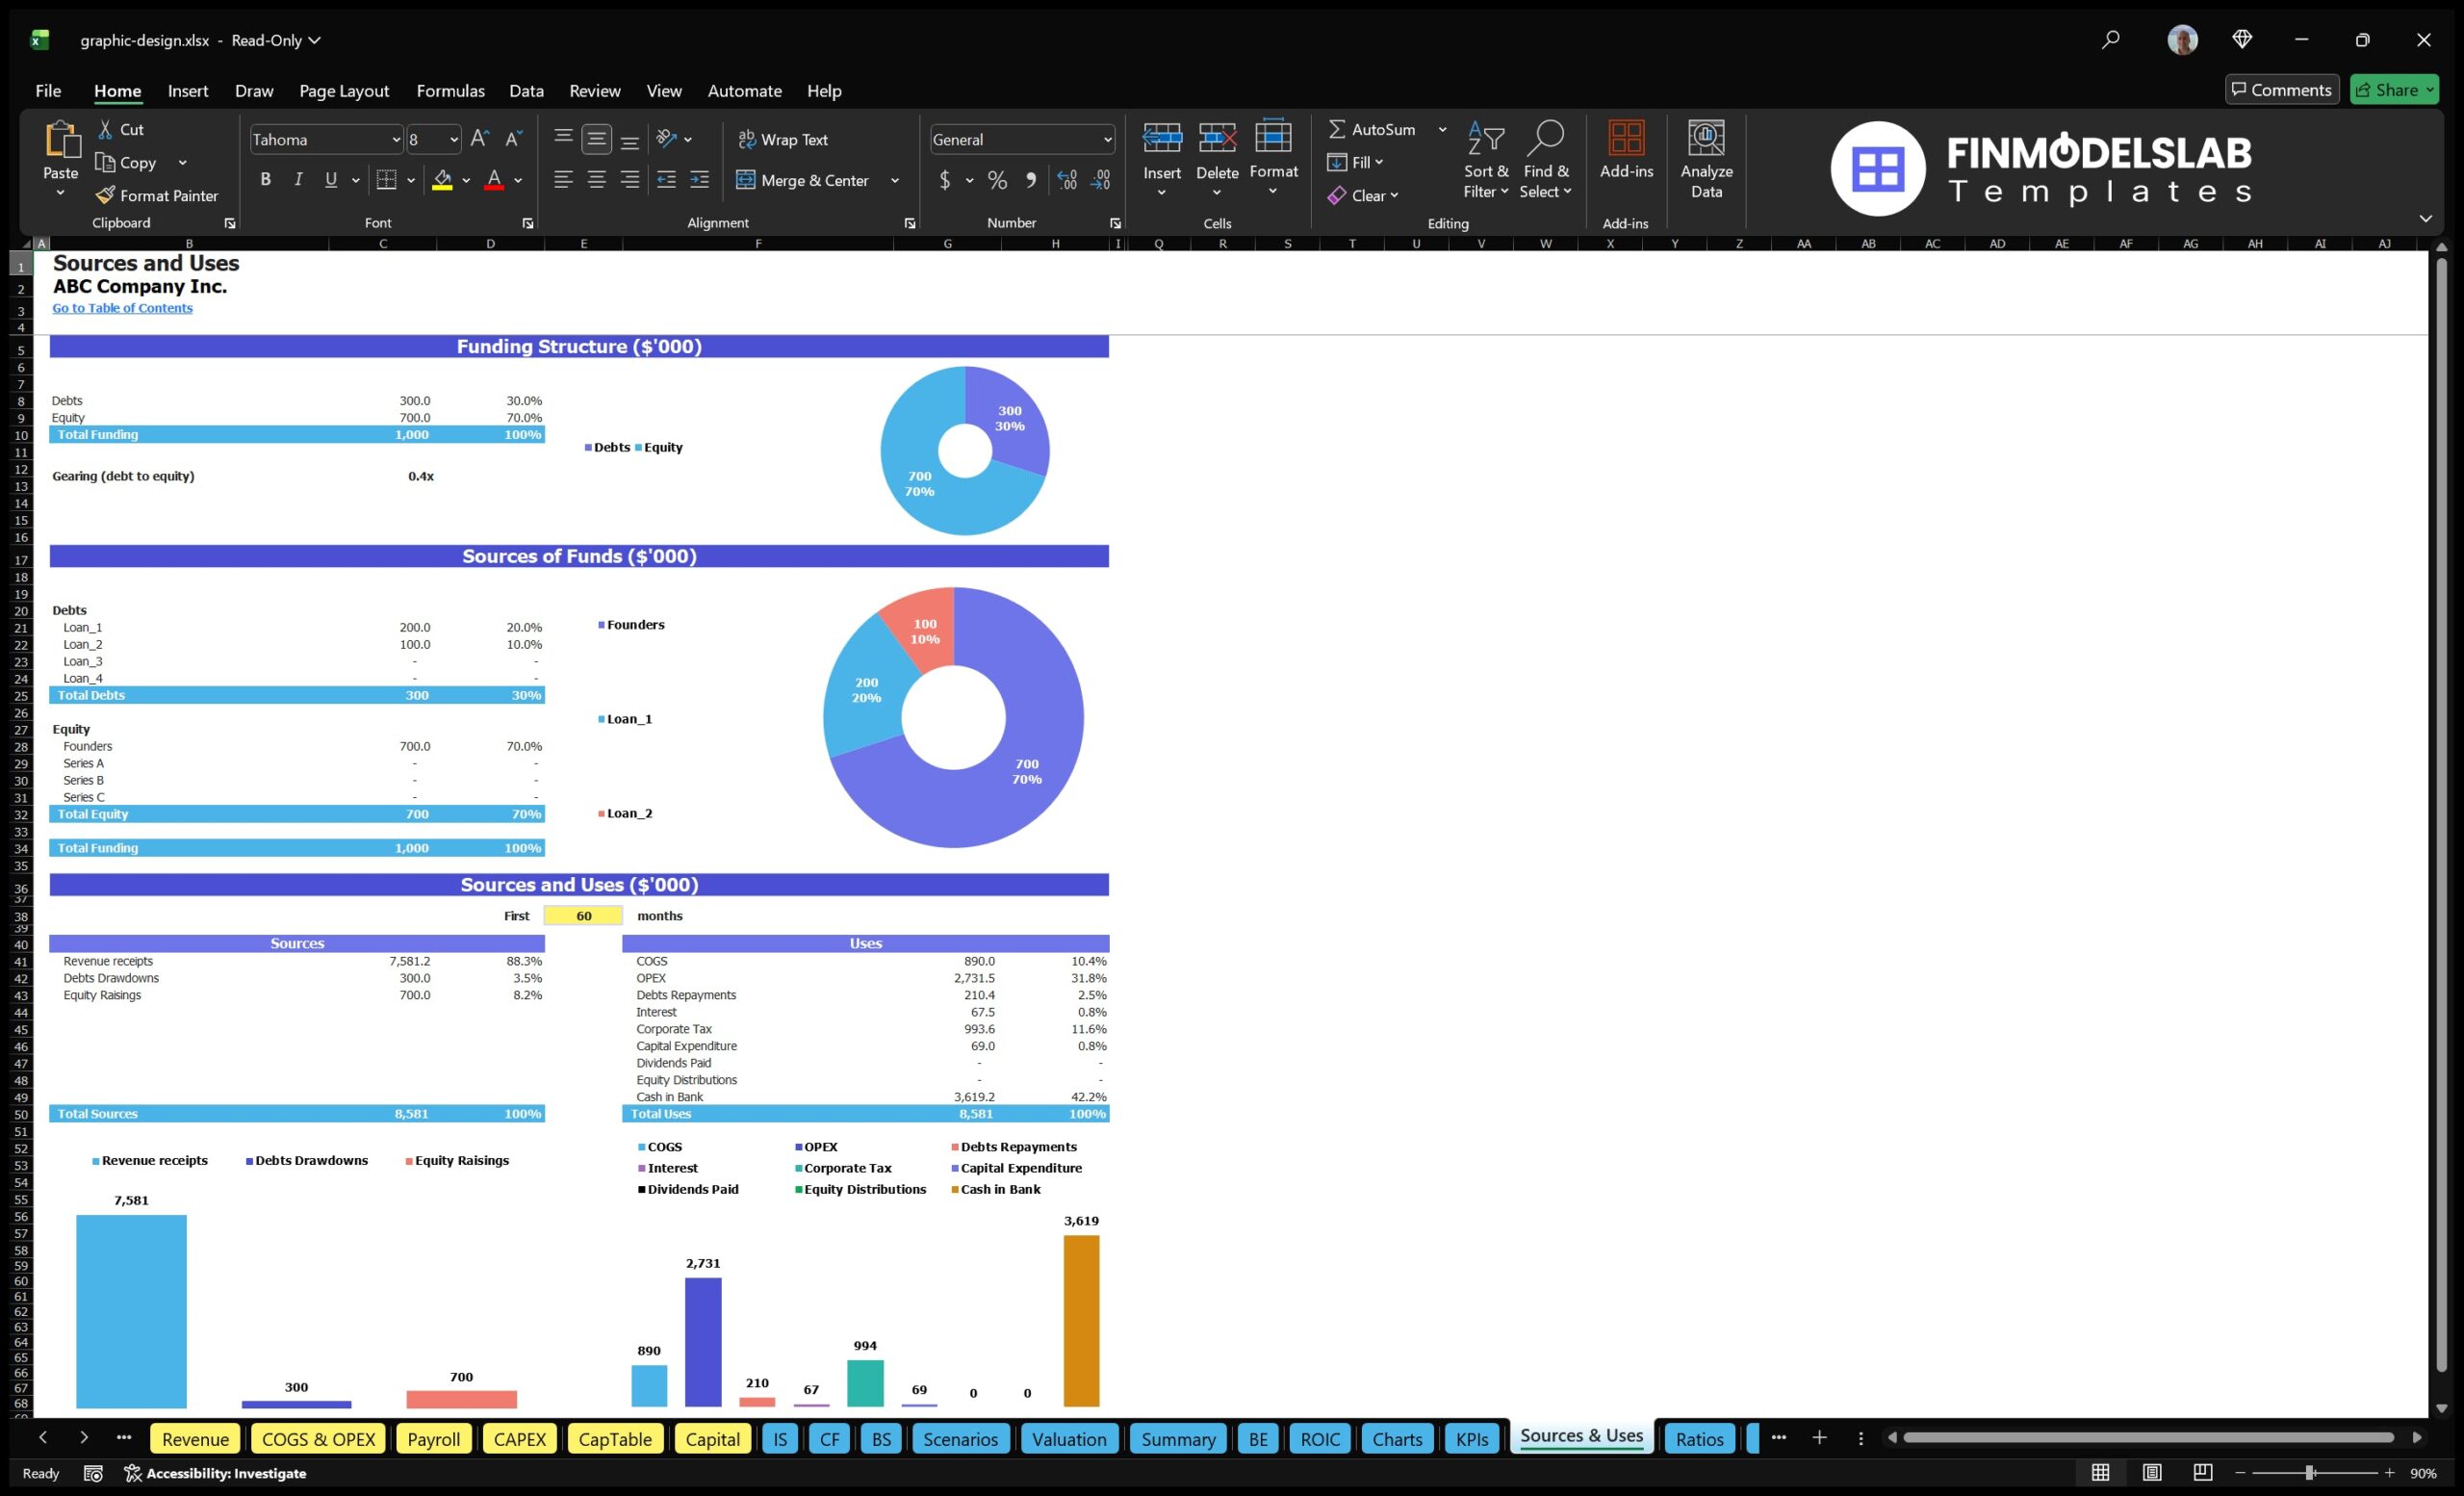
The bank-ready financial reports section provides structured financial outputs that can support loan applications, investor reviews, and stakeholder presentations. Lenders and funding partners typically want to see organized projections rather than informal estimates, including profit and loss statements, cash flow forecasts, balance sheet outputs, debt assumptions, repayment capacity, and summary financial metrics. This component helps users present the agency’s financial outlook in a format that is easier for external reviewers to understand. For a graphic design agency seeking startup capital, working capital, equipment financing, or expansion funding, these reports can show how the business expects to generate revenue, manage expenses, cover debt obligations, and maintain liquidity. Inputs from revenue, payroll, operating expenses, startup costs, and financing assumptions flow into the reports, creating a connected view of the business. This is valuable because it reduces the risk of inconsistent numbers across documents and gives users a polished foundation for funding conversations, lender meetings, grant applications, or investor due diligence.
Revenue Breakdown by Service Stream
The revenue breakdown by service stream component provides a detailed view of how each offering contributes to total agency income. A graphic design agency may earn revenue from logo design, website builds, brand identity projects, design retainers, marketing collateral, social media creative, packaging design, or other specialized services. This section helps users separate those streams so they can see which services generate the most revenue, which have the strongest margins, and which may require more team capacity or contractor support. Inputs can include service pricing, number of clients, project frequency, billable hours, retention assumptions, and the percentage mix of each service over time. Outputs can show monthly and annual revenue by stream, total revenue contribution, and changes in business mix as the agency grows. This is useful for strategic planning because it helps users decide where to focus sales efforts, which services to standardize, when to promote retainers, and how to allocate staff. It also supports clearer communication with stakeholders by showing that the forecast is built from specific revenue drivers rather than broad estimates.
KPI Dashboard and Performance Benchmarks
The KPI dashboard and performance benchmarks section helps users monitor the financial and operational indicators that matter most for a graphic design agency. Key performance indicators may include revenue growth, gross margin, EBITDA margin, net profit margin, cash balance, customer count, average revenue per client, billable utilization, contractor cost as a percentage of revenue, payroll ratio, and recurring revenue share. Benchmarks can help users compare projected performance against realistic expectations for a creative services business, making the forecast more grounded and useful. This component turns the model into more than a static forecast by giving users a way to assess whether the agency is moving toward its goals. Inputs from the broader financial model feed into the dashboard, while outputs highlight areas of strength and potential concern. For example, if revenue is growing but cash flow is tightening, the KPI view can help identify whether delayed collections, payroll timing, or rising contractor expenses may be the cause. This makes the model useful for ongoing management, investor updates, and operational decision-making.
Startup Cost and Capital Investment Planning
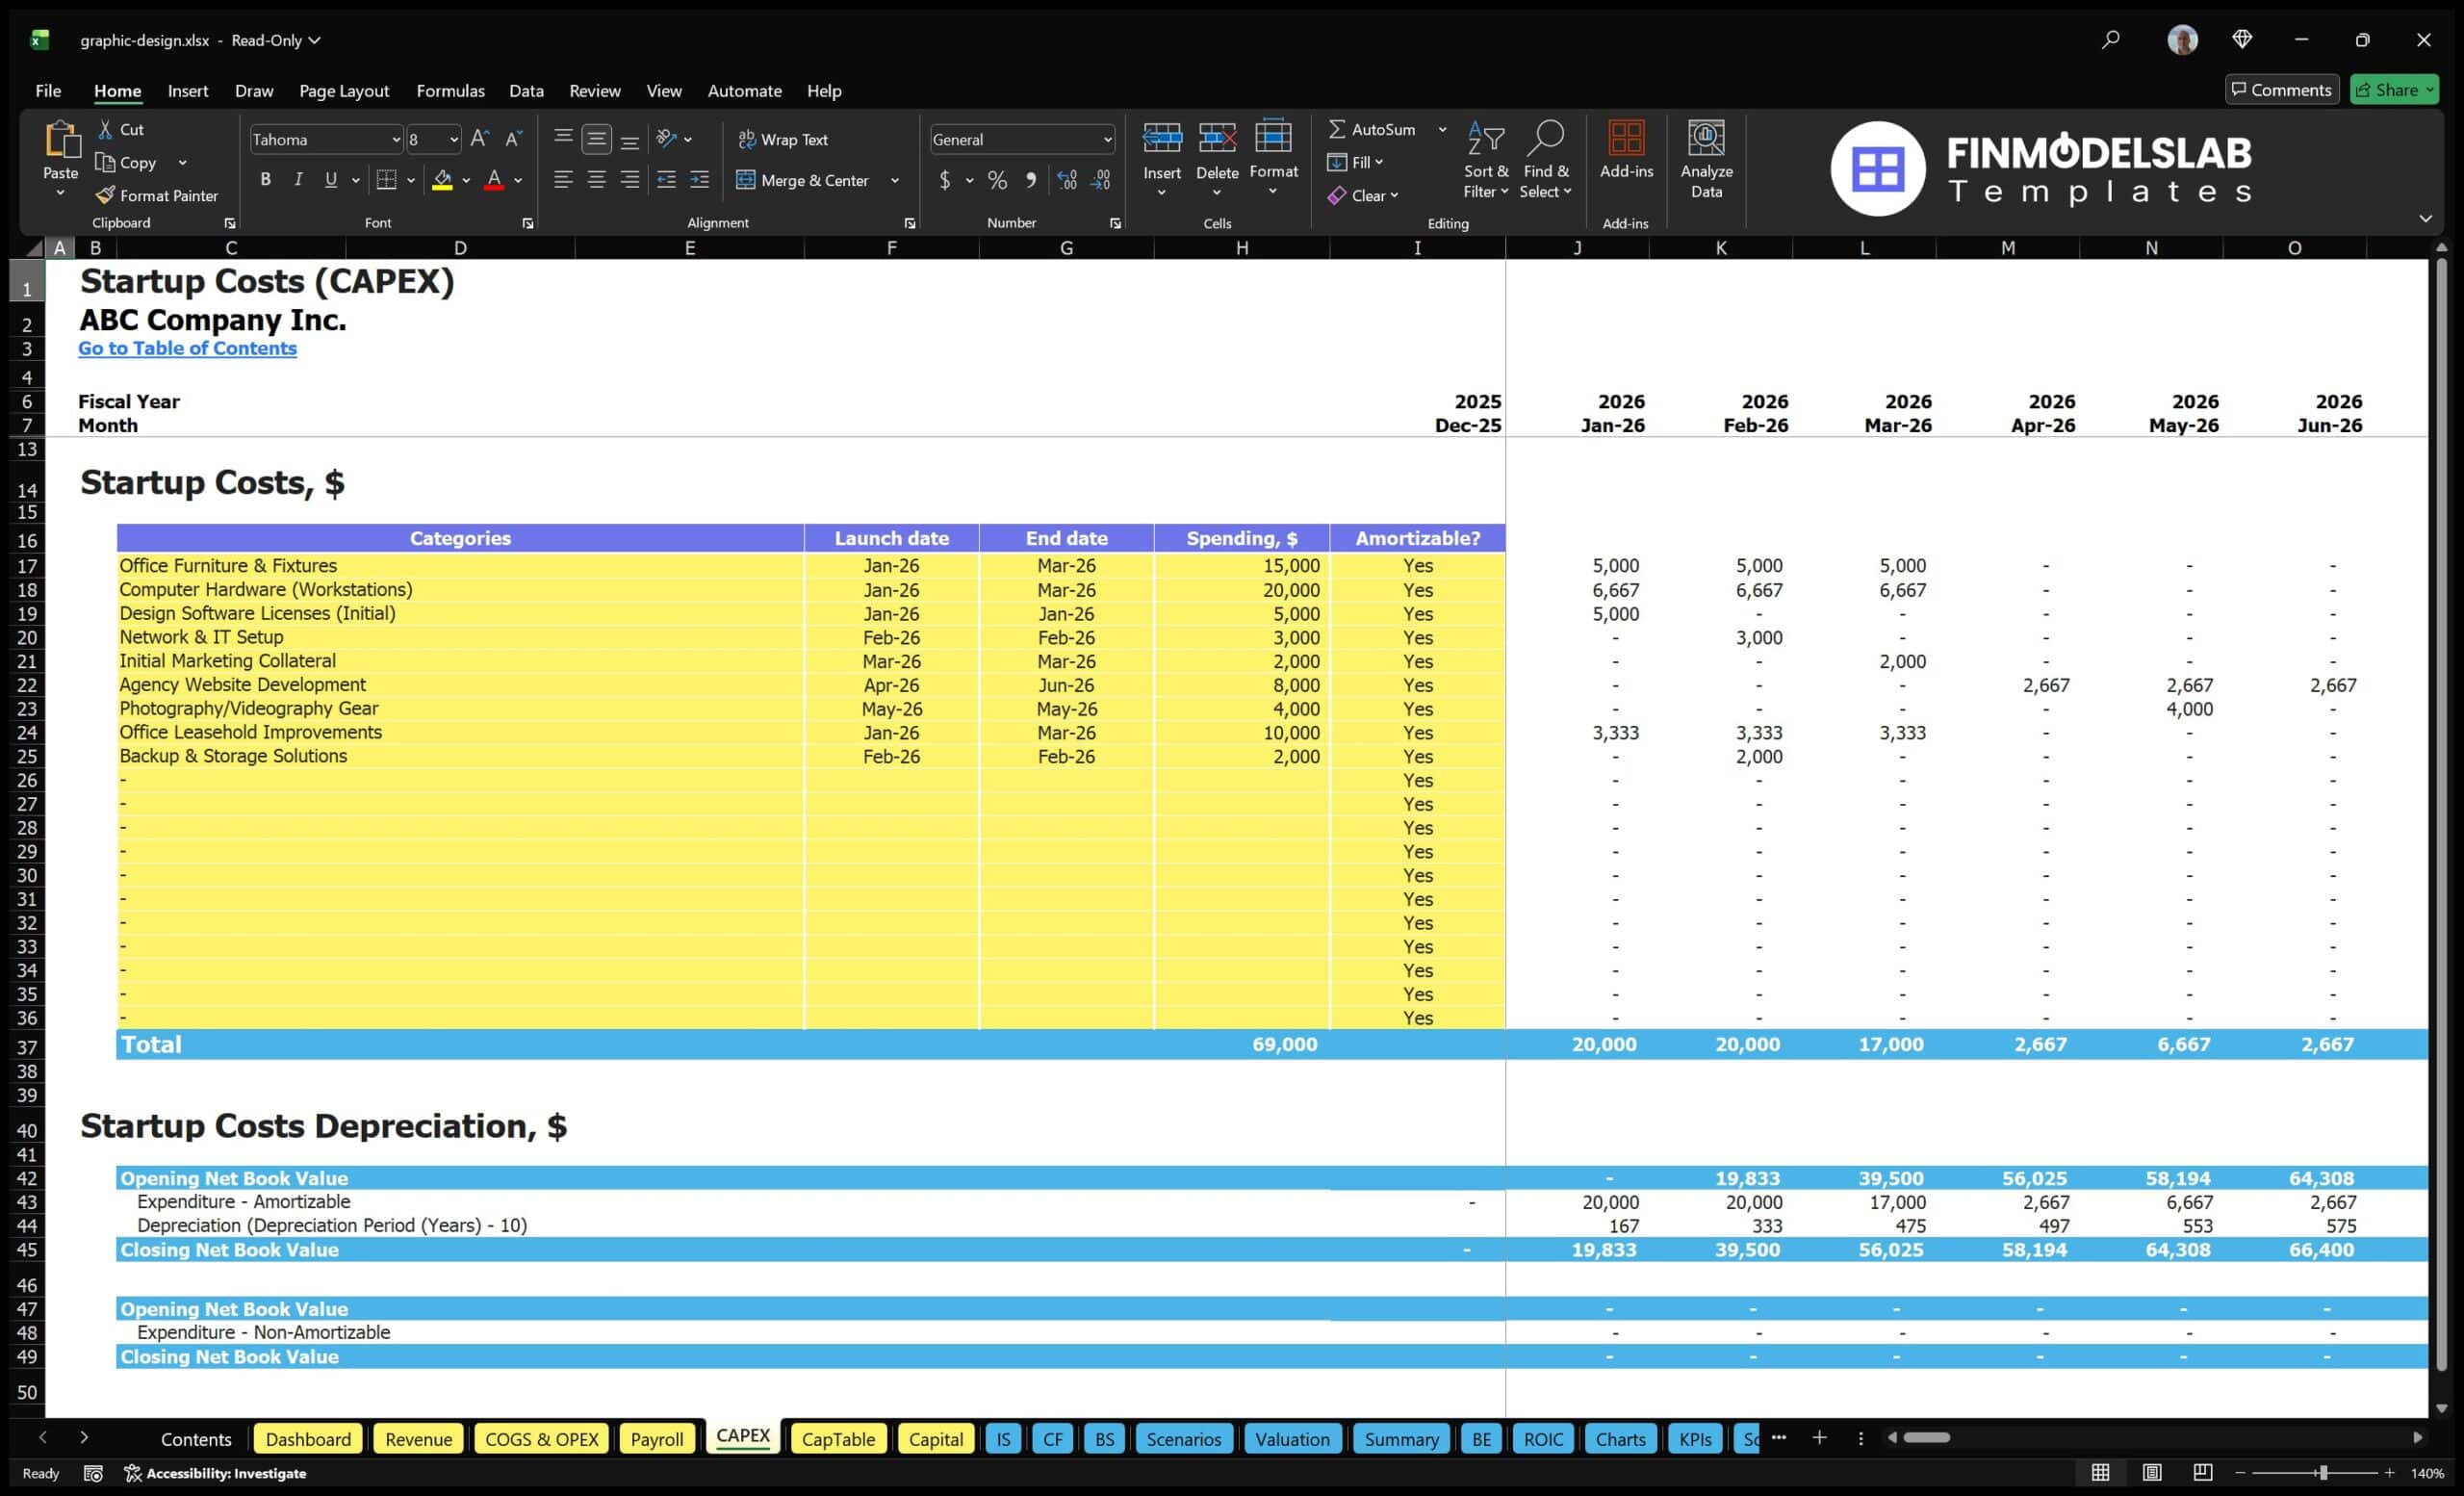
The startup cost and capital investment planning section helps users estimate how much money may be needed before the graphic design agency can operate effectively. Launching an agency can involve upfront spending on computers, design software, website development, brand materials, office setup, furniture, legal setup, insurance, initial marketing, deposits, training, and working capital reserves. This component organizes those costs so users can distinguish one-time startup investments from ongoing operating expenses. Inputs may include equipment quantities, software licenses, office improvements, professional fees, pre-launch marketing, hiring costs, and initial cash reserve targets. Outputs can show total startup funding required, the timing of cash needs, and how much capital should be available before launch. This is important because creative agency founders often underestimate the amount of cash required to support operations while client pipelines are still developing and invoices are still being collected. By creating a clear startup cost breakdown, the model supports better budgeting, funding preparation, lender discussions, and launch planning. It also helps users avoid preventable cash shortages during the early months of the business.
Break-Even Analysis and Profitability Timing
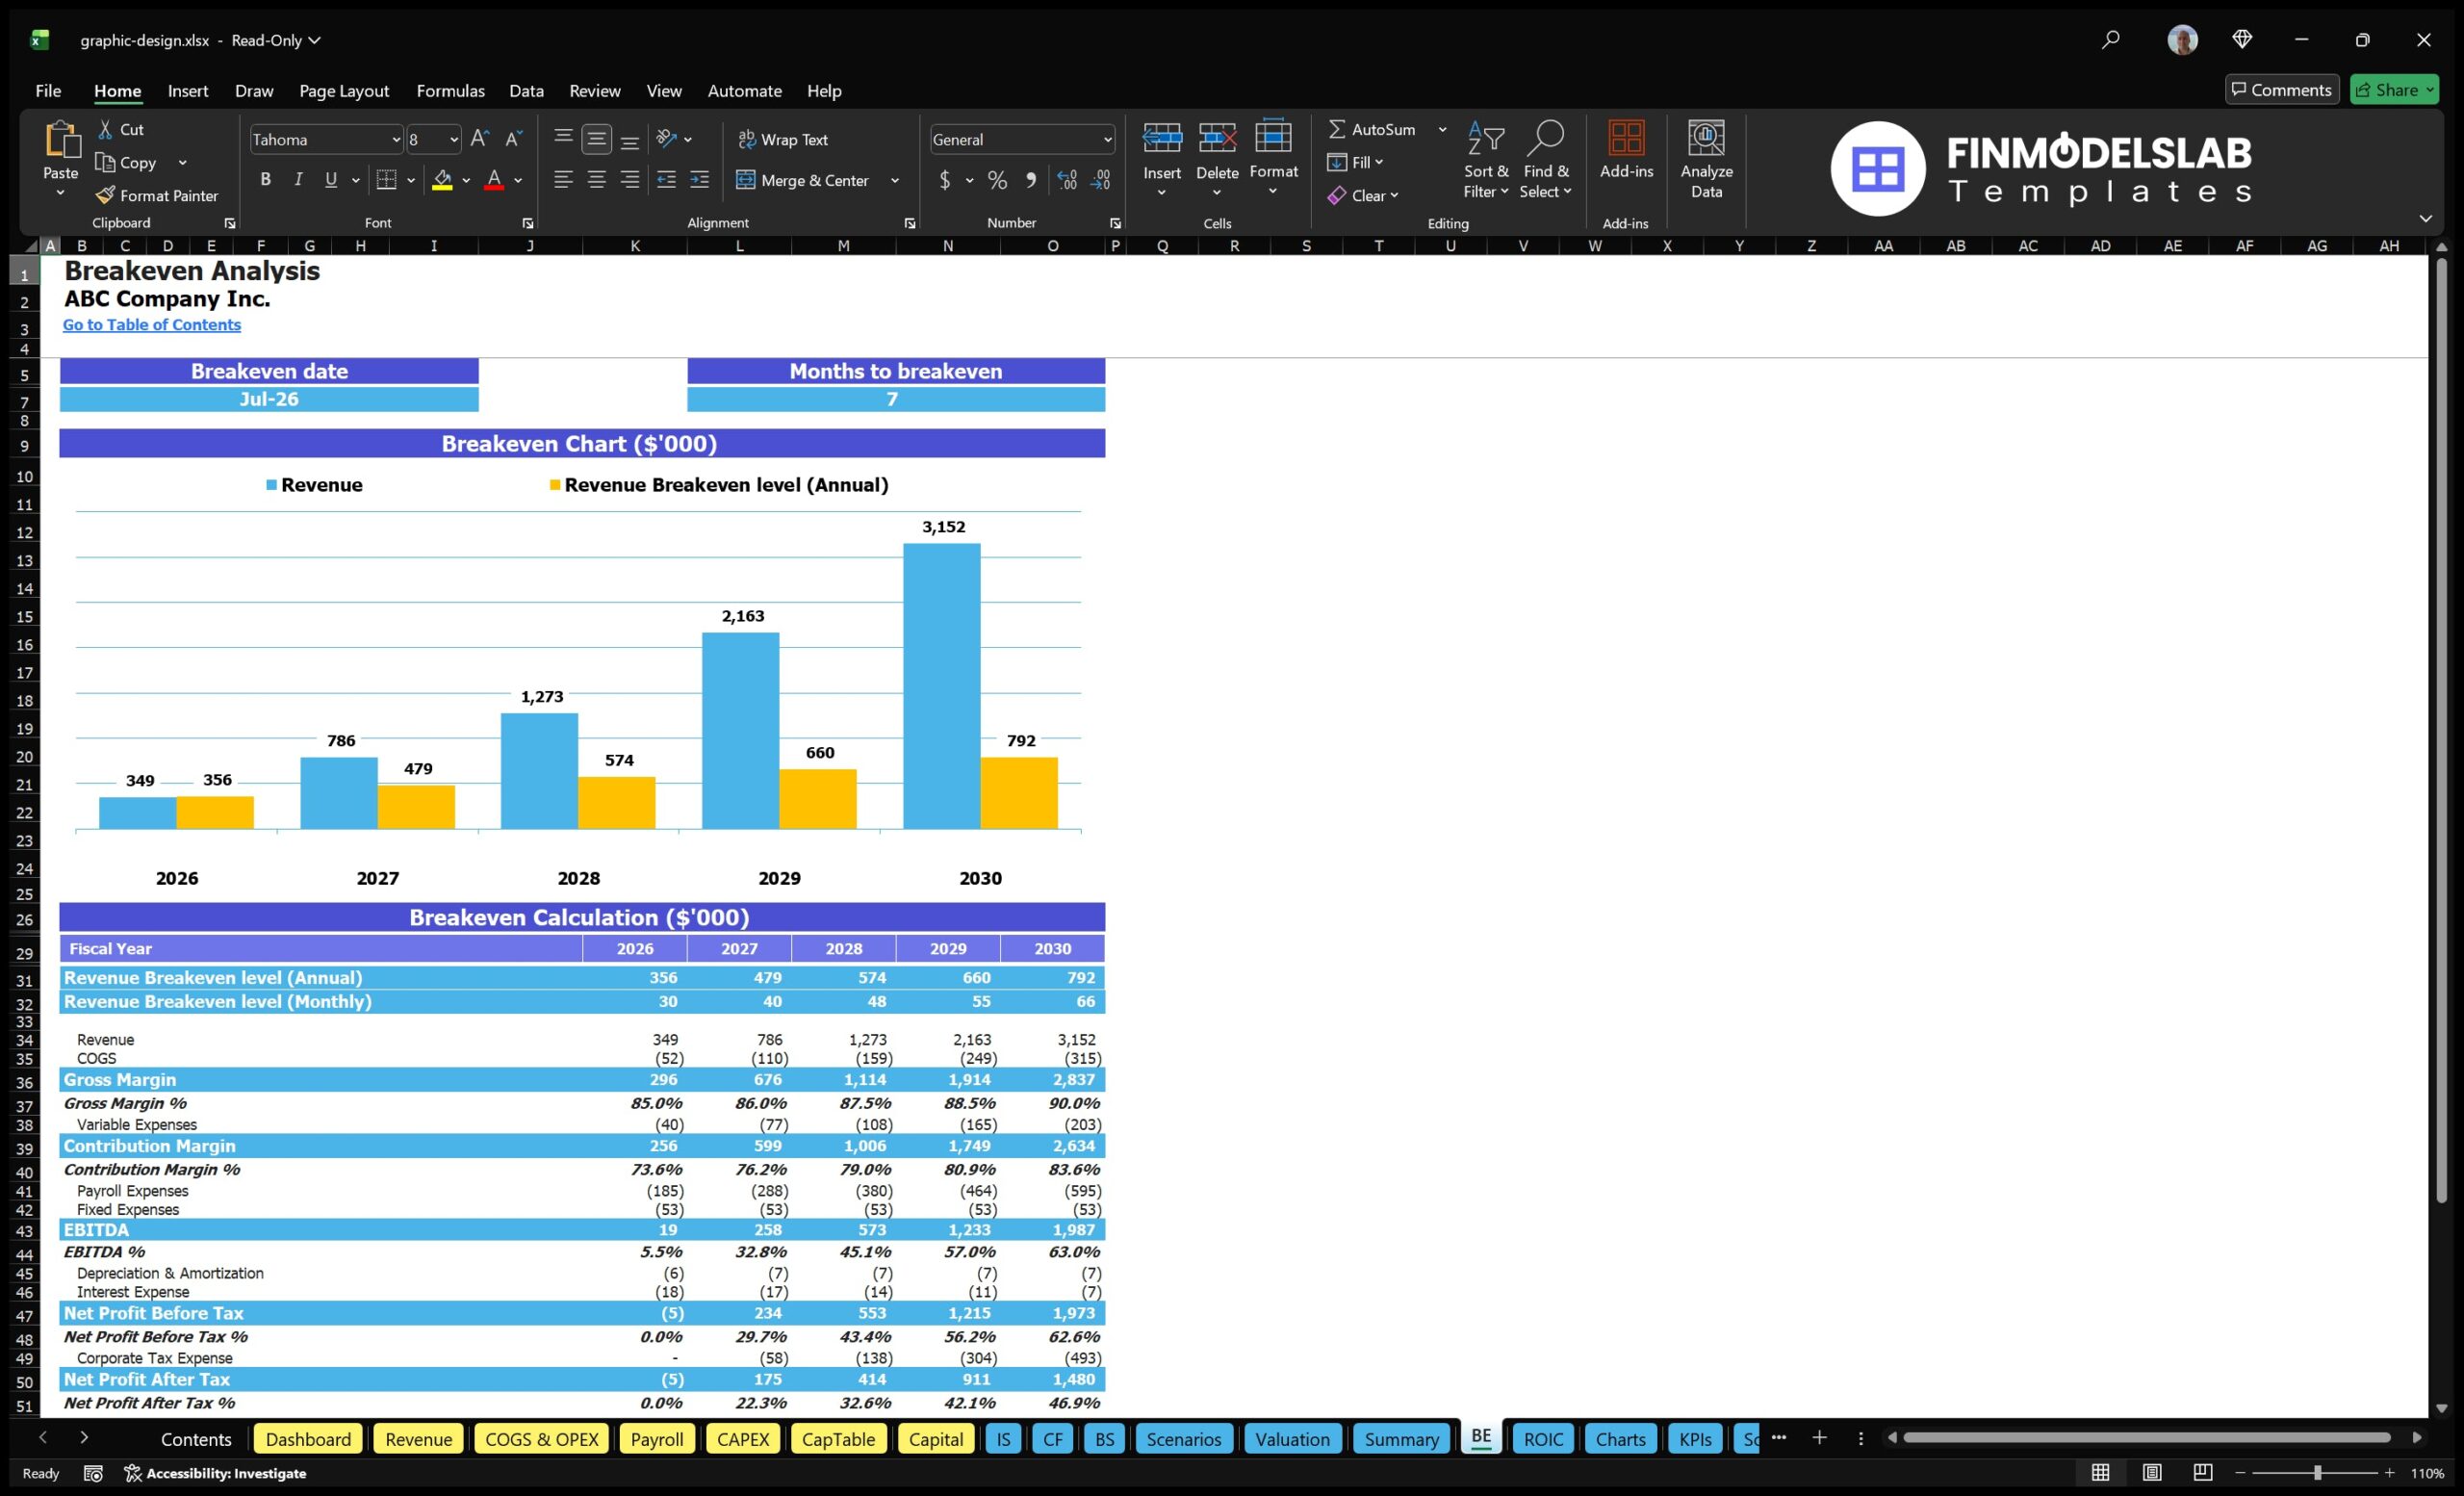
The break-even analysis and profitability timing section helps users identify when the agency may generate enough revenue to cover its costs and begin producing sustainable profit. For a graphic design agency, break-even depends on pricing, client volume, service mix, retainer adoption, payroll, freelancer costs, software subscriptions, rent, marketing spend, and other fixed and variable expenses. This component can calculate the revenue level, client count, or monthly sales volume needed to cover operating costs, then show when the forecast reaches that point. Inputs may include gross margin assumptions, fixed overhead, direct costs, payroll timing, contractor fees, and monthly revenue projections. Outputs can include break-even month, cumulative profit position, margin of safety, and the gap between current sales assumptions and required sales levels. This is valuable for founders and business owners because it provides a clear milestone for judging whether the plan is realistic. It also supports funding conversations by showing how long the agency may need financial support before becoming self-sustaining. By understanding the path to break-even, users can make better decisions about pricing, service prioritization, hiring, marketing spend, and cash reserves.
File types:
Excel – Single-User: .xlsx
Excel – Multi-User: .xlsx
Similar ProductsOther customers were also interested in...


 HenrySheykin
Call Center Financial Model Excel Template
The Call Center Financial Model helps users build a structured financial forecast for launching, man... Read more

Cyber Security Financial Model Excel Template
The Cybersecurity Financial Model helps founders, business owners, consultants, and analysts plan a ... Read more
Pre-Made Meal Subscription Box Financial Model Exc...
The Pre-Made Meal Subscription Financial Model Template helps entrepreneurs and planners turn a meal... Read more

Online Coaching Marketplace Financial Model Excel ...
The Online Coaching Platform Financial Model helps founders, entrepreneurs, consultants, analysts, a... Read more

Virtual Assistant Service Financial Model Excel Te...
The Virtual Assistant Service Financial Model Template helps entrepreneurs, founders, consultants, a... Read more
Equipment Rental Subscription Financial Model Exce...
The Equipment Rental Subscription Financial Model helps users turn an equipment-as-a-service busines... Read more
Fresh Flowers Subscription Financial Model Excel T...
The Subscription Box Financial Model Template helps entrepreneurs, founders, analysts, consultants, ... Read more
Human Resource Software Financial Model Excel Temp...
The HR Software Financial Model Financial Model Template helps founders, business owners, consultant... Read more
Customer Service Software Financial Model Excel Te...
The Customer Service Software Financial Model helps founders, operators, consultants, and analysts t... Read more

 Jason Varner
Product + Subscription Financial Model
Build a strategy for adding recurring revenues services to your product. Includes financial statemen... Read more
You must log in to submit a review.