
0 ITEMS

Virtual Assistant Service Financial Model Excel Template
The Virtual Assistant Service Financial Model Template helps entrepreneurs, founders, consultants, analysts, and business owners turn a virtual assistant service concept into a structured five-year financial forecast. Instead of starting with a blank spreadsheet, users can work from a ready-made model designed around the economics of a VA business, including recurring service packages, project-based add-ons, customer acquisition, staffing, operating expenses, startup costs, cash flow, profitability, and funding needs. It is built to support practical financial planning for a remote administrative support business, whether the goal is launching a new agency, expanding an existing service operation, or preparing a business plan for investors, banks, or internal stakeholders. This template is especially useful for users who need to understand how revenue assumptions translate into financial results. It allows the buyer to model active customers, monthly package pricing, service mix, client growth, retention, payroll, contractor costs, software expenses, marketing spend, and other operating expenses in one connected forecast. By linking assumptions to revenue, gross profit, EBITDA, cash flow, and investor metrics, the model helps users see whether the business can support its cost structure, when it may reach profitability, and how different decisions may affect financial performance over time. The model also helps users prepare for decision-making under uncertainty. With scenario analysis, visual dashboards, professional charts, KPI tracking, and presentation-ready reports, the template makes it easier to compare conservative, base, and growth cases. Users can evaluate how changes in customer acquisition cost, pricing, payroll, retention, and overhead influence cash balance, margins, break-even timing, and return potential. This makes the template valuable for founders validating a business idea, consultants building client deliverables, and finance professionals preparing investor-ready financial documents. Because the Virtual Assistant Service Financial Model is editable and compatible with Microsoft Excel and Google Sheets, users can tailor the assumptions to their own market, pricing strategy, team structure, service packages, and funding plan. It supports startup budgeting, operating expense planning, payroll forecasting, cash flow management, profitability analysis, break-even analysis, and long-term growth planning. The result is a practical, time-saving financial model that helps users organize their numbers, communicate their plan clearly, and make better business decisions before and after launch.
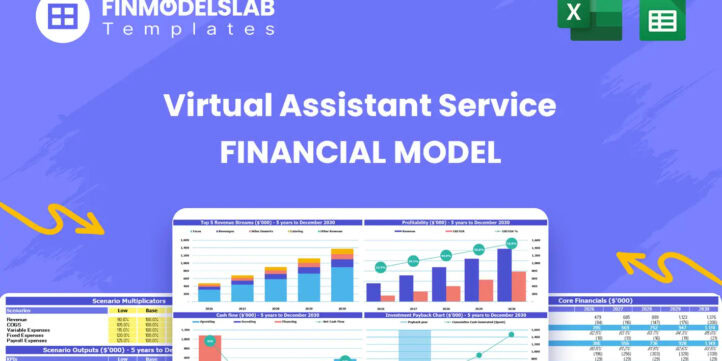


Financial Model Overview
The Virtual Assistant Service Financial Model Financial Model Template gives users a structured way to plan, test, and present the financial outlook of a virtual assistant service business. It is designed for entrepreneurs, founders, consultants, analysts, business owners, and planning teams who need to forecast revenue, startup costs, operating expenses, payroll, profitability, cash flow, and funding requirements without building a model from scratch. A virtual assistant service can include recurring administrative support packages, creative support, technical support, multi-service client accounts, and project-based add-ons, so the financial model needs to connect customer growth, pricing, service mix, staffing, and cost structure in a clear and editable format. This template brings those assumptions together in a practical planning tool that can be used for business plans, investor discussions, bank presentations, internal budgeting, and ongoing performance review. With five-year projections, scenario planning, dashboards, charts, KPI tracking, and professional financial outputs, the model helps users replace guesswork with a more organized decision-making process.
All-in-One Dashboard
The all-in-one dashboard gives users a central view of the most important inputs and outputs in the Virtual Assistant Service Financial Model. This component is designed to summarize the business at a glance, helping users quickly review key assumptions such as pricing, customer volume, growth rates, service mix, costs, and funding needs alongside major outputs such as revenue, EBITDA, net income, cash balance, margins, and break-even timing. For a virtual assistant service, the dashboard is useful because the business model depends on several connected drivers, including client acquisition, monthly subscriptions, project revenue, assistant compensation, software costs, and marketing spend. Instead of searching through multiple sheets to understand what is happening, users can use the dashboard to monitor the overall financial story in one place. It is especially valuable for presentations because it allows founders, consultants, and analysts to explain the model in a clear, concise way to investors, lenders, partners, or internal decision-makers. The dashboard also helps users check whether the business remains financially viable when assumptions are updated, making it a practical tool for ongoing planning as the VA service grows.
Low, Base, and High Scenario Analysis
The low, base, and high scenario analysis component helps users test how the virtual assistant service may perform under different business conditions. A base case may reflect the expected plan, while a low case can show the impact of slower client acquisition, higher customer acquisition cost, weaker retention, lower pricing power, or increased operating costs. A high case can show the upside potential if marketing performs better, clients adopt higher-value packages, churn is lower, or the business scales more efficiently. This section is important because virtual assistant businesses are affected by market demand, competition, hiring capacity, service quality, and customer retention, all of which can change over time. By adjusting major assumptions across scenarios, users can see how revenue, profit margins, cash flow, working capital, and funding needs respond to different outcomes. This gives founders and planners a more resilient view of the business rather than relying on one forecast. It also supports investor and lender discussions because stakeholders often want to know what happens if the plan underperforms and whether the company can still manage expenses, payroll, and cash obligations. Scenario analysis helps users make better decisions before committing to hiring, marketing, platform investment, or expansion.
Professional Charts and Visual Reports
The professional charts and visual reports component turns the financial forecast into clear visual outputs that are easier to interpret and present. Charts may show revenue growth, gross profit, EBITDA, net income, cash balance, expense trends, customer growth, margin development, and other key financial movements over the forecast period. For a virtual assistant service, visual reporting is useful because performance depends on both scale and efficiency, and charts make it easier to see whether customer growth is translating into profitable operations. A founder can use the charts to explain how recurring package revenue builds over time, how project-based revenue contributes to total sales, and how operating leverage improves as the business gains more clients. Consultants and analysts can also use the visual reports to communicate complex assumptions in a simpler format for business plans, pitch decks, loan packages, or board updates. Instead of presenting only rows of numbers, users can show trends and relationships that support decision-making. This component helps make the financial model more presentation-ready and improves the user’s ability to communicate the business case to stakeholders who may not want to review every detailed calculation.
ROE Components and DuPont Analysis
The ROE components and DuPont analysis component helps users understand the drivers behind return on equity and overall financial performance. Rather than looking at return on equity as a single number, DuPont analysis breaks performance into underlying elements such as profitability, asset efficiency, and leverage. For a virtual assistant service, this can be useful because the business may be relatively asset-light compared with a physical retail or manufacturing company, but it still depends heavily on effective use of capital, operating margin improvement, staffing efficiency, and revenue growth. This section can help users evaluate whether returns are being driven by healthy profitability, strong revenue productivity, efficient cost management, or financial structure. Investors and financial stakeholders often want to understand not only whether a company generates returns, but why those returns are occurring and whether they are sustainable. By including ROE components, the model gives users a more analytical view of performance and can support deeper conversations about growth strategy, capital allocation, pricing, and cost control. It is also helpful for comparing forecasted returns against expectations and for identifying which operational levers have the greatest impact on shareholder value.
Revenue Inputs
The revenue inputs component is where users define the commercial assumptions that drive the Virtual Assistant Service Financial Model. This section may include the number of active customers, customer acquisition assumptions, monthly subscription pricing, service package mix, project-based add-ons, upsell rates, retention levels, churn, and growth rates. For a virtual assistant service, revenue is typically shaped by package tiers such as basic administrative support, creative support, technical support, and multi-service offerings, along with special projects or add-on work. By entering assumptions for each revenue driver, users can create a forecast that reflects their own business model rather than relying on generic numbers. This component is valuable because revenue assumptions are the foundation of the entire financial plan. Marketing spend and customer acquisition cost can be linked to new customer growth, pricing can be adjusted to reflect the target market, and service mix can be changed to test how higher-value packages affect margins. The revenue inputs section helps users validate whether their sales targets are realistic, whether customer acquisition is affordable, and whether pricing is strong enough to support payroll, software, overhead, and profit goals.
Bank-Ready Reports
The bank-ready reports component provides structured financial outputs that can support lender, investor, or stakeholder review. These reports may include profit and loss statements, cash flow projections, balance sheet summaries, revenue schedules, expense summaries, and key financial metrics in a clean and professional format. For a virtual assistant service seeking funding, a lender or investor will want to understand how the business generates revenue, what costs are required to operate, whether cash flow can support obligations, and when the company is expected to become profitable. This section helps organize that information into outputs that are easier to review and discuss. Bank-ready reporting is especially useful when preparing a business plan, loan application, funding proposal, or strategic expansion case because it connects the assumptions of the model to formal financial statements. Users can adjust inputs such as pricing, headcount, contractor compensation, marketing budget, startup investments, and operating expenses, then review how those assumptions flow through the reports. The result is a more credible and professional financial package that helps users communicate financial feasibility with clarity.
Revenue Breakdown
The revenue breakdown component gives users a more detailed view of how total sales are generated across different revenue streams. Instead of showing only one total revenue line, this section can separate income from basic admin packages, creative service packages, technical support packages, multi-service accounts, and project-based add-ons. This is important for a virtual assistant service because not all revenue streams carry the same pricing, delivery effort, staffing requirements, or margin potential. A business may generate a large number of clients on lower-priced administrative packages while earning higher margins from technical support or specialized add-ons. By breaking revenue into separate streams, users can evaluate which services are driving growth and which offerings may need pricing, staffing, or marketing adjustments. This component also helps with strategic planning because users can test how changing the sales mix affects profitability, cash flow, and capacity needs. For example, a shift toward higher-value packages may improve margins but require more skilled assistants, while project-based work may increase revenue variability. A detailed revenue breakdown helps users make better decisions about positioning, service design, pricing strategy, and customer acquisition priorities.
KPI Dashboard
The KPI dashboard component helps users monitor performance metrics that are especially relevant to a virtual assistant service. Key performance indicators may include active customers, new customers, average revenue per customer, customer acquisition cost, retention rate, churn rate, gross margin, EBITDA margin, payroll as a percentage of revenue, cash balance, runway, and return metrics. This section is useful because a VA business depends on repeat customers, service quality, staffing efficiency, and sustainable acquisition economics. Tracking KPIs helps users move beyond basic revenue and expense forecasting to understand the operational drivers of financial performance. For example, if customer acquisition cost rises faster than pricing or retention falls below plan, the business may need more cash or may reach profitability later than expected. If average revenue per customer increases through upsells and package upgrades, the model may show stronger margins and faster payback. The KPI dashboard supports both planning and management by giving founders and stakeholders a concise set of metrics to review regularly. It can also strengthen presentations because investors and lenders often look for measurable indicators that show whether the business model is scalable, efficient, and financially disciplined.
Startup Costs and Funding Requirements
The startup costs and funding requirements component helps users estimate the capital needed to launch or expand a virtual assistant service. This section may include one-time setup costs such as software platform development, website design, branding, legal setup, business registration, initial marketing, equipment, training materials, content creation, recruiting costs, and working capital reserves. It may also help users separate upfront capital expenditures from recurring operating expenses, which is important for understanding how much money is needed before the business becomes self-sustaining. For a virtual assistant service, startup costs may be lower than a physical business, but the company may still need meaningful investment in technology, marketing, systems, contractor onboarding, and cash reserves during the early months. This component helps users avoid underestimating launch requirements and supports more accurate funding discussions with investors, lenders, or partners. By connecting startup spending to the broader forecast, users can see how initial funding affects cash balance, runway, and payback period. This makes the template useful not only for estimating a launch budget, but also for deciding whether to raise capital, use owner funding, secure a loan, or phase growth more gradually.
Break-Even and Cash Flow Forecast
The break-even and cash flow forecast component helps users understand when the virtual assistant service can cover its costs and whether it has enough liquidity to operate safely along the way. Break-even analysis identifies the point at which total revenue equals total costs, giving users a clear milestone for financial sustainability. The cash flow forecast shows how money moves through the business over time, taking into account revenue, payroll, contractor costs, marketing spend, software subscriptions, overhead, taxes, startup costs, capital investment, and other cash movements. This is critical for a service business because profitability on paper does not always mean the company has enough cash available each month. A virtual assistant service may need to fund marketing, hire or contract assistants, pay software costs, and support operations before revenue fully scales. This component helps users anticipate cash shortfalls, plan funding needs, evaluate runway, and make informed decisions about spending, hiring, pricing, and growth pace. It also supports investor and lender confidence by showing that the user has considered not only long-term profitability, but also the monthly cash dynamics required to keep the business stable during launch and expansion.
File types:
Excel – Single-User: .xlsx
Excel – Multi-User: .xlsx
Similar ProductsOther customers were also interested in...


 HenrySheykin
Call Center Financial Model Excel Template
The Call Center Financial Model helps users build a structured financial forecast for launching, man... Read more
Online Coaching Marketplace Financial Model Excel ...
The Online Coaching Platform Financial Model helps founders, entrepreneurs, consultants, analysts, a... Read more
Human Resource Software Financial Model Excel Temp...
The HR Software Financial Model Financial Model Template helps founders, business owners, consultant... Read more

 Giorgos
Web Design Firm – 5 Year Financial Model
5-year financial model for a web design firm providing revenue forecasts, cost analysis, and insight... Read more

 City Finance
5 Year 3 Statement Virtualization Software Company...
A comprehensive editable, MS Excel spreadsheet for tracking Virtualization Software Company finances... Read more

3 Statement Software Development Company Finance M...
A comprehensive editable, 5-year 3 statement MS Excel spreadsheet for tracking Software Developers' ... Read more
You must log in to submit a review.