
0 ITEMS

E-Commerce Software Financial Model Excel Template
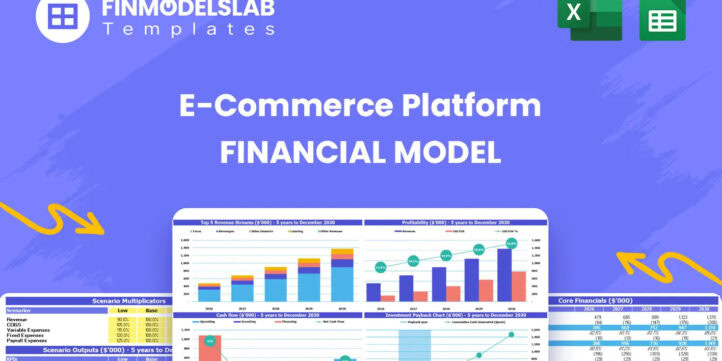
The E-Commerce Platform Financial Model Financial Model Template helps founders, entrepreneurs, consultants, analysts, and business owners turn an online marketplace or e-commerce platform idea into a structured five-year financial forecast. Instead of building projections from a blank spreadsheet, users can start with a ready-to-use model designed around the economics of a digital commerce business, including GMV, transaction commissions, subscription revenue, seller services, buyer activity, customer acquisition, operating expenses, payroll, cash flow, and profitability. It provides a practical framework for estimating how the platform may perform before launch, during growth, or while preparing for funding. This template is built for financial planning, business plan preparation, investor conversations, lender reviews, internal budgeting, and decision-making. Users can adjust revenue assumptions, pricing structures, order volume, acquisition costs, startup costs, operating expenses, staffing plans, and capital requirements to reflect their own business strategy. The model connects these assumptions to projected financial statements, helping users understand how changes in traffic, sellers, buyers, take rates, subscriptions, average order value, and costs affect the overall financial outlook of the e-commerce platform. For early-stage founders, the template helps clarify how much capital may be needed to build and launch the platform, how long it may take to reach break-even analysis targets, and whether projected revenue can support planned payroll and overhead. For established businesses or consultants, it provides a flexible structure for evaluating expansion plans, new marketplace categories, revised pricing models, or updated growth scenarios. The financial model is designed to support realistic planning by organizing the core drivers of an online retail or marketplace business in one connected forecast. The E-Commerce Platform Financial Model Financial Model Template is fully editable and can be used in Microsoft Excel or Google Sheets. It is useful for reviewing cash flow timing, profitability potential, funding needs, payback period, IRR, and business sustainability. With pre-built formulas, professional formatting, dashboards, charts, and scenario analysis, it helps users save time, reduce spreadsheet complexity, and make more informed decisions about launching, funding, managing, or scaling an e-commerce platform.


Financial Model Overview
The E-Commerce Platform Financial Model Financial Model Template is a ready-to-use planning tool designed to help founders, business owners, consultants, analysts, and finance teams forecast the performance of an online marketplace or e-commerce platform. It brings together the major financial drivers of a digital commerce business, including Gross Merchandise Value, transaction commissions, subscription fees, seller services, buyer behavior, acquisition costs, startup investment, operating expenses, payroll, cash flow, and profitability. The model is useful because e-commerce platforms depend on several connected assumptions rather than a single sales line. Seller growth affects product availability, buyer growth affects order volume, order value affects GMV, commissions affect revenue, and infrastructure costs affect margins. By organizing these drivers in a structured five-year forecast, the template helps users test whether their strategy can support sustainable growth, investor-ready reporting, and practical decision-making. It is fully editable, compatible with Excel and Google Sheets, and built to save time for anyone preparing a business plan, funding document, internal budget, or expansion analysis.
All-in-One Dashboard
The all-in-one dashboard gives users a central place to review the most important inputs and outputs of the e-commerce platform forecast without moving through every worksheet manually. It is designed to summarize the business model at a glance by connecting core assumptions such as platform launch timing, commission rates, subscription pricing, buyer and seller acquisition, average order value, order frequency, cost structure, payroll, startup investment, and financing assumptions to key financial results. The dashboard helps users see how the business is expected to perform across revenue, expenses, EBITDA, cash flow, break-even timing, payback period, and return metrics. For planning purposes, this is useful because an e-commerce platform can have strong top-line GMV while still facing cash pressure from marketing, development, support, and payroll. A consolidated dashboard makes it easier to spot whether the forecast is balanced, whether capital needs are realistic, and whether the model tells a clear financial story. It is also helpful for investor or stakeholder presentations because decision-makers can quickly understand the forecast direction, key assumptions, and projected outcomes before reviewing the detailed financial statements.
Low, Base, and High Scenario Analysis
The low, base, and high scenario analysis component helps users evaluate how the e-commerce platform could perform under different market, execution, and growth conditions. A base case can represent the expected plan, while a low case may reflect slower seller onboarding, weaker buyer acquisition, lower order frequency, lower average order value, higher customer acquisition costs, or delayed monetization. A high case can show the upside if marketing efficiency improves, seller adoption accelerates, repeat purchasing increases, subscription penetration rises, or value-add seller services gain traction. The model may use different assumptions for revenue drivers, cost behavior, staffing pace, capital spending, and funding needs, then translate those assumptions into financial outputs such as revenue, EBITDA, cash balance, profitability timing, and investor return metrics. This component is valuable because e-commerce platforms often face uncertainty in the early years, especially around network effects and customer acquisition efficiency. Scenario analysis helps founders and analysts move beyond a single forecast and prepare for realistic ranges of outcomes. It supports decision-making by showing which assumptions have the greatest impact and how much financial cushion may be needed if growth takes longer than planned.
Professional Charts
The professional charts component turns the financial forecast into presentation-ready visuals that make complex e-commerce projections easier to understand. Rather than relying only on rows of numbers, users can communicate trends in GMV, revenue growth, cost behavior, customer acquisition, cash flow, EBITDA, margin expansion, and profitability using clear charts and graphs. These visuals are especially useful for pitch decks, lender submissions, board updates, internal strategy meetings, and business planning documents because stakeholders often need to understand the forecast quickly. The charts can help illustrate how the platform scales over time, how revenue streams mature, how operating leverage improves as fixed costs are spread across a larger revenue base, and how cash burn changes as the business approaches break-even. For an e-commerce platform, visual reporting is important because the relationship between users, orders, take rate, subscriptions, and expenses can be difficult to interpret from financial statements alone. This component helps users present the financial model in a polished and professional format while supporting clearer communication, stronger planning discussions, and more confident decision-making.
ROE Components and DuPont Analysis
The ROE components and DuPont analysis section helps users evaluate return on equity by breaking performance into the underlying drivers that influence shareholder returns. Instead of viewing return on equity as a single output, this component can separate it into profitability, asset efficiency, and financial leverage, giving users a more detailed understanding of how the e-commerce platform creates value over time. Inputs may include net profit, revenue, total assets, equity, debt, retained earnings, and balance sheet assumptions, while outputs may include margin trends, asset turnover, leverage impact, and overall ROE. This is useful for planning because a platform business may require meaningful upfront investment in technology, marketing, team development, and working capital before it becomes profitable. DuPont analysis helps users see whether returns are being driven by improved operating margins, more efficient use of assets, or increased leverage. It can also support investor discussions by showing how the business may evolve from an early-stage loss-making model into a scalable platform with stronger returns. For consultants and analysts, this section adds depth to the financial model by connecting operational performance with long-term financial efficiency and value creation.
Revenue Inputs
The revenue inputs section is where users define the commercial assumptions that drive the e-commerce platform forecast. This component typically includes inputs for seller acquisition, buyer acquisition, order frequency, average order value, Gross Merchandise Value, commission rates, fixed transaction fees, seller subscription tiers, buyer subscriptions, promoted listings, advertising services, and other value-added revenue streams. By linking these assumptions together, the model can calculate how platform activity converts into recognized revenue over time. This is especially important for a marketplace or multi-vendor e-commerce model because the platform may not earn the full transaction value as revenue. Instead, it often earns a take rate, subscription fees, and service fees tied to seller participation and buyer activity. Users can adjust pricing, commissions, adoption rates, and activity levels to reflect their own strategy, category focus, and growth expectations. The revenue inputs component is useful for business planning because it forces users to think through the actual mechanics of monetization. It also helps investors and stakeholders understand how the business will generate income, which revenue streams are most important, and what assumptions must be achieved to support the forecast.
Bank-Ready Reports
The bank-ready reports component organizes financial outputs in a format that can support lender reviews, funding applications, and professional financial presentations. It can include projected profit and loss statements, cash flow forecasts, balance sheets, debt schedules, financing assumptions, profitability metrics, repayment capacity indicators, and summary reports that explain how the business is expected to perform over time. For an e-commerce platform, these reports are important because lenders and funding partners often need to see more than revenue growth. They want to understand startup costs, working capital needs, cash burn, debt service capacity, operating margins, and whether the business has enough liquidity to reach profitability. This component helps users present their projections in a structured and credible way, reducing the need to manually reformat statements for external review. It also supports internal planning by showing how funding decisions affect cash balance, financial position, and long-term sustainability. Whether the user is preparing for a bank loan, investor meeting, grant application, or board review, bank-ready reporting makes the model easier to explain, easier to audit, and more useful for serious financial decision-making.
Revenue Breakdown
The revenue breakdown component gives users a detailed view of how total revenue is built from multiple e-commerce platform revenue streams. It can separate commission revenue, fixed transaction fees, seller subscriptions, buyer subscriptions, promoted listings, advertising, seller tools, premium services, and any other monetization channels included in the business model. The section may use inputs such as number of active sellers, number of buyers, order volume, GMV, take rate, monthly subscription pricing, conversion to paid tiers, adoption of add-on services, and growth rates by customer segment. The outputs help users understand which revenue streams are expected to contribute the most, how revenue mix changes over time, and whether the business is overly dependent on one source of income. This is valuable because e-commerce platforms can improve resilience by combining transaction-based revenue with recurring subscription and service revenue. A clear revenue breakdown also helps users identify pricing opportunities, test different monetization strategies, and explain the business model to investors or partners. It supports decision-making by showing how changes in seller behavior, buyer activity, order value, or subscription adoption affect total revenue and margin potential.
KPI Dashboard
The KPI dashboard focuses on the operating metrics that determine whether the e-commerce platform is gaining traction and moving toward sustainable performance. It may track key metrics such as GMV, active sellers, active buyers, orders, average order value, order frequency, customer acquisition cost, seller acquisition cost, conversion rates, take rate, churn, revenue per user, gross margin, EBITDA margin, cash runway, and payback indicators. These metrics help users evaluate the business beyond the traditional financial statements. For example, revenue may grow, but if acquisition costs rise faster than customer value, profitability can be delayed. Similarly, seller growth may look strong, but buyer activity and order frequency must also support marketplace liquidity. The KPI dashboard helps users monitor the health of the platform and compare performance against internal targets or industry benchmarks. It is useful for monthly management reviews, investor updates, and strategic planning because it connects operational activity with financial outcomes. By keeping these metrics visible, the template helps users make better decisions about marketing allocation, pricing, staffing, customer support, technology investment, and growth priorities.
Break-Even Analysis
The break-even analysis component helps users estimate when the e-commerce platform may begin generating enough revenue to cover its cost structure and move toward sustainable profitability. It can use assumptions from the revenue model, cost of goods sold, payment processing, hosting, customer support, payroll, marketing, software, office costs, and other operating expenses to calculate the point at which contribution margin covers fixed costs. Outputs may include break-even month, break-even revenue, required GMV, required order volume, required number of active buyers or sellers, EBITDA break-even, and cash break-even. This is especially useful for e-commerce platforms because early-stage losses are common while the business invests in technology development, marketplace liquidity, customer acquisition, and team growth. Break-even analysis helps users understand how long the business may need funding support and which levers can shorten the path to profitability. For example, improving average order value, raising the take rate, increasing subscription adoption, reducing acquisition costs, or controlling payroll can shift the break-even timeline. This component supports funding preparation, internal budgeting, and strategic decision-making by showing what scale is required for the platform to become financially viable.
Funding Requirements and Startup Capital Planning
The funding requirements and startup capital planning component helps users estimate how much capital may be needed to launch, operate, and grow the e-commerce platform before it becomes self-sustaining. It can include one-time startup costs such as platform development, server infrastructure setup, data analytics tools, legal setup, licenses, branding, initial marketing, office equipment, and other pre-launch investments. It can also include working capital needs, early operating losses, hiring costs, marketing budgets, technology maintenance, and contingency reserves. Outputs may include total startup funding required, monthly cash burn, minimum cash balance, financing gap, investor funding need, debt requirements, and runway. This is important because an e-commerce platform may require substantial upfront investment before meaningful transaction volume and recurring revenue develop. Users can test different funding structures, including equity, debt, founder contribution, or staged financing, and see how each option affects cash flow and financial position. This component is useful for investor presentations, loan applications, internal launch planning, and budgeting because it helps users avoid undercapitalization. By clearly showing when cash is needed and why, the model supports more disciplined fundraising and more realistic growth planning.
File types:
Excel – Single-User: .xlsx
Excel – Multi-User: .xlsx
Similar ProductsOther customers were also interested in...


 HenrySheykin
Book Subscription Box Financial Model Excel Templa...
The Book Subscription Box Financial Model helps founders and planners turn a monthly book box idea i... Read more
Surprise Subscription Box Financial Model Excel Te...
The Subscription Box Financial Model Template helps entrepreneurs, founders, analysts, consultants, ... Read more

SaaS Model Templates – Small Bundle Version
Since you are planning to start your very own SaaS business, you will certainly need to prepare a ... Read more

SaaS Model Templates – Big Bundle Version
Since you are planning to start your very own SaaS business, you will certainly need to prepare a ... Read more

 Jason Varner
Product + Subscription Financial Model
Build a strategy for adding recurring revenues services to your product. Includes financial statemen... Read more
Subscription Box Financial Model – Up to 72 ...
Test many variables in this financial model for a subscription box company. Includes up to six prici... Read more

 Giorgos
Subscription Business – 10 Year Financial Model
Financial Model providing a 10-year financial plan for a startup or operating Subscription Business.... Read more
 Andreas
Online Businesses Bundle (6 Models)
This is a collection of selected financial model templates for projects or ventures in the Online Bu... Read more
 eFinancialModels
Online Businesses Financial Model Bundle
This is a collection of financial model templates for businesses in the Information technology Indus... Read more
You must log in to submit a review.