
0 ITEMS

Packaging Design Agency Financial Model Excel Template
The Packaging Design Agency Financial Model Financial Model Template helps entrepreneurs, founders, consultants, analysts, and agency owners turn a creative services business idea into a structured five-year financial forecast. Instead of starting with a blank spreadsheet, users can work from an editable model designed around the economics of a packaging design agency, including project-based design work, monthly retainers, strategic consulting, staffing needs, software costs, launch expenses, and cash flow timing. It gives users a practical way to organize assumptions, estimate revenue potential, plan startup costs, forecast operating expenses, and understand how the agency may perform before major financial commitments are made. This template is especially useful for people preparing business plans, investor presentations, loan applications, internal budgets, or expansion forecasts. The model brings together revenue assumptions, cost structures, payroll planning, profitability analysis, cash flow forecasting, and break-even analysis in one connected planning tool. By updating the input fields with your own pricing, client volume, service mix, salaries, marketing spend, and overhead assumptions, you can see how changes affect monthly and annual results. This makes the model useful not only for launch planning, but also for ongoing decision-making as the agency grows. For a packaging design agency, financial performance depends on more than total sales. The business must balance billable hours, client acquisition, retainers, freelance support, software subscriptions, payroll, office setup, prototyping costs, and timing of client payments. This financial model template helps users evaluate those moving parts in a more disciplined way. It supports planning around project-based revenue, recurring retainer income, consultation services, cash reserves, investor returns, and the path to sustainable profitability. The template is built to be editable, presentation-ready, and compatible with Excel and Google Sheets, making it suitable for solo founders, management teams, finance professionals, and advisors. Users can test different assumptions, review financial outputs, monitor key performance indicators, and present a clear financial story to stakeholders. Whether you are launching a new packaging design agency, expanding an existing studio, seeking funding, or validating a business plan, this model helps replace guesswork with a structured financial planning framework.


Financial Model Overview
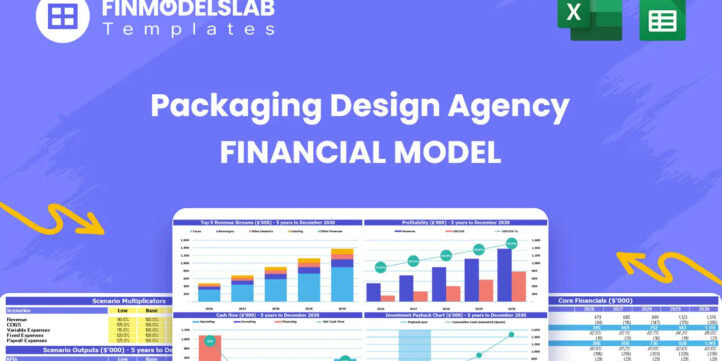
The Packaging Design Agency Financial Model Financial Model Template gives users a structured way to forecast the financial performance of a creative agency focused on packaging design, brand packaging systems, product presentation, prototyping support, and strategic design consultation. It is built for entrepreneurs, founders, agency owners, consultants, analysts, and business planners who need a ready-to-use forecasting tool for planning, funding, budgeting, and decision-making. The model brings together the assumptions that matter most for this business type, including billable service revenue, retainer growth, hourly rates, project volume, payroll, startup investment, operating expenses, cash flow, profitability, break-even timing, and investor return metrics. Instead of building a financial forecast from scratch, users can input their own assumptions and review connected outputs across a five-year planning period. This makes it easier to understand whether the agency can attract enough clients, support its team, manage cash needs, and reach sustainable profitability while maintaining a professional, investor-ready financial plan.
All-in-One Dashboard
The all-in-one dashboard gives users a central view of the most important inputs and outputs in the Packaging Design Agency Financial Model. It is designed to help users quickly understand how their core assumptions translate into projected financial performance without needing to search through multiple tabs or manually calculate results. This section may summarize revenue, gross profit, EBITDA, net income, cash position, payback timing, return metrics, and other high-level indicators that matter to founders, investors, lenders, and internal stakeholders. For a packaging design agency, this is especially useful because the business model includes several moving parts, such as project-based design work, monthly retainers, strategic consultation, software expenses, freelance support, and payroll growth. By bringing the key assumptions and outcomes together, the dashboard helps users review the overall health of the forecast, identify whether the agency is moving toward profitability, and make faster decisions about pricing, hiring, marketing spend, and funding needs. It also supports presentations by giving stakeholders a concise financial summary that communicates the agency’s plan in a clear and professional format.
Low, Base, and High Scenario Analysis
The low, base, and high scenario analysis section helps users stress-test the business plan under different performance conditions. A packaging design agency may not always grow exactly as expected, because client acquisition, project size, retainer conversion, hourly rates, and operating expenses can vary from plan. This component allows users to compare conservative, expected, and optimistic cases so they can see how changes in key assumptions affect revenue, cash flow, profit, and funding requirements. The low scenario can be used to model slower sales cycles, lower utilization, reduced client demand, delayed retainer adoption, or higher marketing costs. The base scenario can represent the main operating plan, while the high scenario can show the impact of stronger market traction, higher pricing, faster client conversion, or more recurring retainers. This is valuable for decision-making because it shows the range of possible outcomes instead of relying on a single forecast. It is also useful for funding conversations, because investors and lenders often want to understand how resilient the business is if performance is weaker than expected and how much upside may exist if growth is stronger than planned.
Professional Charts
The professional charts section converts the model’s financial outputs into visual reports that are easier to interpret, review, and present. Rather than relying only on rows of numbers, users can view trends in revenue, cash flow, profitability, expenses, margins, and other financial results through clean charts and graphs. For a packaging design agency, these visuals help communicate the growth story behind the forecast, such as the transition from early project-based work to a more stable mix of retainers and strategic services. Charts can make it easier to show when revenue accelerates, when cash balances strengthen, when EBITDA becomes positive, and how operating expenses scale with the agency’s growth. This component is useful for pitch decks, business plans, lender discussions, board updates, and internal planning meetings because it helps stakeholders understand the financial narrative quickly. It also helps users identify patterns that may be less obvious in detailed schedules, such as margin compression, cash pressure, uneven revenue growth, or expense categories that are increasing faster than sales. The result is a more presentation-ready model that supports clearer financial communication.
ROE Components and DuPont Analysis
The ROE components and DuPont analysis section helps users understand the drivers behind return on equity rather than viewing return metrics as a single isolated number. For a packaging design agency, return on equity may be influenced by profitability, asset efficiency, cost structure, cash management, debt assumptions, and the amount of owner or investor capital used to launch and scale the business. This component breaks return performance into underlying financial factors so users can evaluate whether returns are being driven by stronger margins, better utilization of resources, improved revenue generation, or changes in leverage. Inputs may include net income, equity, assets, revenue, expenses, and other financial statement data generated by the model. Outputs may include return on equity and supporting ratios that explain how the business is creating or limiting value for owners and investors. This is useful for planning because it moves the analysis beyond simple revenue growth and helps users assess whether the agency is becoming more financially efficient over time. It also supports investor discussions by showing how capital is expected to produce returns and what operational levers could improve financial performance.
Revenue Inputs
The revenue inputs section allows users to define the commercial assumptions that drive the agency’s forecast. For a packaging design agency, revenue may come from one-time packaging design projects, monthly retainer agreements, and strategic consultation services. This component helps users enter or adjust assumptions such as hourly rates, billable hours, project volume, client acquisition pace, service mix, retainer fees, consultation pricing, annual price increases, and utilization levels. Because agency revenue depends heavily on people, pricing, and client demand, this section is one of the most important parts of the model. It helps users translate their go-to-market plan into measurable financial projections and test whether planned sales activity is enough to support payroll, software tools, office setup, marketing, and other operating costs. The outputs generated from these inputs may feed into monthly and annual revenue forecasts, profitability calculations, cash flow projections, and scenario comparisons. This is useful for founders and planners because it forces clear thinking about how the agency will actually make money, how quickly it can scale, and whether the assumed pricing and client volume are realistic for the target market.
Bank-Ready Reports
The bank-ready reports section organizes financial outputs in a format suitable for lenders, funding applications, and formal business planning. Banks and financing partners typically want to review structured financial statements, realistic assumptions, cash flow forecasts, debt repayment capacity, startup funding needs, and evidence that the business can manage its obligations. This component helps users present the Packaging Design Agency Financial Model in a professional format that supports credibility during loan or financing discussions. It may include projected profit and loss statements, cash flow statements, balance sheet summaries, debt schedules, profitability metrics, and key assumptions used to build the forecast. For a packaging design agency, this is useful when requesting funds for launch costs such as workstations, software, prototyping equipment, office setup, initial marketing, or working capital. It also supports existing agencies that are seeking financing for expansion, hiring, equipment upgrades, or larger client acquisition campaigns. By organizing the outputs clearly, the reports help users reduce back-and-forth with lenders and provide a more complete view of the agency’s financial plan, repayment potential, and cash management strategy.
Revenue Breakdown
The revenue breakdown section provides a detailed view of how total sales are generated across the agency’s different service lines. In a packaging design agency, revenue quality can vary significantly depending on the mix of project-based design, monthly retainers, and strategic consultation. One-time projects may provide strong income but can be less predictable, while retainers may create more stable recurring revenue and improve cash flow planning. Strategic consultation may carry higher pricing but depend on specialized expertise and client demand. This component helps users separate these revenue streams and analyze how each contributes to total sales over time. Inputs may include pricing by service type, number of clients, average project hours, retainer counts, monthly fees, consultation volume, and growth rates. Outputs may show revenue by category, service mix percentages, monthly revenue trends, and the impact of shifting toward recurring income. This is useful for decision-making because it helps users identify which services are driving the most value, where pricing may need adjustment, and how the agency can reduce dependency on unpredictable project work. It also supports strategic planning by showing how the revenue model evolves as the agency matures.
KPI Dashboard
The KPI dashboard section focuses on the key performance indicators that help users monitor whether the packaging design agency is operating according to plan. Financial statements show the overall result, but KPIs help explain the operating performance behind those results. This component may track metrics such as revenue growth, EBITDA margin, gross margin, cash runway, client acquisition performance, average revenue per client, retainer contribution, utilization, payroll as a percentage of revenue, and other agency-specific measures. It can also support benchmarking against industry expectations so users can evaluate whether the agency’s cost structure, margins, and growth assumptions are reasonable. For founders and managers, this dashboard is useful for monthly reviews, investor updates, and internal decision-making because it highlights trends before they become major problems. If payroll is growing faster than revenue, if cash flow is tightening, or if retainer revenue is not increasing as planned, the KPI dashboard can make those issues easier to see. It also helps users communicate performance in a concise way, giving stakeholders a practical summary of the agency’s progress, operational efficiency, and financial health.
Break-Even Analysis
The break-even analysis section helps users identify when the packaging design agency is expected to cover its fixed and variable costs and begin generating profit. This is a critical planning milestone for any service-based business because early months often include setup costs, initial hiring, software subscriptions, marketing spend, and time required to build a client base. The break-even component may use assumptions from revenue, cost of services, payroll, operating expenses, and gross margin to calculate the sales level or month when the agency becomes financially self-sustaining. For a packaging design agency, this can help users understand how many projects, retainers, or consultation engagements are needed to support the business. It can also show whether the agency needs more upfront funding, a leaner cost structure, higher pricing, faster client acquisition, or a stronger retainer strategy. This section is useful for investors, lenders, and founders because it provides a clear target and timeline for reaching profitability. It also supports practical decisions such as when to hire full-time staff, when to rely on freelancers, how aggressively to spend on marketing, and how much cash reserve should be maintained during the launch phase.
Startup Costs and Operating Expense Planning
The startup costs and operating expense planning section helps users estimate the capital required to launch and run the packaging design agency. Startup costs may include high-performance computers, design software, prototyping equipment, office furniture, branding, website development, legal setup, deposits, initial marketing, professional services, and working capital. Operating expenses may include payroll, contractor support, rent, subscriptions, insurance, advertising, accounting, utilities, travel, and other recurring costs needed to operate the agency. This component separates one-time launch investments from ongoing monthly expenses so users can understand both the initial funding requirement and the recurring cost base that must be supported by revenue. For a packaging design agency, this distinction is important because the business may need meaningful upfront investment in creative tools and professional presentation while still managing cash carefully in the first year. The outputs from this section can feed into the cash flow forecast, profit and loss statement, funding requirement, and break-even calculation. It is useful for budgeting, fundraising, and operational planning because it helps users avoid underestimating the true cost of launch and gives them a clearer view of how much money is needed before the agency becomes profitable.
File types:
Excel – Single-User: .xlsx
Excel – Multi-User: .xlsx
Similar ProductsOther customers were also interested in...


 Giorgos
Microbrewery – 10 Year Financial Model
Financial Model providing a dynamic up to 10-year financial forecast for a startup or existing Micro... Read more

 Peter Graf
Product Dealer Startup – The Customer Centri...
With this financial model, you can create a financial plan for the startup of your product dealershi... Read more
 HenrySheykin
Solar Panel Manufacturing Plant Business Plan Fina...
The Solar Panel Manufacturing Financial Model helps users turn a solar factory concept into a struct... Read more
Clothing Store Financial Model Excel Template
The Clothing Store Financial Model helps turn a retail apparel concept into a structured financial f... Read more
Clothing Manufacturing Business Plan Financial Mod...
The Clothing Manufacturing Financial Model helps users turn a garment production concept into a stru... Read more
Diaper Manufacturing Business Plan Financial Model...
The Diaper Manufacturing Financial Model helps users turn a disposable diaper factory concept into a... Read more
Brewery Business Plan Financial Model Excel Templa...
The Brewery Financial Model helps founders, brewery operators, consultants, and analysts turn a brew... Read more
Food Production Financial Model Excel Template
The Food Manufacturing Financial Model helps entrepreneurs, founders, consultants, analysts, and bus... Read more
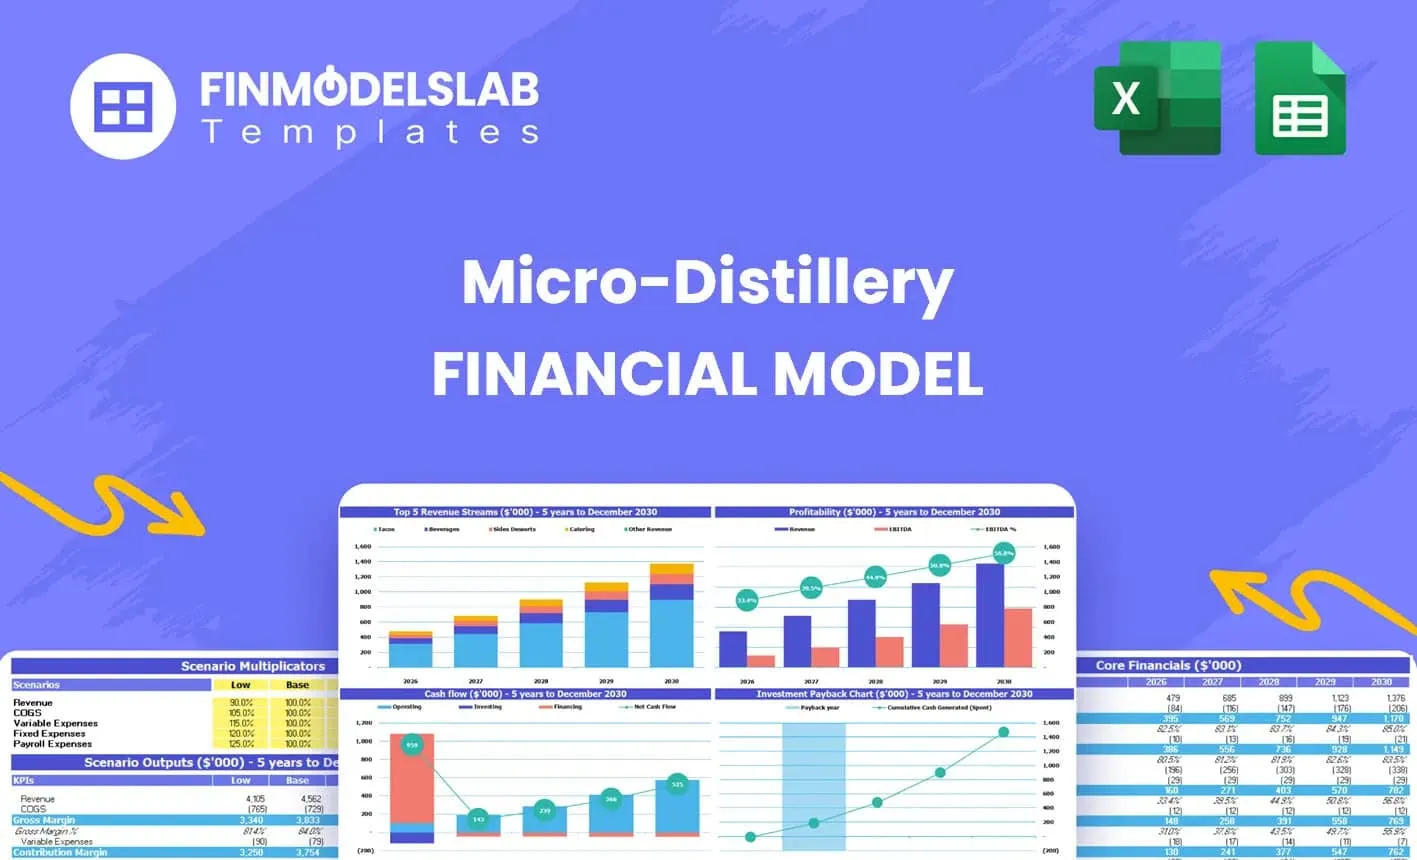
Micro Distillery Business Plan Financial Model Exc...
The Micro-Distillery Financial Model helps founders, operators, consultants, analysts, and business ... Read more

Perfume Oil Business Plan Financial Model Excel Te...
The Perfume Oil Financial Model helps entrepreneurs, founders, consultants, analysts, and business p... Read more
You must log in to submit a review.