0 ITEMS

Industry-Specific Cash Flow Forecast Templates for CFOs

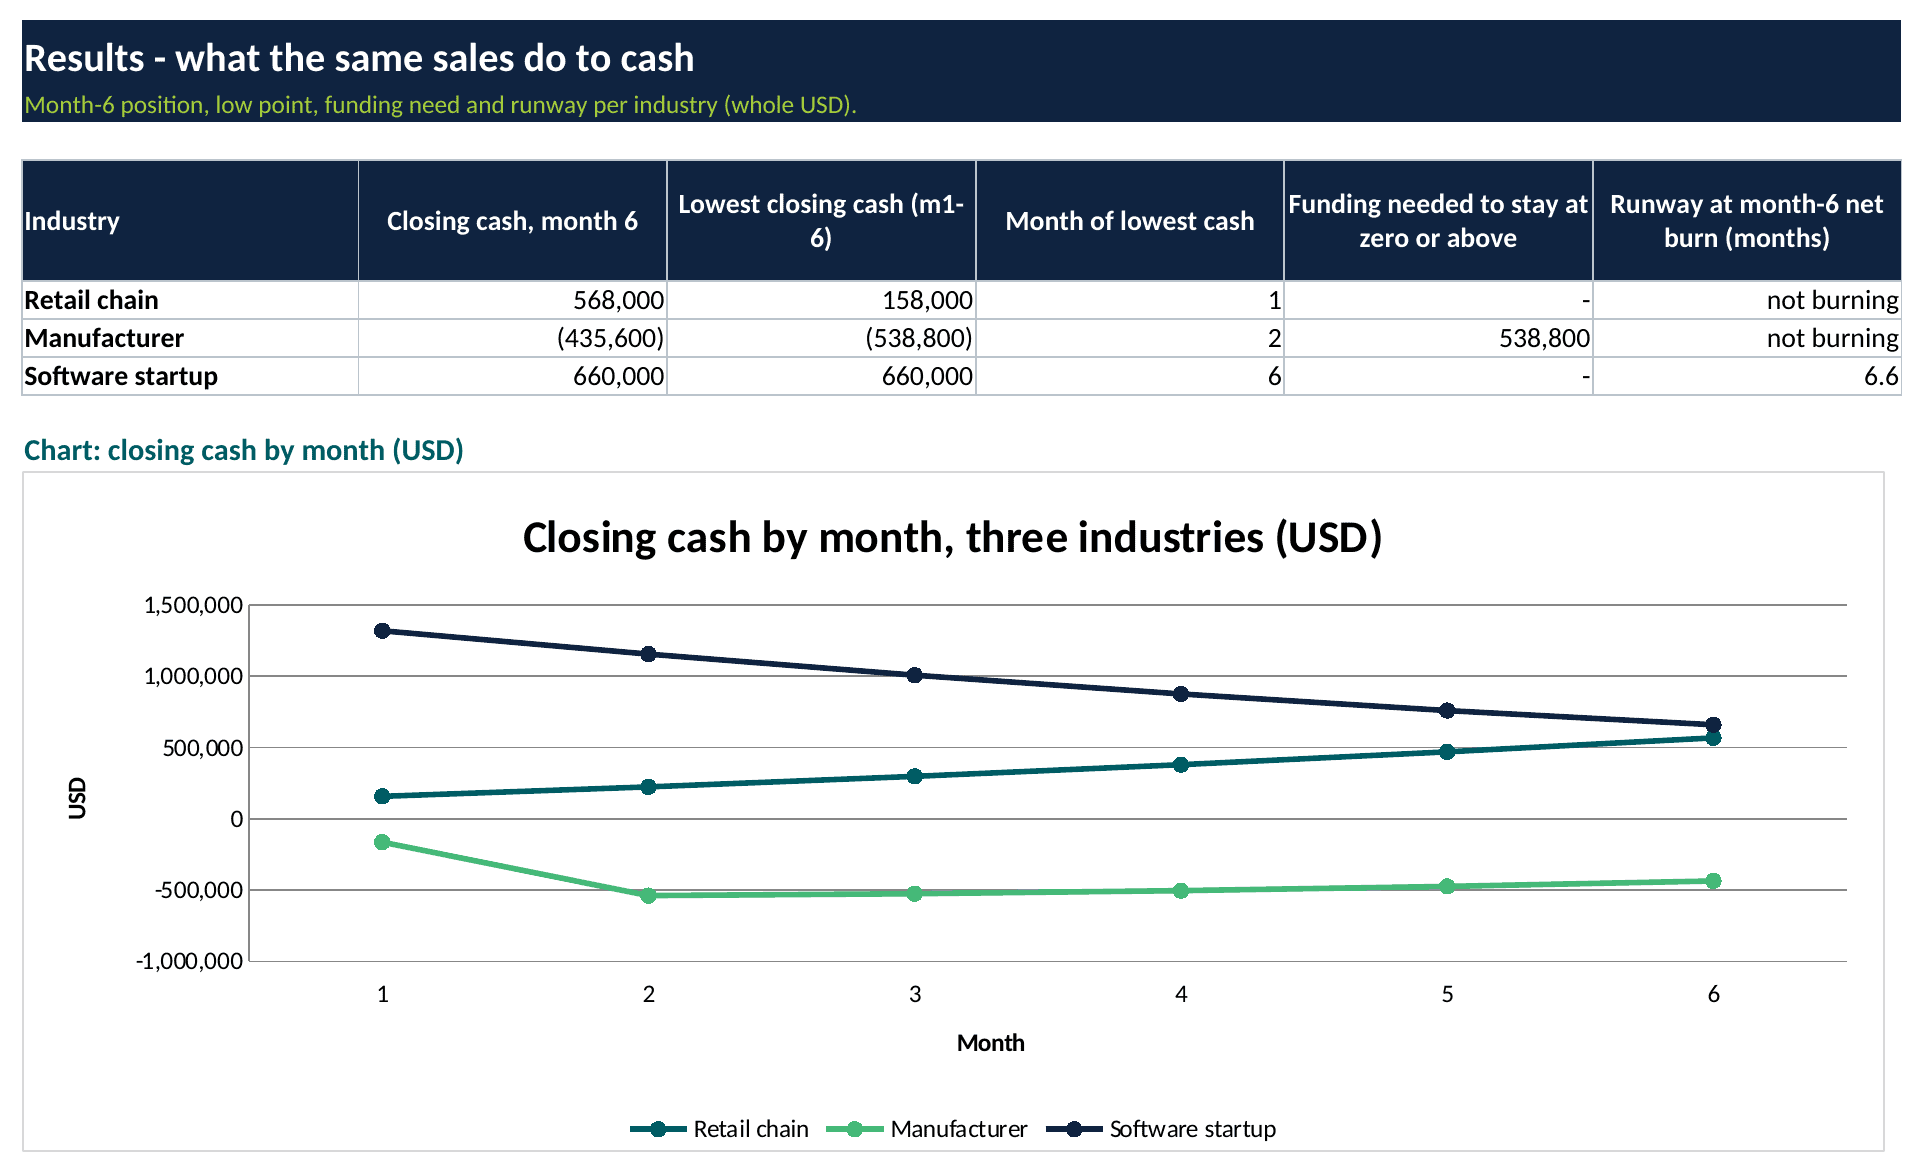
An industry-specific cash flow forecast template keeps the same four lines as a generic one, opening cash, receipts, payments and closing cash, but sets receipts, payments and cost levels to the way the industry actually runs. With identical sales, the worked example below leaves a retail chain with no funding gap, a manufacturer whose cash turns negative in month 1 and bottoms out in month 2, and a software startup with 6.6 months of cash at its month-6 burn rate.
Key Takeaways
- A cash flow forecast is opening cash plus receipts minus payments, and industry templates change when cash moves and how large costs are.
- Retail templates centre on inventory bought ahead of sales, manufacturing templates on slow customer payment, and startup templates on fixed payroll and runway.
- In the worked example, with no opening receivables, identical sales create a USD 538,800 funding need for the manufacturer and none for the retail chain.
- The direct method, which lists actual cash receipts and payments, suits forecasting better than the indirect method, which starts from profit.
- Roll the forecast forward every week and update the timing inputs whenever actual collections or payments differ from the plan.
Start Every Cash Flow Forecast Template with Opening Cash, Receipts and Payments
A cash flow forecast is a dated projection of cash coming in and going out, ending in a closing cash balance for each period. The formula is closing cash = opening cash + cash receipts – cash payments, applied week by week for the first 13 weeks and month by month after that. The worked example below uses months for brevity, and the same formula applies to weekly periods.
Forecasters choose between two presentations. International Accounting Standard 7, the standard on statements of cash flows, describes the direct method, in which major classes of gross cash receipts and gross cash payments are disclosed, and the indirect method, in which profit or loss is adjusted for non-cash transactions (International Accounting Standard 7, Statement of Cash Flows). Forecast templates use the direct method because receipts and payments map to bank balances, customers and suppliers.
Uneven cash flow is a common problem: 51% of US small employer firms named uneven cash flows as a challenge, according to the Federal Reserve Banks’ 2025 report on employer firms, which covers the 2024 Small Business Credit Survey (Federal Reserve Banks, 2025 report on employer firms).
Retail, Manufacturing and Startup Templates Differ in Four Inputs
The four inputs that change by industry are two timing inputs and two cost inputs. The customer collection lag is the number of months between a sale and the cash arriving, and the cost payment offset says whether suppliers are paid before the sale, as with inventory bought ahead, or in the sale month. The cost inputs are the share of sales spent on variable costs and the fixed monthly cash costs.
The three templates in the worked example cover a retail chain, a manufacturer and a startup selling software as a service (SaaS). The eFinancialModels retail and manufacturing model categories contain models for those industries.
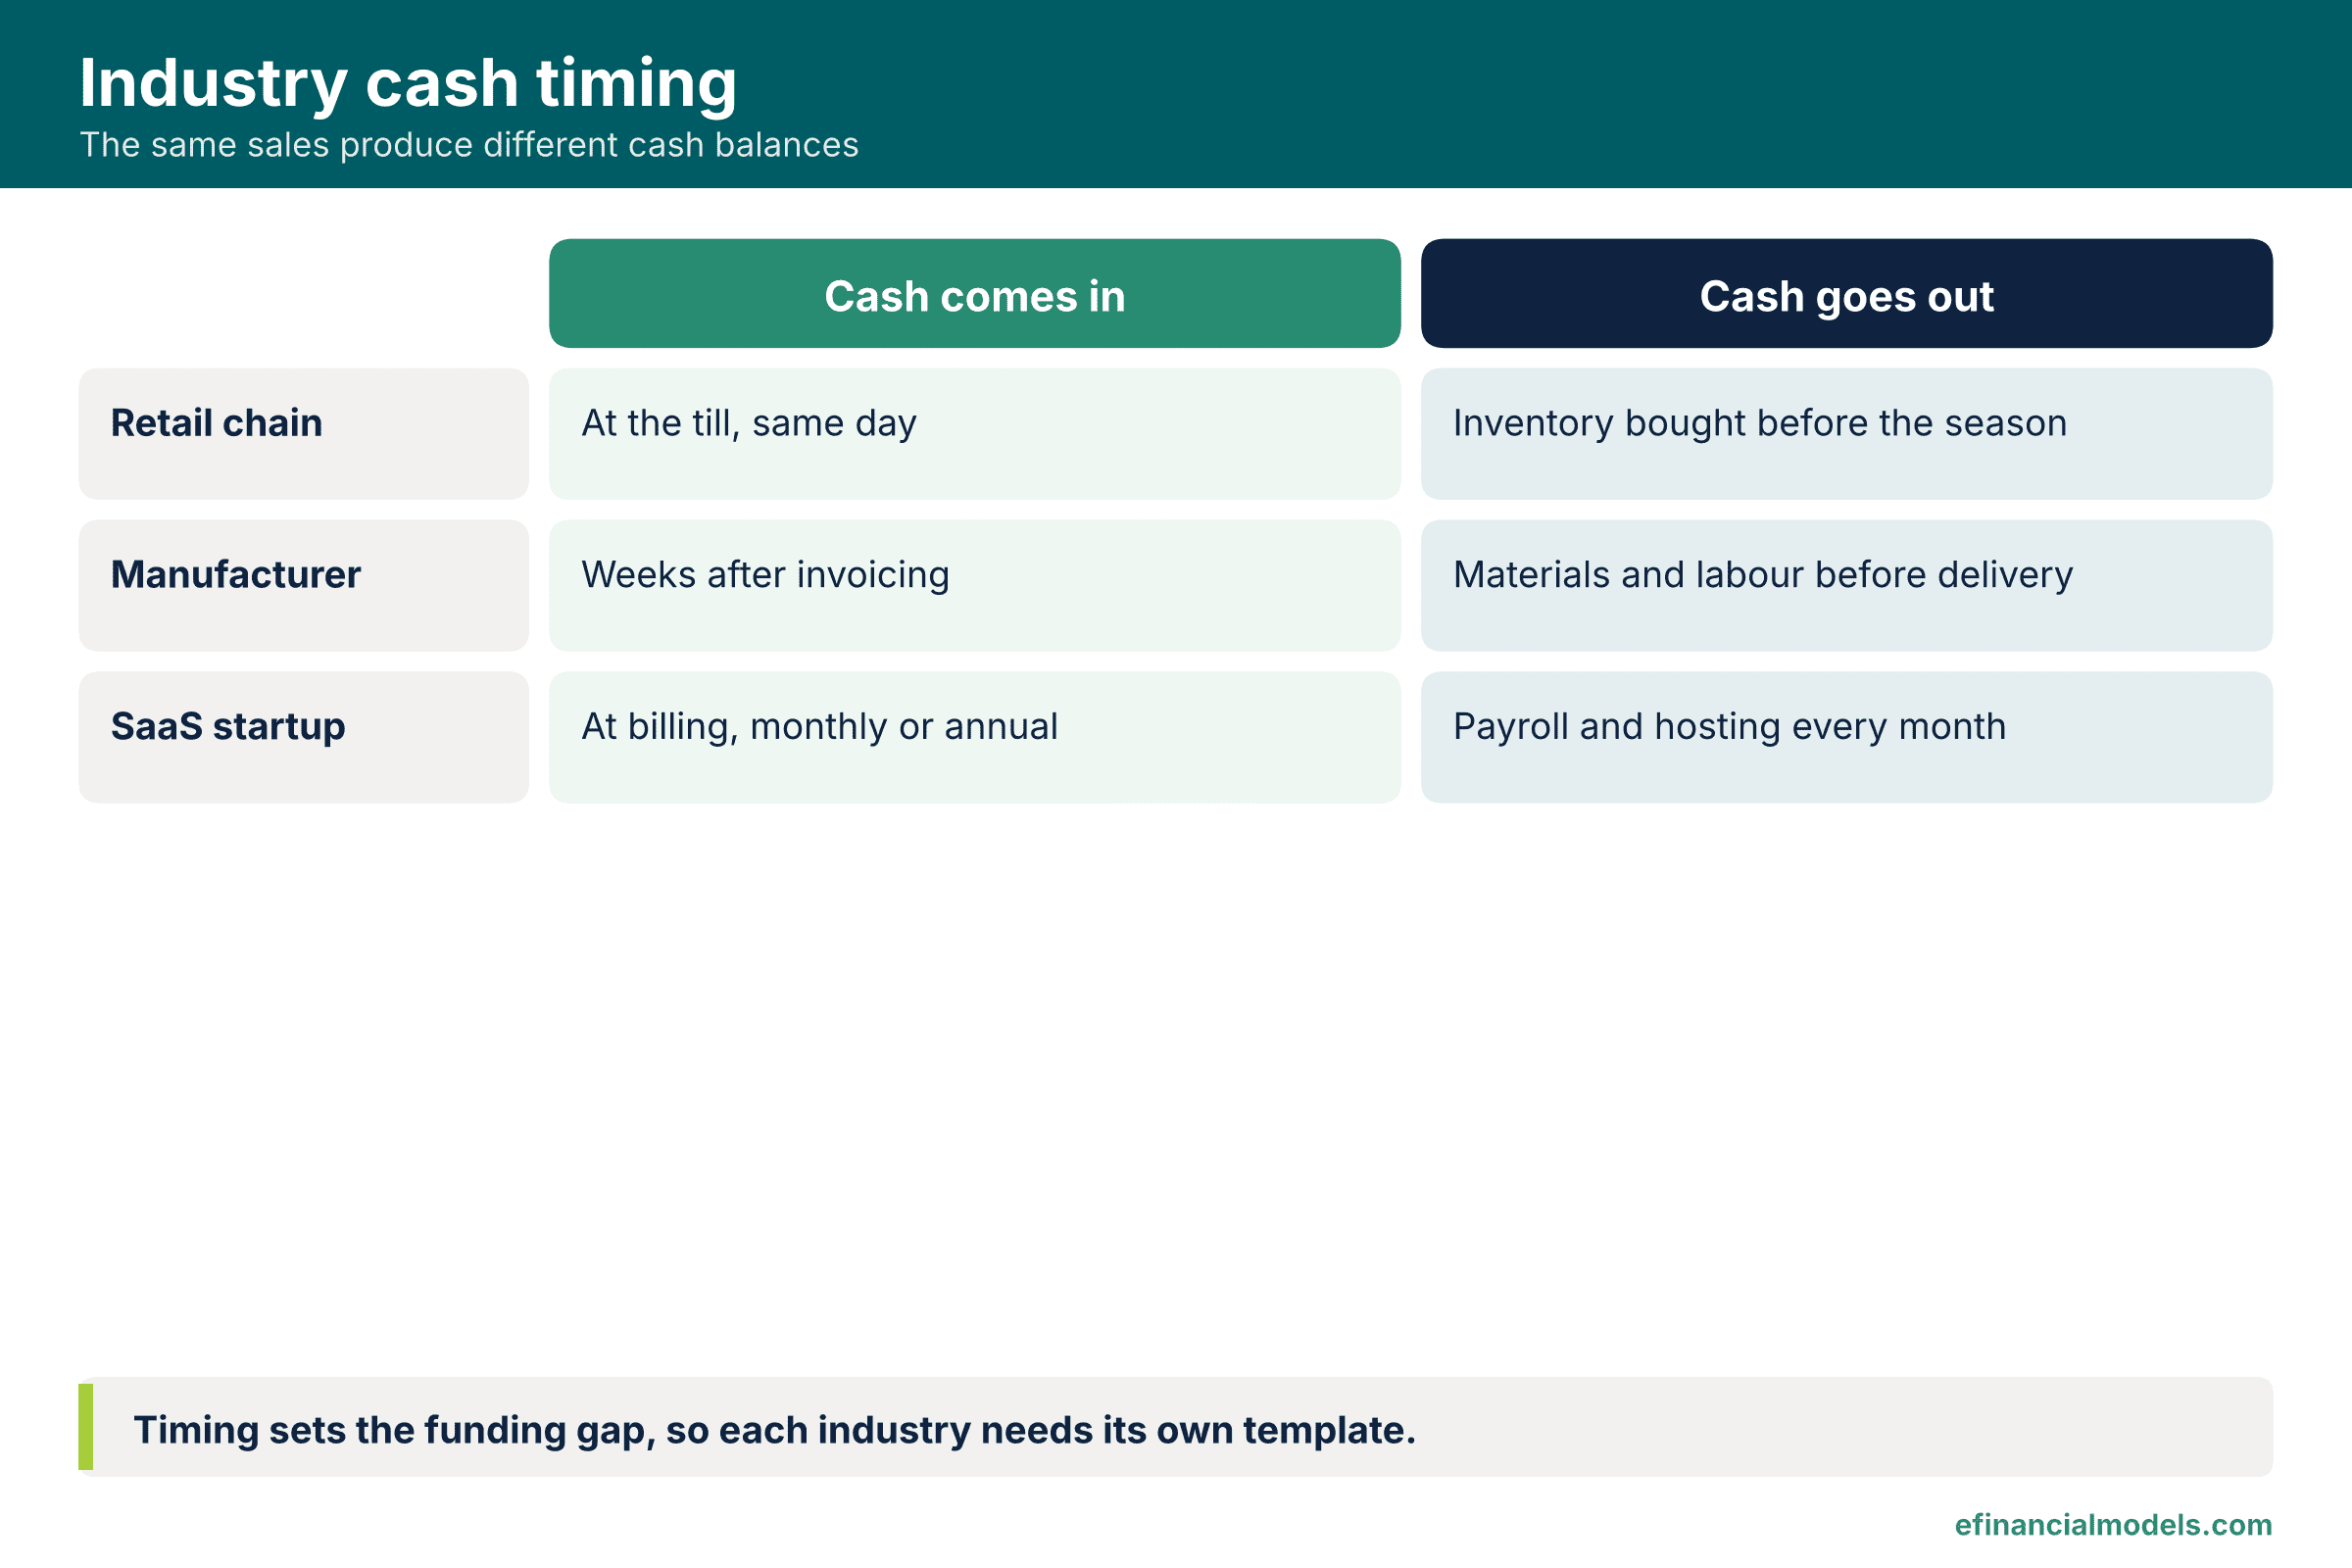
| Industry | Receipts arrive | Largest early outflow | Template focus |
|---|---|---|---|
| Retail | At the till, same day | Inventory bought before the season | Seasonal sales curve, purchase schedule |
| Manufacturing | Weeks after invoicing | Materials and labour before delivery | Receivables ageing, production calendar |
| SaaS startup | At billing, monthly or annual | Payroll and hosting | Burn rate, runway, funding date |
The same four inputs fit construction and professional services, whose templates add progress billing, in which invoices follow completed work stages, and hospitality, whose templates add daily takings and weekly supplier runs. The worked example models the first three industries only.
Worked Example: The Same Sales Through Three Industry Timings
The same monthly sales produce three very different cash paths: the retail chain stays positive, the manufacturer bottoms out USD 538,800 below zero in month 2 after turning negative in month 1, and the startup burns down to USD 660,000 by month 6. The example assumes sales of USD 400,000 in month 1, rising by USD 20,000 a month to USD 520,000 in month 7, which is used only to price purchases made one month ahead. It also assumes no opening receivables or payables and leaves out tax, capital spending and financing flows, so an existing business seeds months 1 and 2 with its actual receivables. Opening cash and cost levels differ by industry too, so the example compares industry profiles, not timing alone.
- Retail chain: collection lag 0 months, variable costs of 60% of sales paid one month before the sale, fixed costs of USD 90,000 a month, opening cash of USD 100,000.
- Manufacturer: collection lag 2 months, variable costs of 58% of sales paid one month before the sale, fixed costs of USD 120,000 a month, opening cash of USD 200,000.
- SaaS startup: collection lag 0 months, variable costs of 20% of sales paid in the sale month, fixed costs of USD 500,000 a month, opening cash of USD 1,500,000.
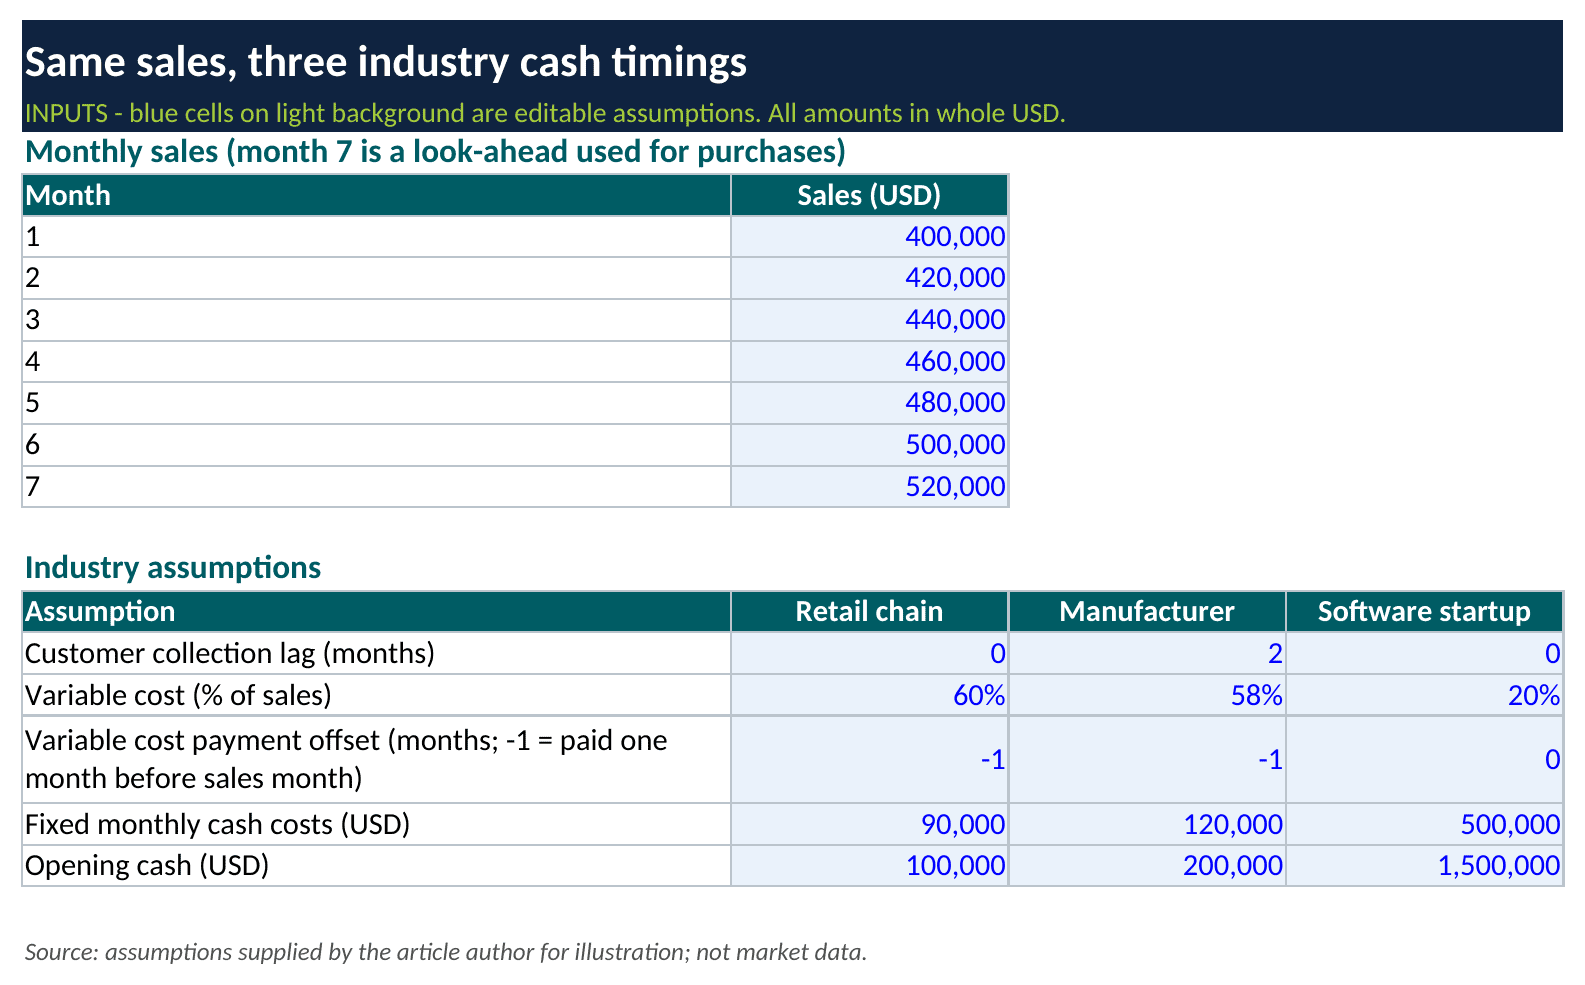
Receipts in month t equal the sales of month t minus the collection lag, so the manufacturer collects its first USD 400,000 only in month 3. For the retail chain and the manufacturer, variable payments in month t equal the cost percentage times the sales of month t+1, because stock and materials are paid one month ahead. In month 1 the manufacturer therefore pays 58% of the USD 420,000 month-2 sales, which is USD 243,600, plus USD 120,000 of fixed costs, from USD 200,000 of opening cash with no receipts yet, leaving minus USD 163,600. Closing cash adds receipts and subtracts both cost lines.
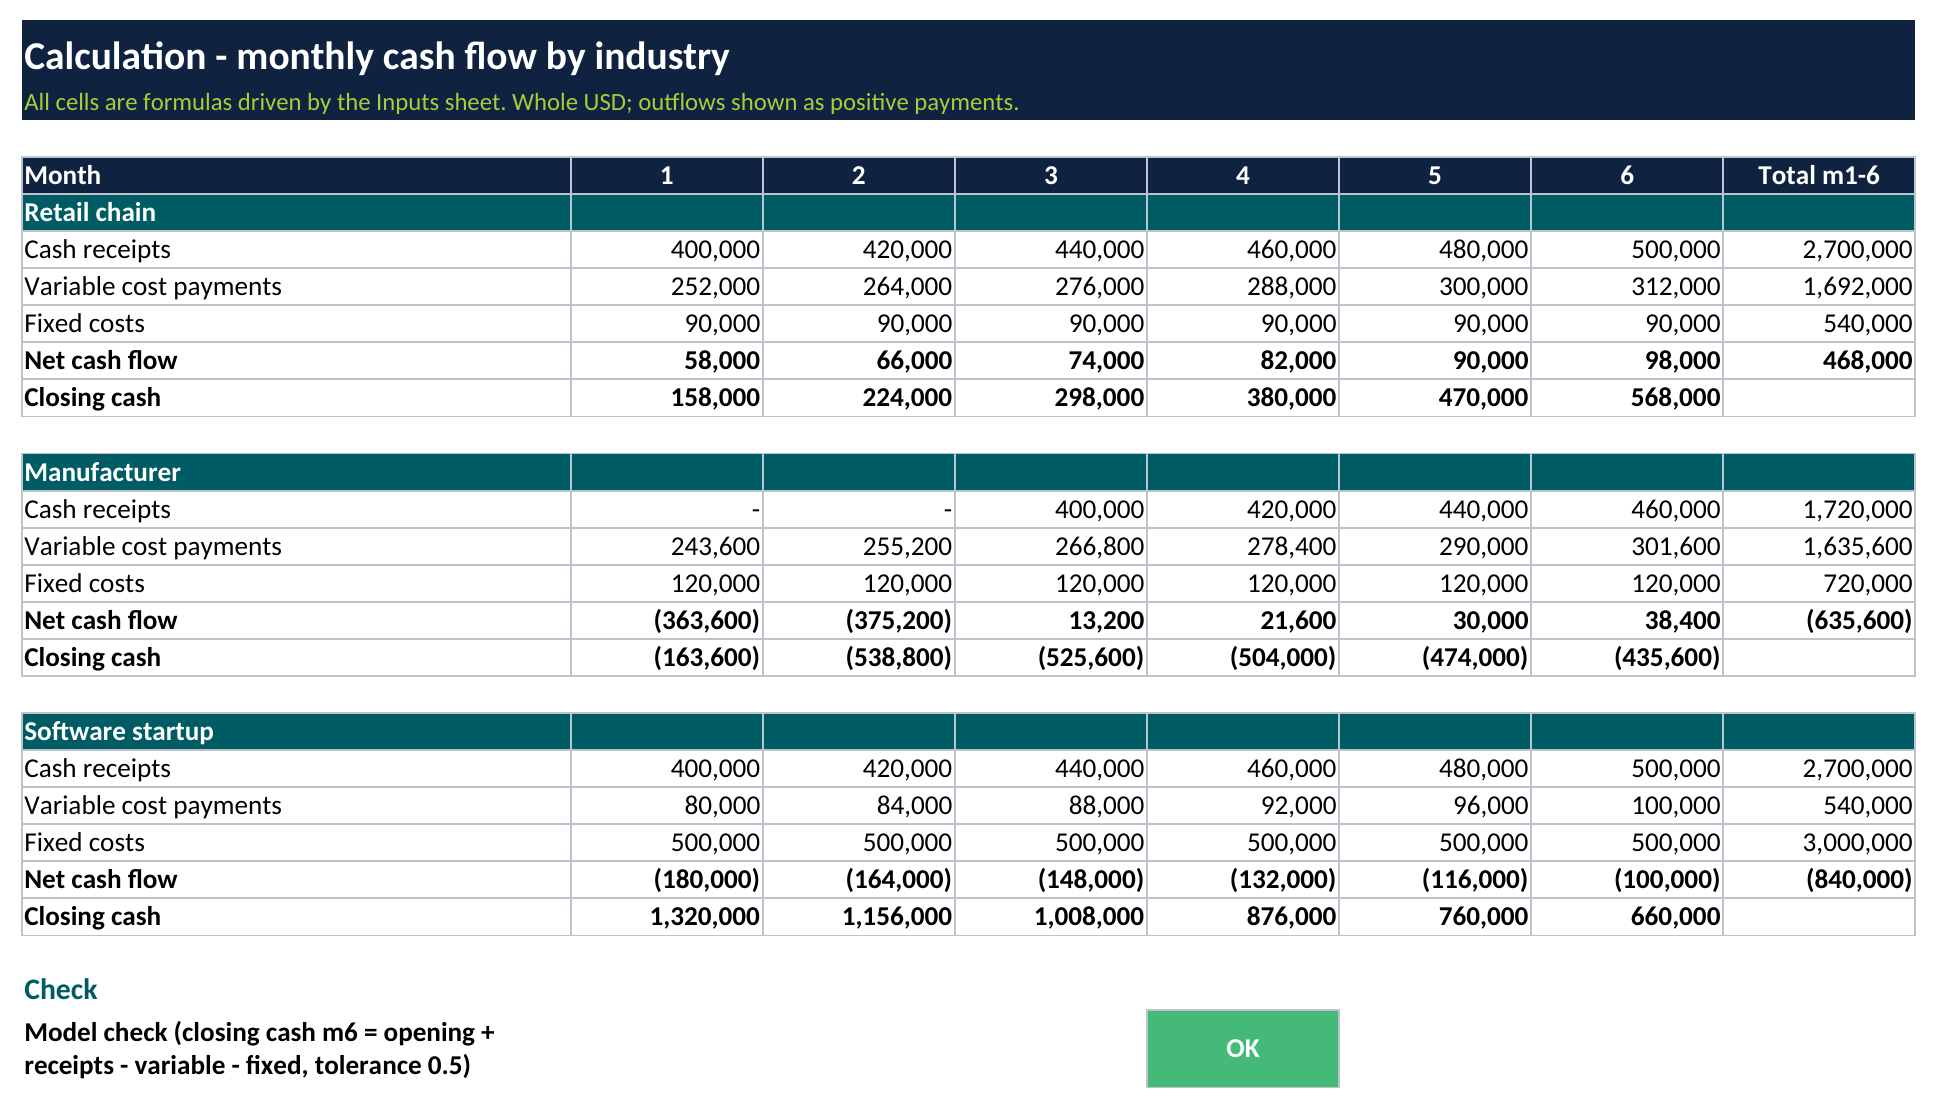
| Closing cash (USD) | Month 1 | Month 2 | Month 3 | Month 4 | Month 5 | Month 6 |
|---|---|---|---|---|---|---|
| Retail chain | 158,000 | 224,000 | 298,000 | 380,000 | 470,000 | 568,000 |
| Manufacturer | -163,600 | -538,800 | -525,600 | -504,000 | -474,000 | -435,600 |
| SaaS startup | 1,320,000 | 1,156,000 | 1,008,000 | 876,000 | 760,000 | 660,000 |
The retail chain’s lowest closing cash is USD 158,000 in month 1, so it needs no funding. The manufacturer’s lowest closing cash is minus USD 538,800 in month 2, so it needs USD 538,800 of funding, such as a credit line, to keep cash at zero or above, before adding any safety buffer; its month-6 net cash flow is positive USD 38,400, so the gap narrows slowly. The startup’s month-6 net cash flow is minus USD 100,000, which is receipts of USD 500,000 less USD 100,000 of variable payments and USD 500,000 of fixed costs. Runway is closing cash of USD 660,000 divided by USD 100,000, or 6.6 months of cash if that outflow continues.
Add the Industry-Specific Lines on Top of the Core Template
These lines extend the core template and sit outside the worked example, which uses a straight-line sales path. Retail templates add a seasonal sales curve and an inventory purchase schedule, because stock is paid for before the selling season.
Cost pressure also feeds the forecast. According to the 2026 report on employer firms from the Federal Reserve Banks, which covers the 2025 Small Business Credit Survey, tariff-related cost challenges among US small employer firms were most prevalent in the retail (69%) and manufacturing (62%) industries (Federal Reserve Banks, 2026 report on employer firms).
A template models that pressure as a change to the variable cost percentage, for example from 60% to 62%, which moves every month of payments at once.
Manufacturing templates add a receivables ageing schedule, which groups unpaid invoices by days overdue, and a production calendar, and late payment lengthens the collection lag. Atradius reported in October 2025 that 47% of business-to-business invoices in Western Europe are still paid late (Atradius, October 2025).
Startup templates add a hiring plan and a funding date, and they report burn, the net cash outflow per month, and runway. The eFinancialModels SaaS model category contains models for software startups.
Avoid Two Template Mistakes
- Forecasting profit instead of cash. Net income includes sales not yet collected, so the manufacturer in the example earns a profit on each month’s sales while its cash is negative.
- Hard-coding timing. A collection lag typed into a formula hides the assumption, so keep it in a labelled input cell.
Frequently Asked Questions
How many weeks should an industry cash flow forecast cover?
A common practice is a 13-week forecast for liquidity and a 12-month monthly view for planning. Seasonal retailers often extend the weekly view to cover the full buying season, since inventory orders are placed well before peak trading. Companies with covenant tests or tight credit lines usually keep the weekly horizon longer, because lenders ask for short-term visibility rather than annual averages.
How do seasonal businesses adjust a cash flow forecast template?
They replace flat monthly sales with a seasonal index, a multiplier for each month built from prior years, and then move inventory purchases earlier by the supplier lead time. The outflow peak lands before the sales peak, so a credit line or cash reserve must be sized for that earlier date, and a weak-season scenario shows how thin the cushion becomes.
Should a startup forecast use the direct or the indirect method?
A startup should forecast with the direct method, because founders and investors ask when the cash runs out, and only a list of expected receipts and payments answers that. The indirect method starts from a loss that includes non-cash items, which hides timing. A startup can still reconcile the two once actual statements exist, but the working forecast belongs to the direct view.
What is the difference between a cash flow forecast and a budget?
A budget sets targets for revenue and cost by accounting period, while a forecast predicts when cash actually moves. A customer invoiced in March may pay in May, so the budget records the sale in March and the forecast records the cash in May. Controllers keep both: the budget measures performance, and the forecast protects the ability to pay suppliers and staff on time.
Conclusion
Cash flow forecast templates differ by industry in timing and cost levels: set the collection lag, cost payment offset, variable cost share and fixed costs first, and the closing cash line shows the funding need. CFOs and controllers who want to test a retail forecast with a funding view can start from the eFinancialModels Financial Model for Simple Retail Chain Rollout, which projects an income statement, balance sheet and cash flow statement and estimates the funding required, including startup costs and a cash reserve.