0 ITEMS

How to Build a Cash Flow Forecast in 7 Steps (Excel Formulas)

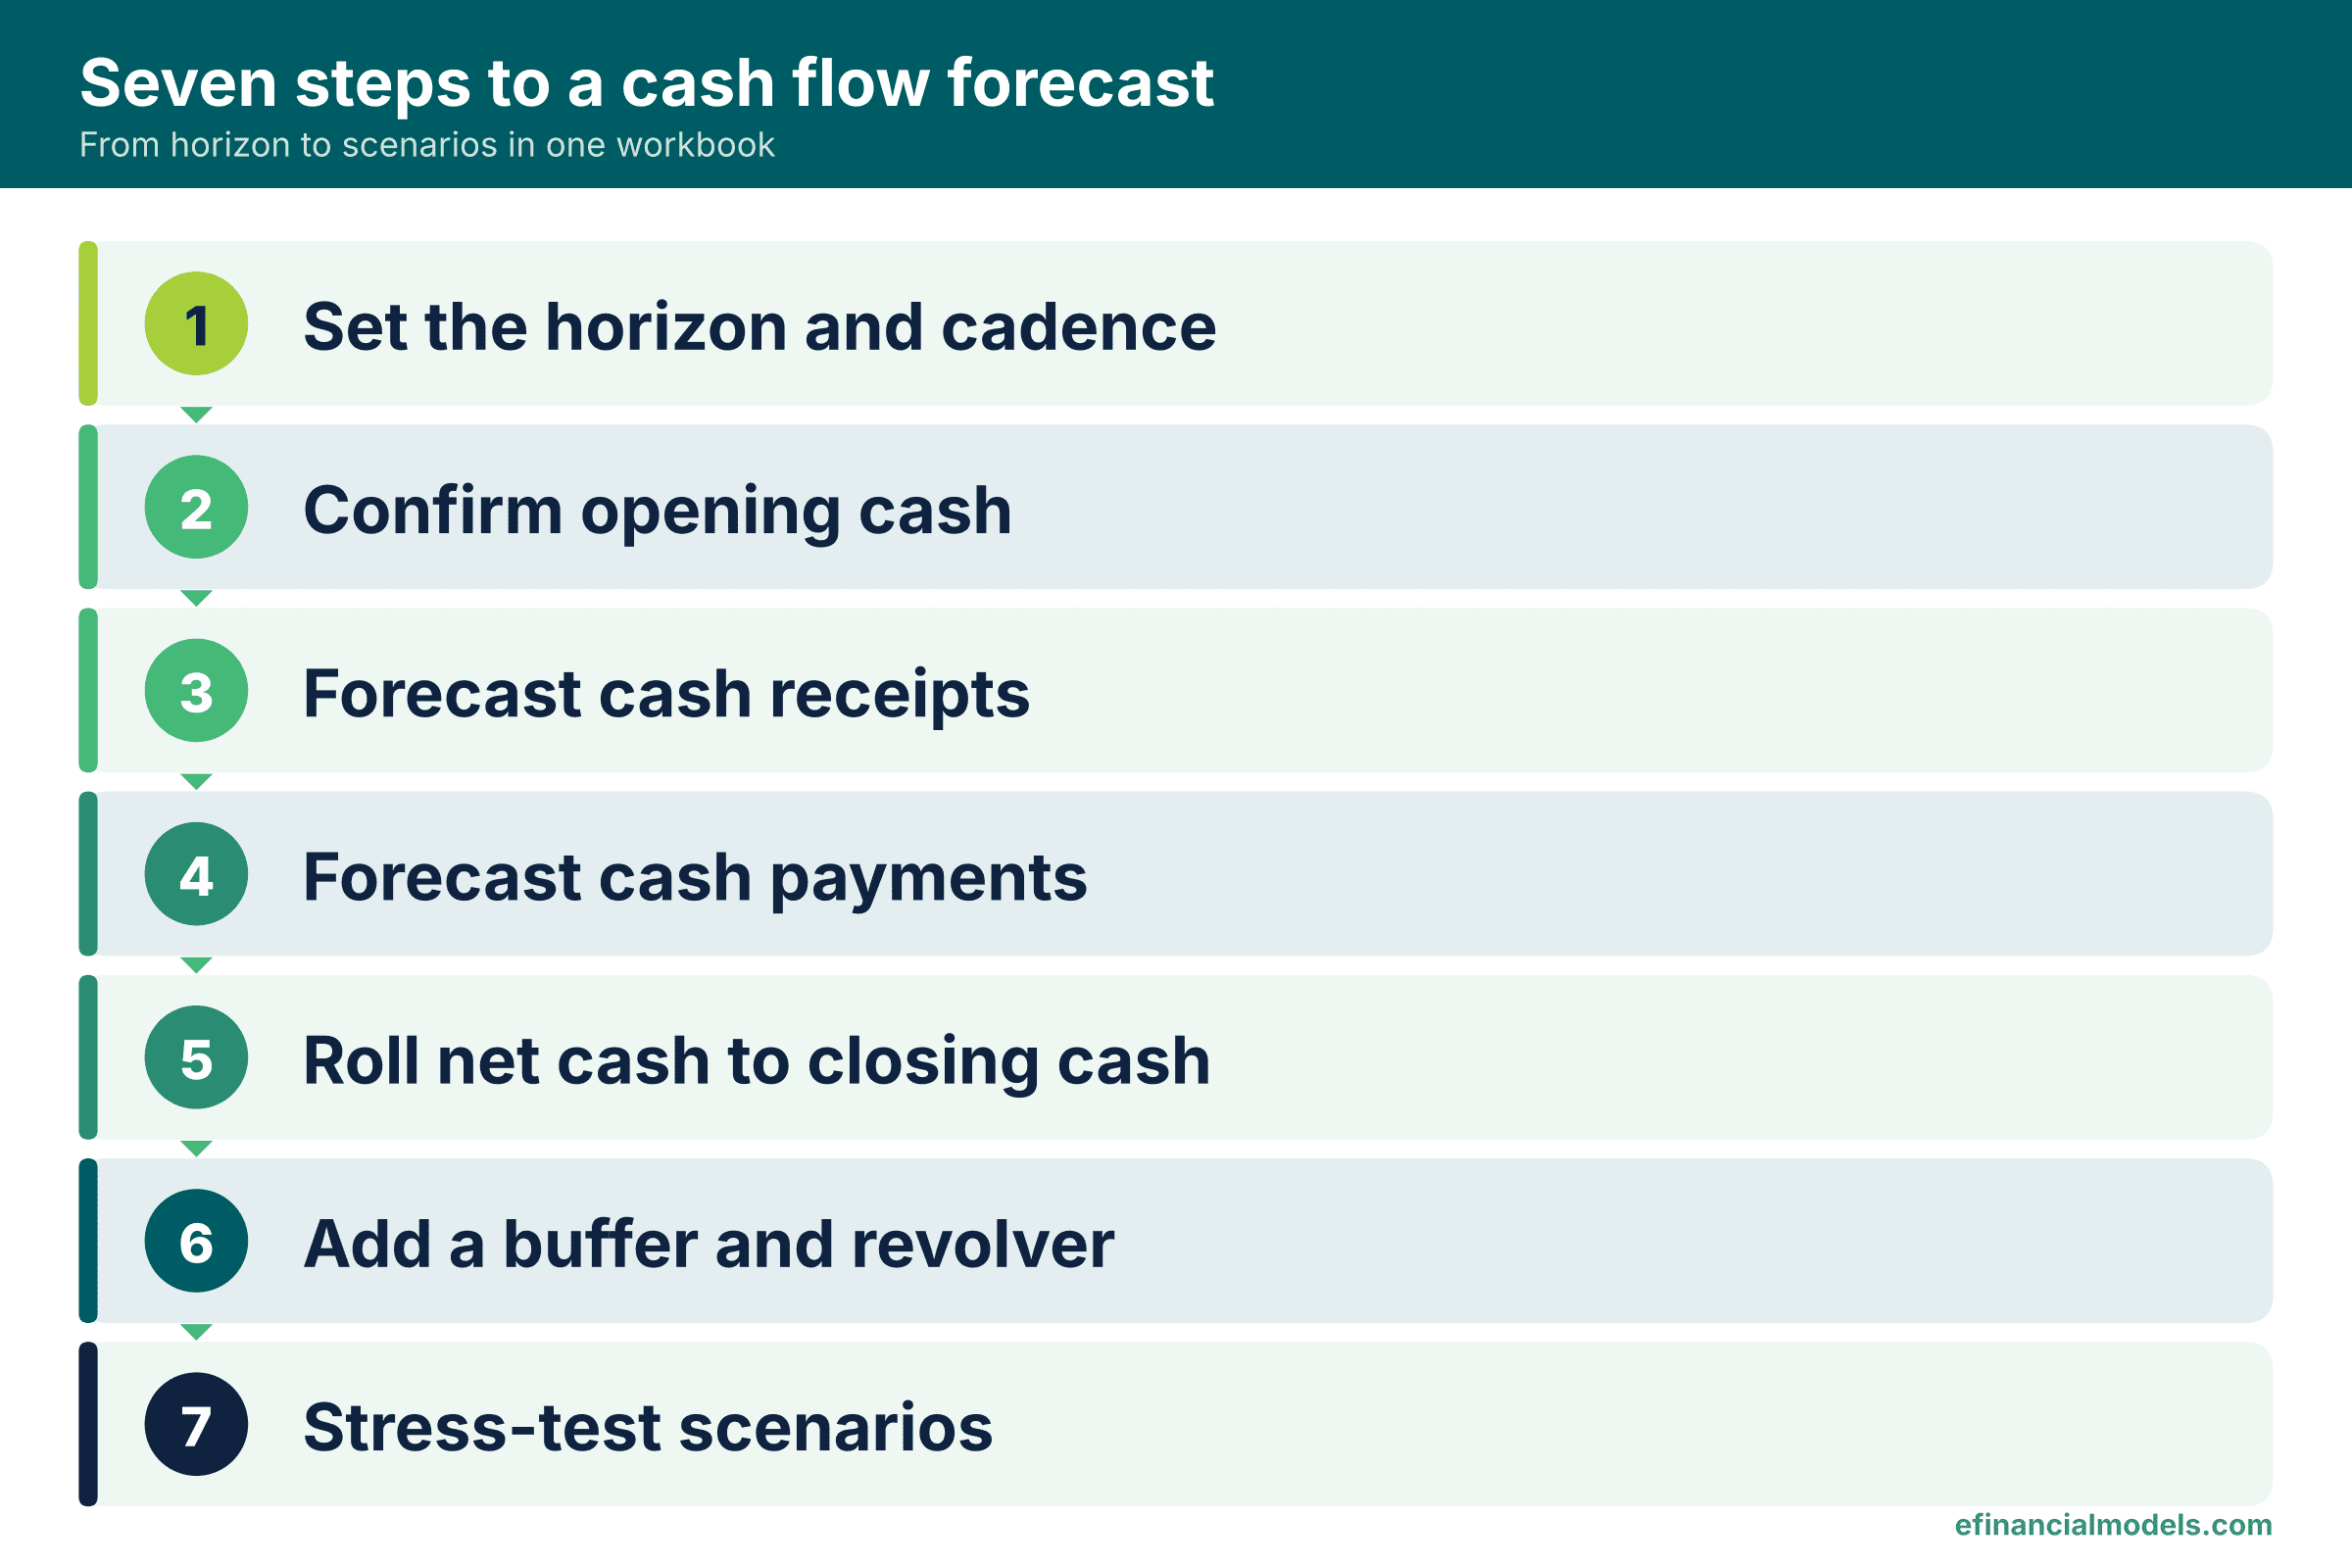
A cash flow forecast is built in seven steps: set the horizon, confirm opening cash, forecast receipts, forecast payments, roll net cash into closing cash, add a minimum cash buffer and a credit line, and stress-test the result. A 13-week weekly layout in Excel, with lagged collections and a few pre-set formulas, answers the question every CFO asks first: will cash cover the next quarter?
Key Takeaways
- Build the forecast in seven steps, from horizon and opening cash to receipts, payments, closing cash, a buffer and scenarios.
- Forecast cash receipts and payments by the week they move through the bank, not by the invoice date or the accounting period.
- Keep every assumption in one input sheet and let formulas carry the rest, so a changed collection lag updates all 13 weeks.
- A minimum cash buffer with an automatic revolver draw turns a cash shortfall into a visible, pre-planned funding action.
- In the worked example, the downside scenario needs only a short revolver draw, while the severe scenario borrows for several weeks.
A Cash Flow Forecast Projects Weekly Cash Receipts and Payments
A cash flow forecast estimates the cash a business will receive and pay each week, and the cash balance left after each week. It differs from a profit forecast because timing decides everything: a sale booked in week 1 may reach the bank in week 5.
Forecasting cash is hard even for specialists. The Association for Financial Professionals (AFP) found that cash and liquidity forecasting was the treasury challenge cited most often, by 49% of respondents (2026 AFP Treasury Benchmarking Survey Report).
The method used here is the direct method, which lists gross cash receipts and gross cash payments line by line. The International Accounting Standard (IAS) 7 describes it as disclosing “major classes of gross cash receipts and gross cash payments” (IAS 7 Statement of Cash Flows). For a short horizon, the direct method is the practical choice because every line ties to a bank movement.
Step 1: Set the Horizon and Cadence
Use 13 weeks, with one column per week, for near-term liquidity. A quarter-long weekly view is long enough to catch tax dates, payroll cycles and loan payments, and short enough to stay accurate. Derive each week-ending date from one start-date input.
“
Week ending = StartDate + 7 * WeekNumber - 1
Roll the forecast forward weekly: replace the finished week with actuals and add a new week 13.
Step 2: Confirm Opening Cash
Opening cash is the bank balance that week 1 starts from, taken from reconciled bank statements, not from the ledger. Week 1 reads the input cell, and every later week reads the closing cash of the week before.
`
Opening cash, week 1 = Opening cash input
Opening cash, week n = Closing cash, week n-1
If bank and ledger differ because of unpresented cheques or unposted receipts, reconcile first.
Step 3: Forecast Cash Receipts
Receipts follow collection timing, not invoice timing. Split each week's credit sales into the share collected after 4, 5 and 6 weeks, then add collections from invoices already issued before week 1.
`
Collections(t) = Pct4*Sales(t-4) + Pct5*Sales(t-5) + Pct6*Sales(t-6) + OpeningReceivables(t)
Pct4, Pct5 and Pct6 are input cells that must add to 100%, so keep a check cell for them. Assume, for illustration, 35%, 40% and 25%. Late payment is the reason to model the lag explicitly: Atradius reported that 47% of business-to-business invoices in Western Europe are still paid late (Atradius, 2025). Replace the percentages with the company's own history from the receivables ledger.
Step 4: Forecast Cash Payments
Payments follow due dates and contracts. Build one row for each major class: suppliers, payroll, rent, loan service, capital expenditure, tax and other operating costs. Place fixed payments in the weeks they fall due, using a flag row of 1 and 0 so one formula serves every column.
`
Payroll(t) = PayrollAmount * PayrollFlag(t)
Suppliers(t) = SupplierPct * Sales(t-3) + OpeningPayables(t)
Assume, for illustration, that SupplierPct is 48%, so supplier payments equal 48% of sales from three weeks earlier, plus payables already owed at the start of week 1. Total cash out is the sum of the rows, and an input for deferring a share of supplier payments by one week gives management a ready contingency lever.
Step 5: Roll Net Cash Into Closing Cash
Net cash flow is total cash in minus total cash out. Closing cash is opening cash plus net cash flow, plus any revolver draw or minus any repayment.
`
Net cash flow = Total cash in - Total cash out
Closing cash before revolver = Opening cash + Net cash flow
Profit and cash flow are different measures, so never paste an income statement figure into this block.
Step 6: Add a Minimum Cash Buffer and a Revolver
A minimum cash buffer is the lowest balance management accepts, and a revolver is a credit line that can be drawn and repaid repeatedly. When closing cash falls below the buffer, the model draws the shortfall up to the limit; when cash exceeds the buffer, it repays.
`
Draw = IF(Before < Buffer, MIN(Limit - Balance, Buffer - Before), -MIN(Balance, Before - Buffer))
Closing cash = Before + Draw
Here Before is closing cash before the revolver and Balance is the revolver balance brought forward.
This contingency matters because firms lean on credit for day-to-day needs. In the Federal Reserve Banks’ Small Business Credit Survey, meeting operating expenses was the most common reason US small employer firms sought financing, cited by 56% of the firms that sought financing (Federal Reserve Banks, Small Business Credit Survey: 2026 Report on Employer Firms). Add a flag that shows “breach” if cash stays below the buffer even after the limit is used.
Step 7: Stress-Test with Scenarios
Scenario analysis changes several inputs at once and compares the outcomes. Build a selector cell with a dropdown, and keep each scenario as two inputs: a sales change and the share of collections that slips by two weeks. Add a check cell that confirms collection percentages total 100%, that ending cash reconciles and that cash never goes negative.
The eFinancialModels cash flow projections tag groups related templates, and the wider General Excel Financial Models category holds further Excel structures for the same job.
Worked Example: A 13-Week Forecast for a Mid-Sized Manufacturer
In this example, a fictional manufacturer starts week 1 with a reconciled bank balance of USD 850,000, a USD 800,000 minimum buffer and a USD 500,000 revolver. Week-1 credit sales are USD 420,000, growing 1% a week. Payroll of USD 160,000 is paid every second week, rent of USD 45,000 falls in weeks 1, 5, 9 and 13, and a USD 120,000 capital purchase falls in week 8. Other operating costs are USD 22,000 a week, loan service is USD 38,000 in weeks 4, 8 and 12, tax of USD 70,000 falls in week 10, and opening receivables of USD 330,000, 360,000, 390,000, 300,000, 150,000 and 60,000 fall in weeks 1 to 6, with opening payables of USD 205,000 in each of weeks 1 to 3. Revolver interest is excluded for simplicity.
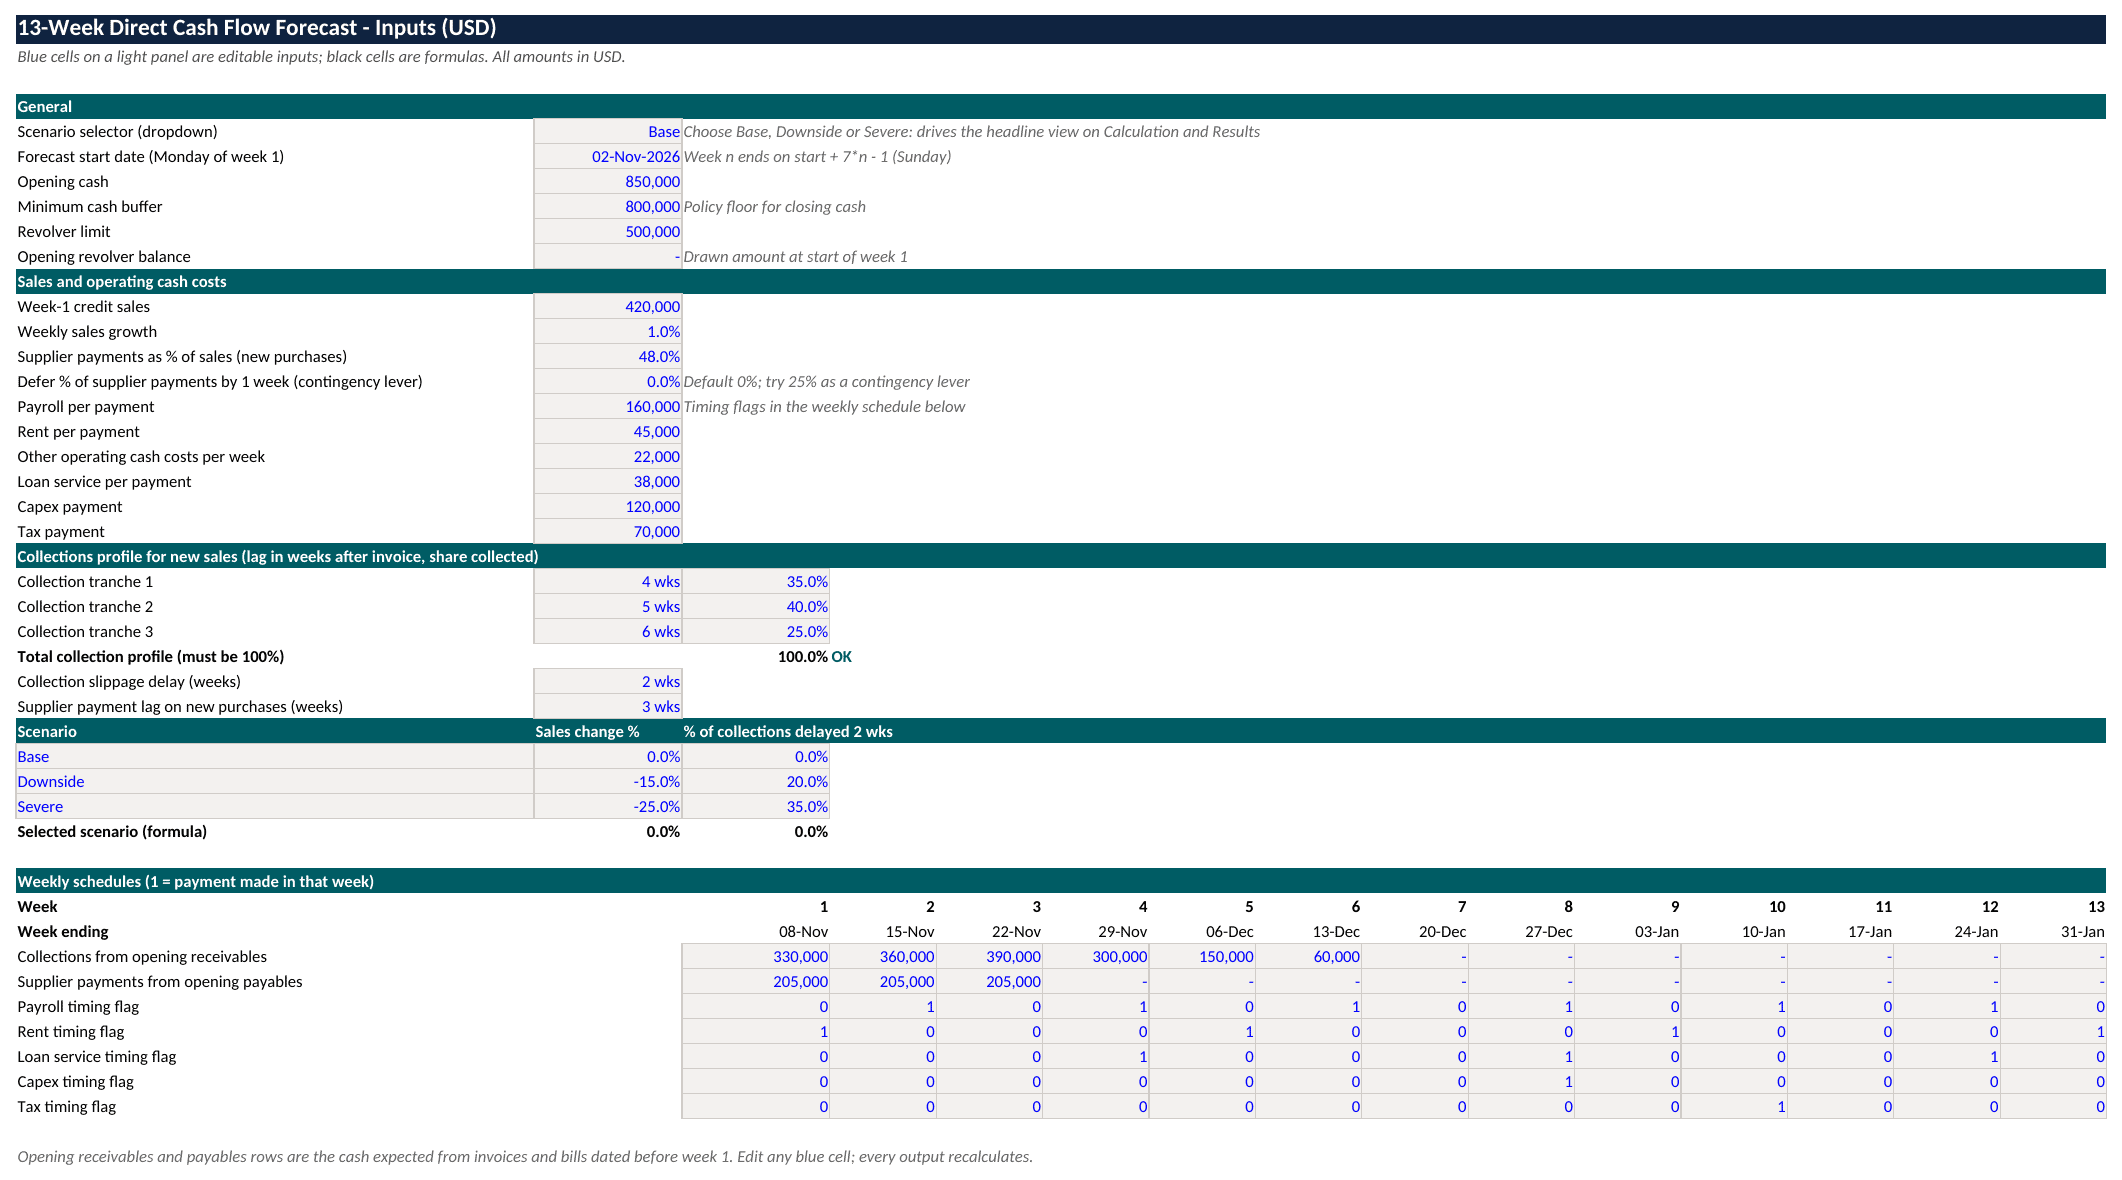
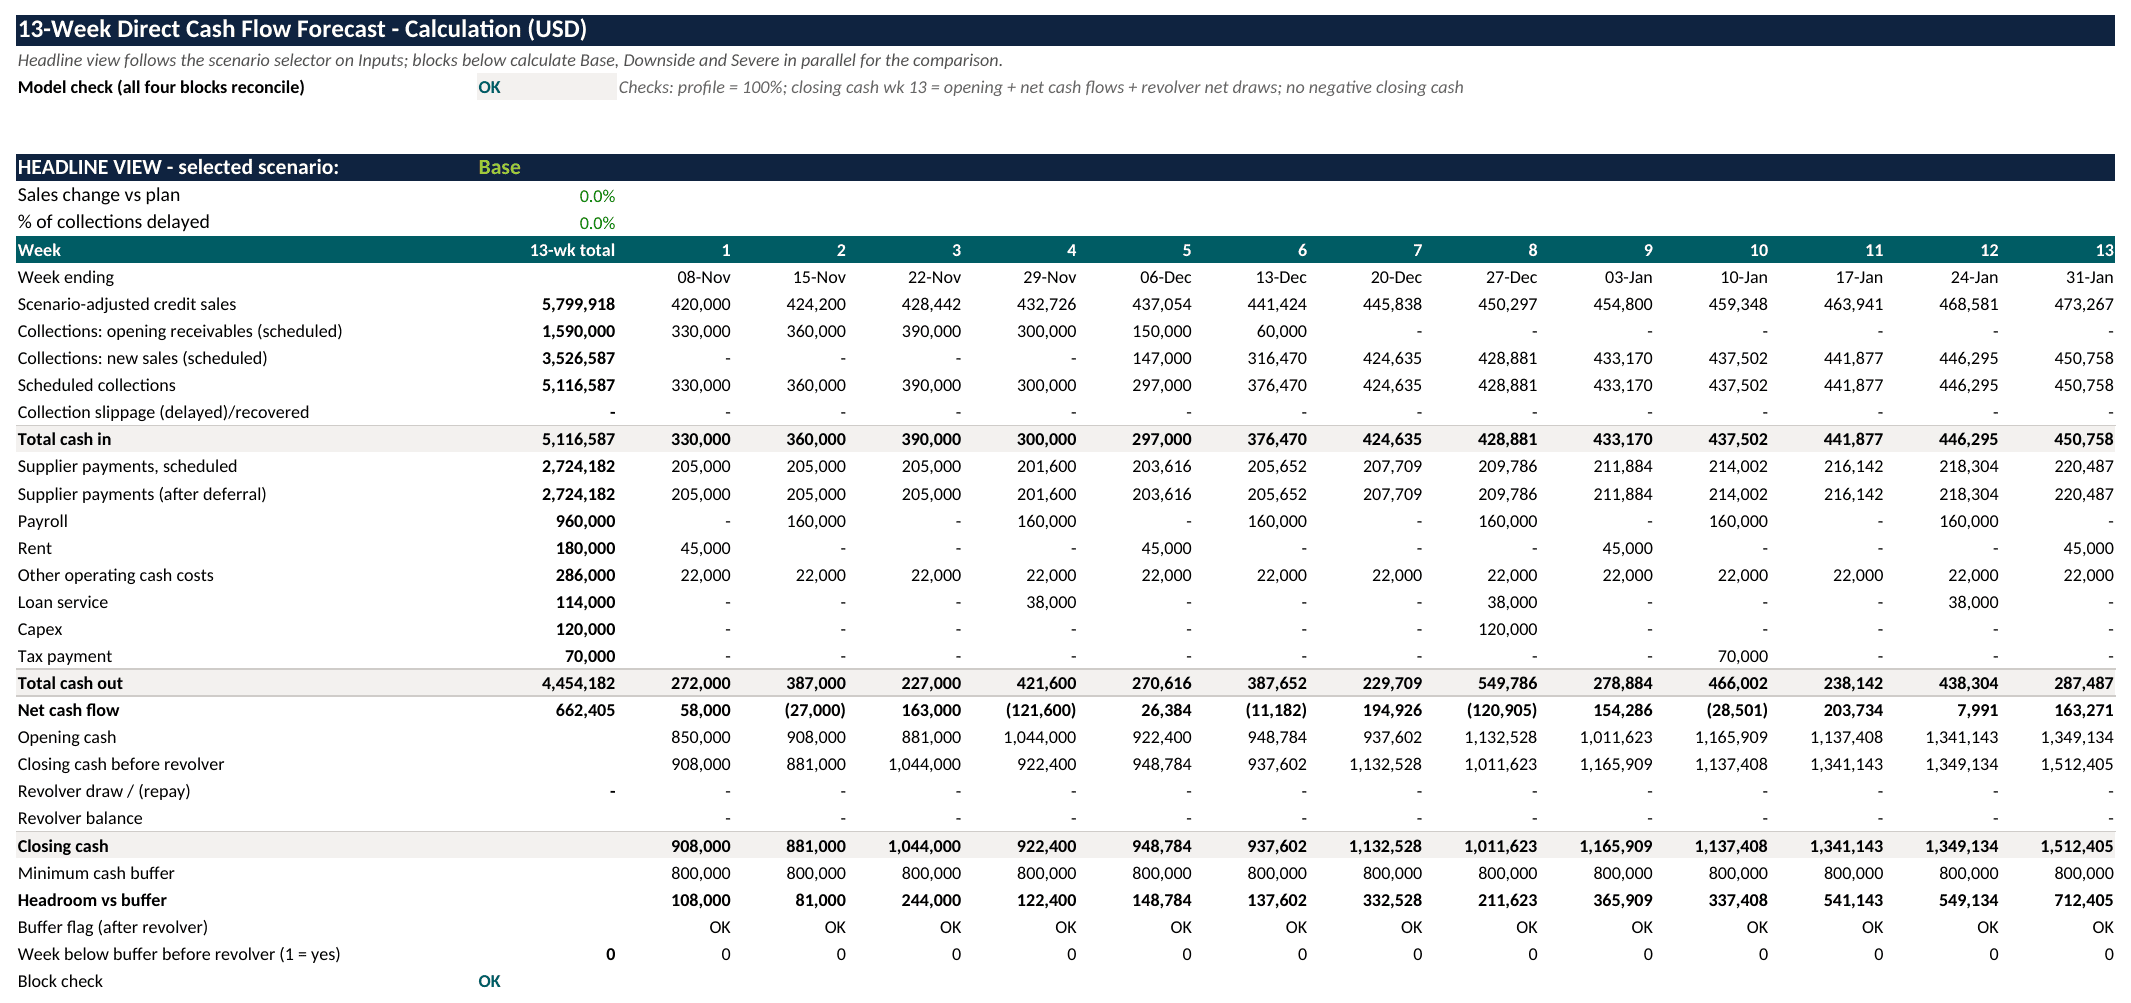
The calculation sheet applies the formulas above across 13 columns, with a parallel block for each scenario.
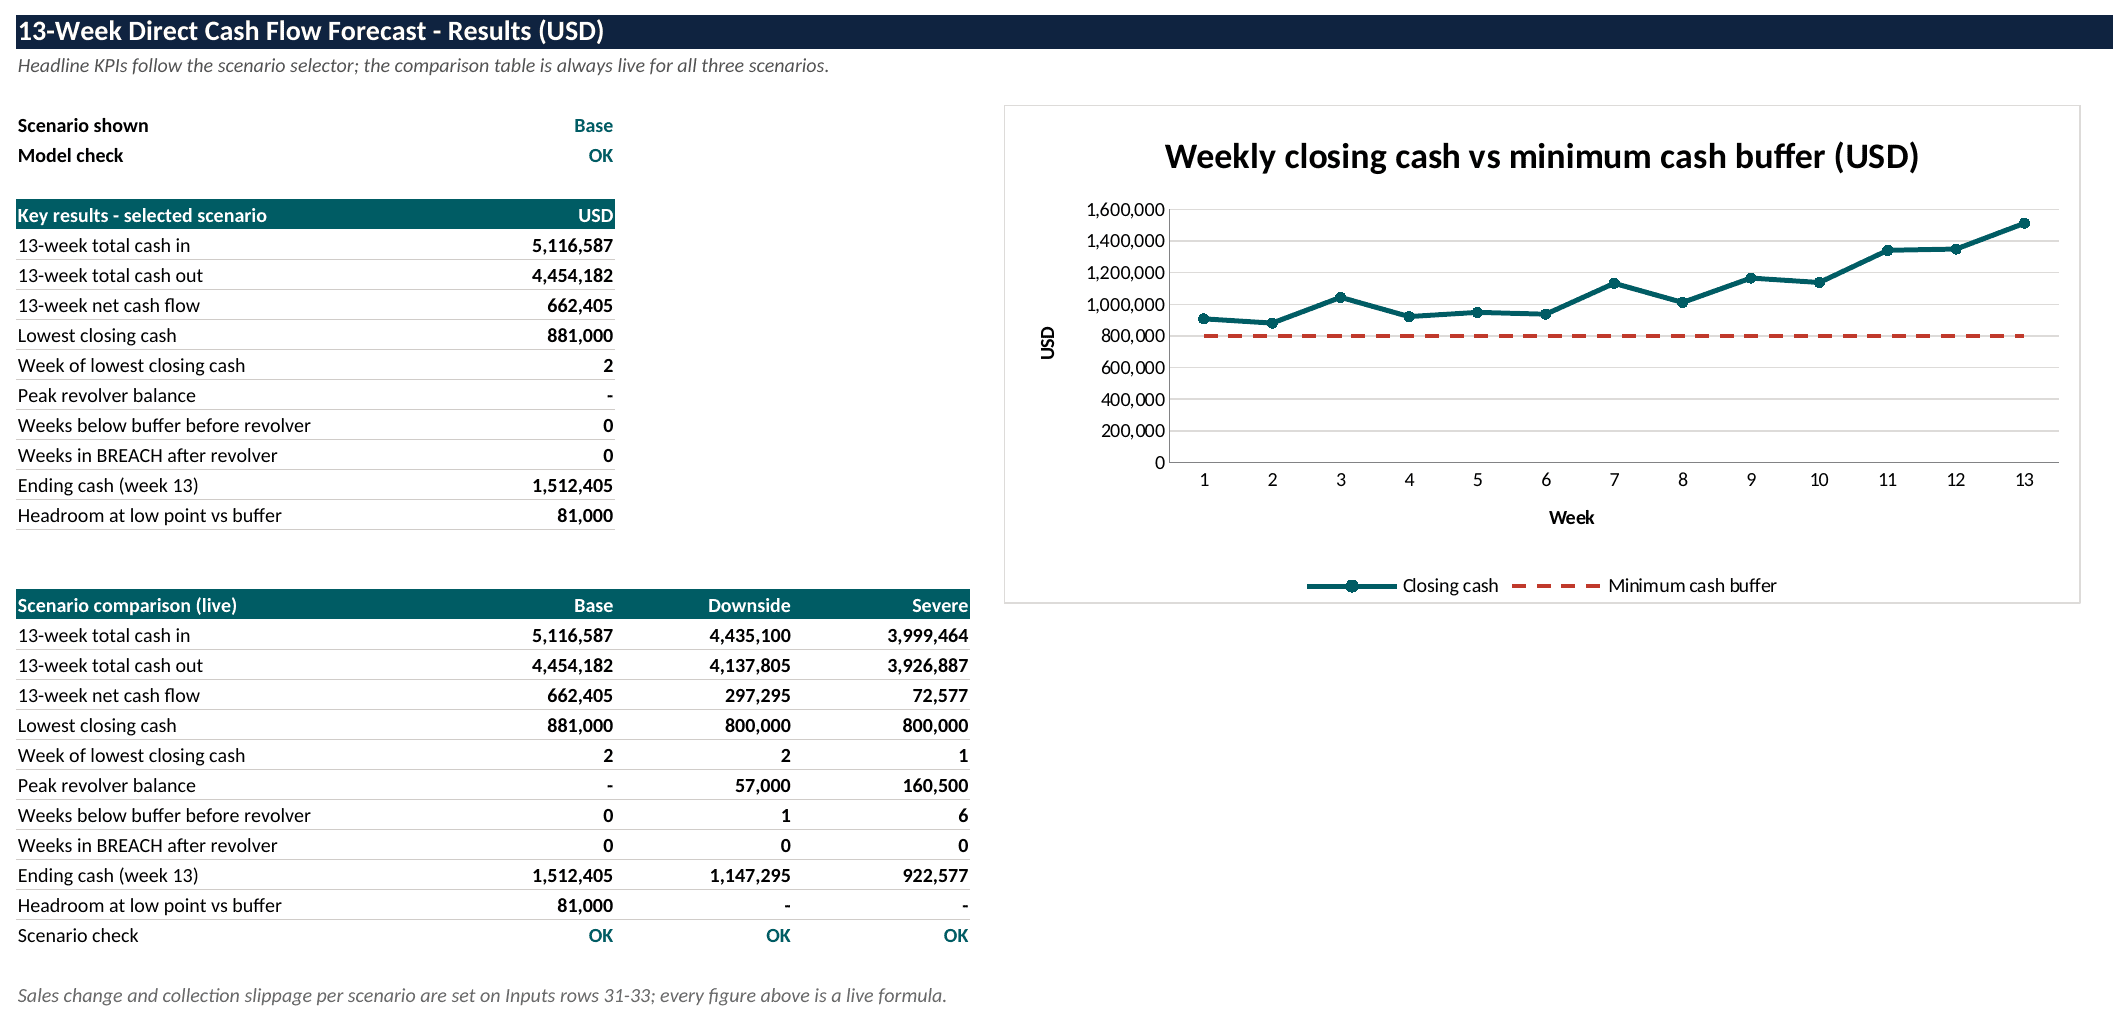
The results sheet compares the three scenarios side by side, and the model check reads OK for all of them.
| Scenario | Total receipts (USD) | Net cash flow (USD) | Peak revolver (USD) | Weeks below buffer before revolver | Ending cash (USD) |
|---|---|---|---|---|---|
| Base | 5,116,587 | 662,405 | 0 | 0 | 1,512,405 |
| Downside (sales -15%, 20% of collections two weeks late) | 4,435,100 | 297,295 | 57,000 | 1 | 1,147,295 |
| Severe (sales -25%, 35% of collections two weeks late) | 3,999,464 | 72,577 | 160,500 | 6 | 922,577 |
The base case never touches the revolver, and its lowest closing cash is USD 881,000 in week 2. The downside case draws USD 57,000 in week 2 and repays it in week 3. The severe case peaks at USD 160,500 drawn in week 2 and is repaid by week 11. Net cash flow excludes revolver draws and repayments, and every revolver balance is repaid by week 13, so ending cash equals the opening balance plus net cash flow, and the opening balance in each scenario is USD 850,000: 850,000 + 662,405 = 1,512,405 in the base case, 850,000 + 297,295 = 1,147,295 in the downside case and 850,000 + 72,577 = 922,577 in the severe case.
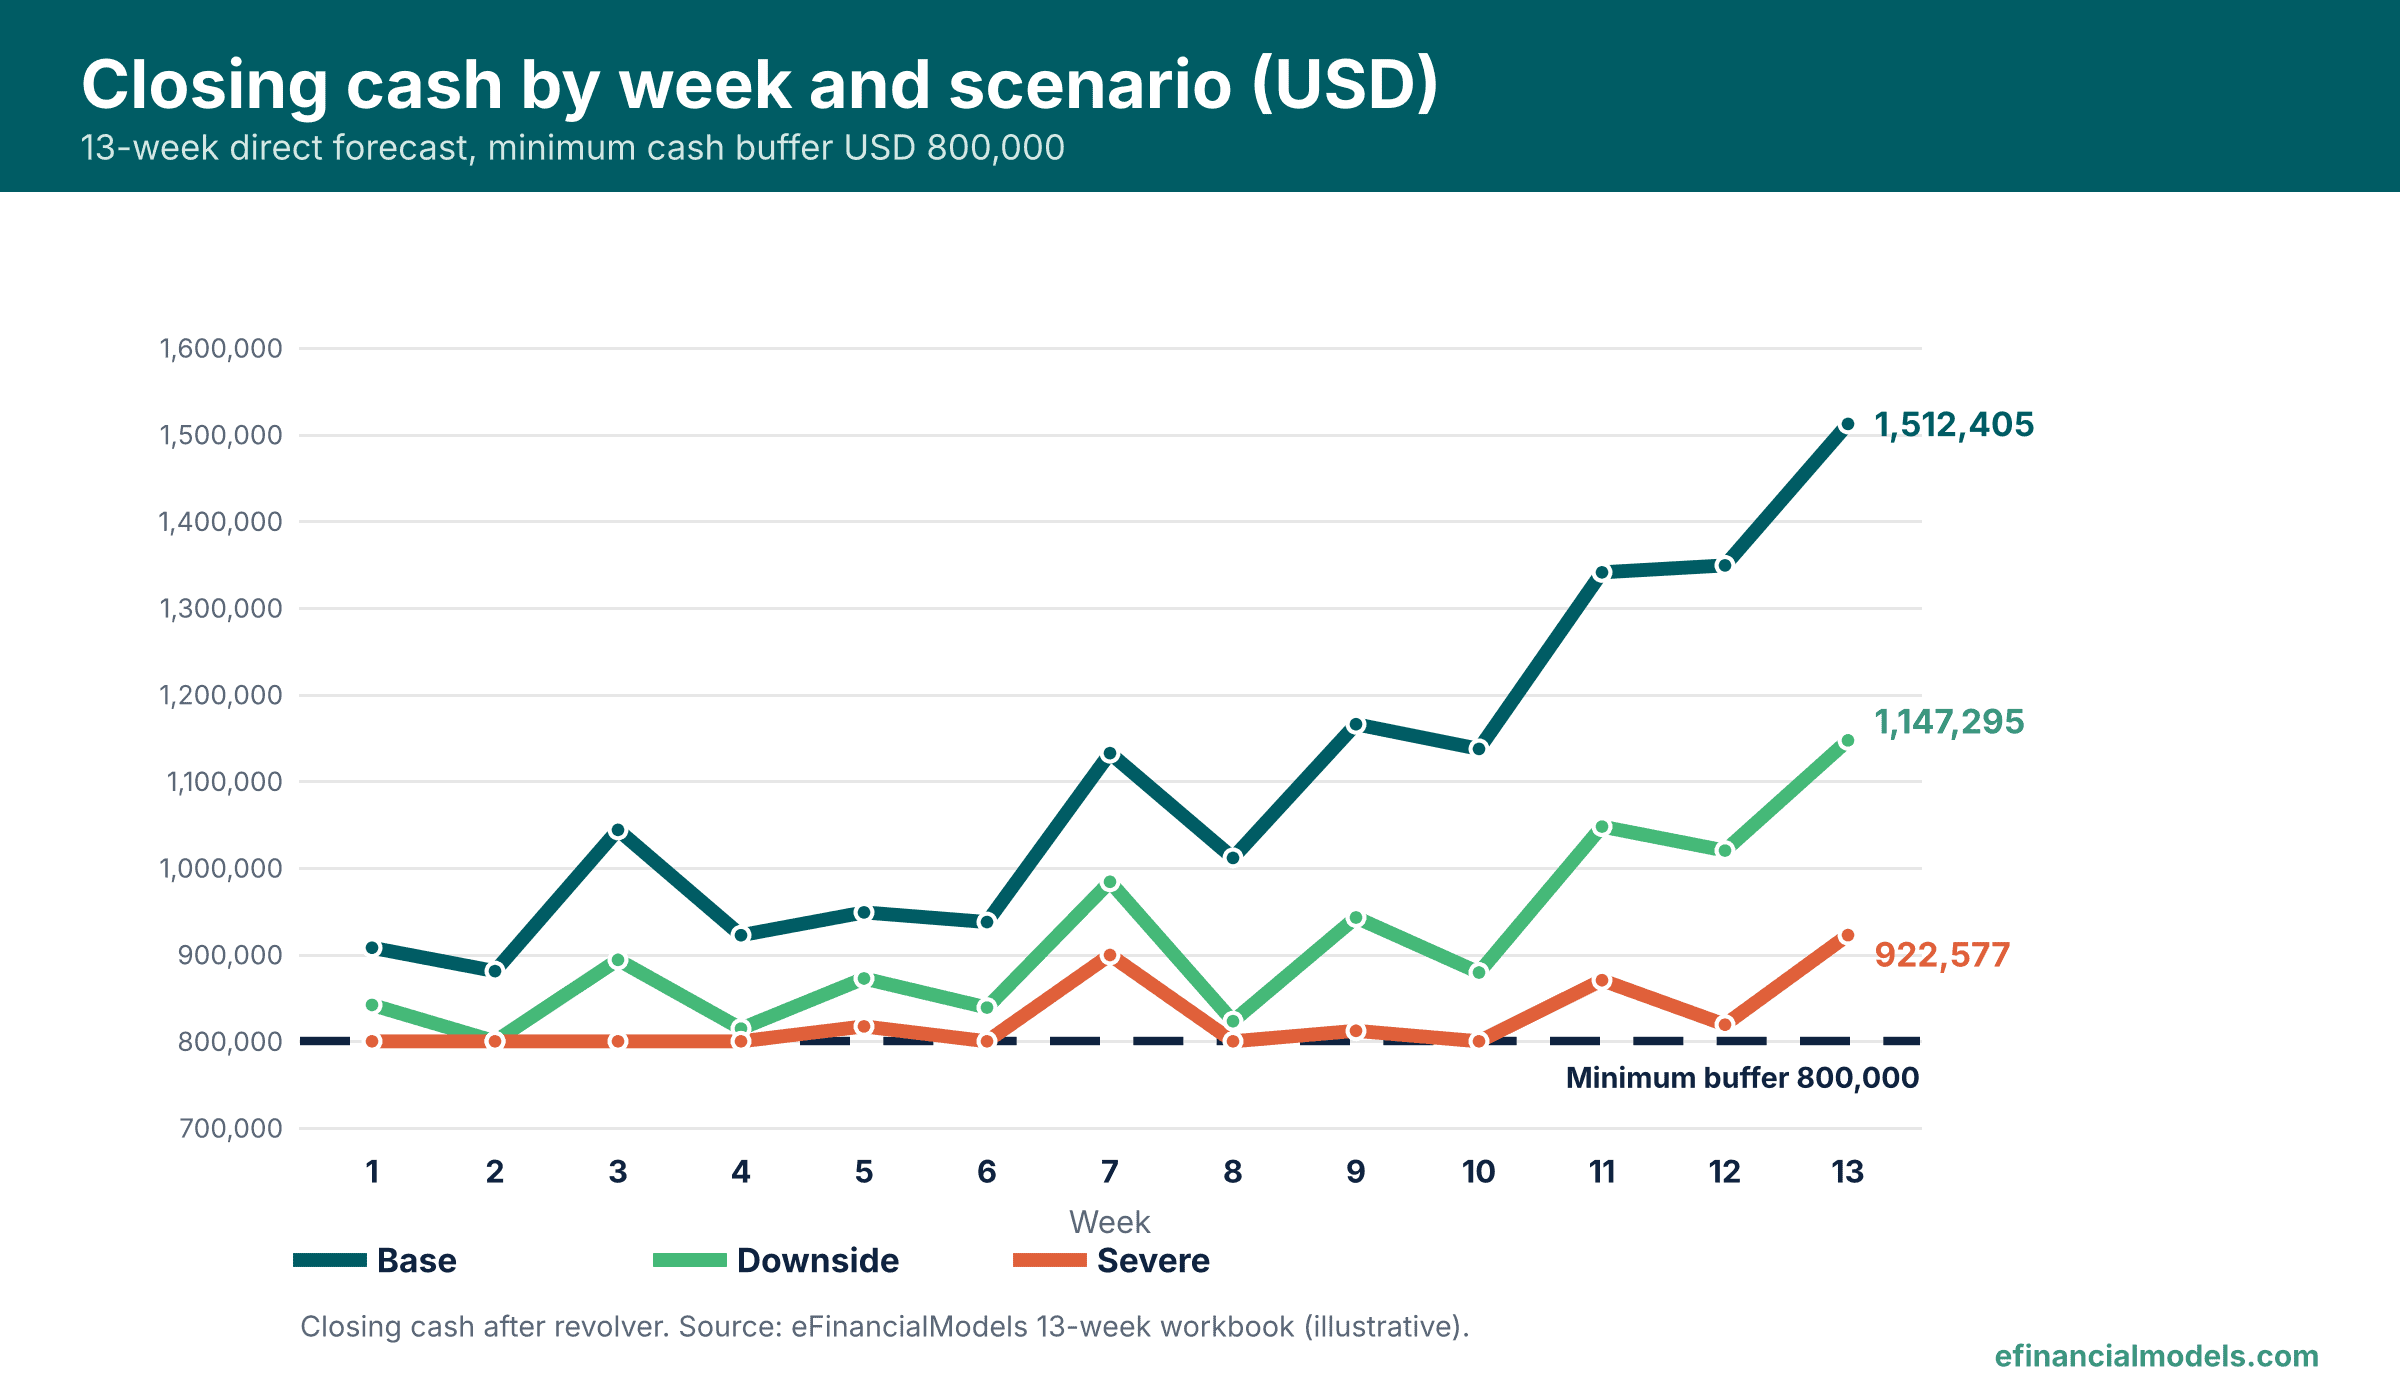
The USD 500,000 limit is never reached, so no scenario breaches the buffer after borrowing. The real risk for a CFO is the severe case, which falls below the buffer before the revolver in six of the 13 weeks and signals that the credit line should be confirmed before week 1.
Avoid Two Cash Forecast Mistakes
- Mixing profit with cash. Revenue, depreciation and accruals do not move cash on the booking date, so keep only bank movements.
- Never comparing to actuals. Record actual cash beside the forecast and adjust the lags if gaps repeat.
Frequently Asked Questions
How far ahead should a cash flow forecast look?
Most finance teams run two layers. A weekly view covers 13 weeks for liquidity decisions such as payroll funding and supplier timing, while a monthly view stretches to 12 months or more for covenant tests, capital planning and budget alignment. Link them by letting the first month of the long view equal the sum of the first four or five weeks.
What is the difference between the direct and indirect method for forecasting?
The indirect method starts from profit and adjusts for non-cash items and balance sheet movements, which suits annual statements and long-range models. The direct method lists receipts and payments, so it suits weekly liquidity control. Many companies use both and reconcile them at month end. A gap between the two views usually points to a wrong timing assumption or an accrual never turned into a payment date.
How often should the forecast be updated and who owns it?
Update it weekly, on a fixed day after bank balances are final. The controller usually owns the model, while sales, procurement and payroll owners supply the inputs for their own lines. Record forecast versus actual cash for each line and carry the variance into the next review. Repeated misses on one line, such as customer receipts, signal that the lag percentages need re-estimating.
Can a spreadsheet handle this, or is dedicated software needed?
A spreadsheet is enough for one entity, a few bank accounts and a 13-week view, provided inputs, calculations and results sit on separate sheets and a check cell guards the totals. Software becomes useful when many entities, currencies or bank feeds make manual updates slow. Even then, the logic of lags, buffers and scenarios stays the same, so a clean spreadsheet prototype remains a useful specification for the vendor.
Conclusion
A cash flow forecast works when weekly receipts, payments, a buffer and scenarios sit in one model driven by a small set of inputs. Finance teams that need a horizon longer than 13 weeks can use the eFinancialModels Free Three Statement Financial Model, a free five-year Excel template for projecting a business’s future financial health.