Sales Pipeline Template
Sales Pipeline Template. Sound financial tracking begins with the accurate recording of sales. The Daily Sales Report (DSR) is the core tracking element for controlling cash, sales performance, and forecasting future sales.
| All Industries, General Excel Financial Models |
| Dashboard, Excel, Sales Pipeline, Sales Tracking, Tracking |
NOTE: Single-User pertains to a limited Single User License where the template can only be used by one single user; while Multi-User is a license for users sharing the template with up to 20 members. Please refer to Terms of Use and License and Permitted Use for clarification.
A Sales Pipeline Template is a management tool used by businesses, sales reps, and managers in order to extract the most relevant daily sales data such as the number of closed deals, client conversations, opportunities created, and many other sales-related KPIs.
When it comes to daily reports, you don’t want to get too focused on outcome-dependent metrics. Instead, you want to focus more on process metrics.
Sales Pipeline Template Key Features
– Effectively track the performance of our sales team.
– Simple solution to manage and visualize sales performance
– Monitor sales progress daily to increase productivity
– Follow your team’s sales performance
– Greater employee involvement and motivation
–
Sales Pipeline Template available visualizations
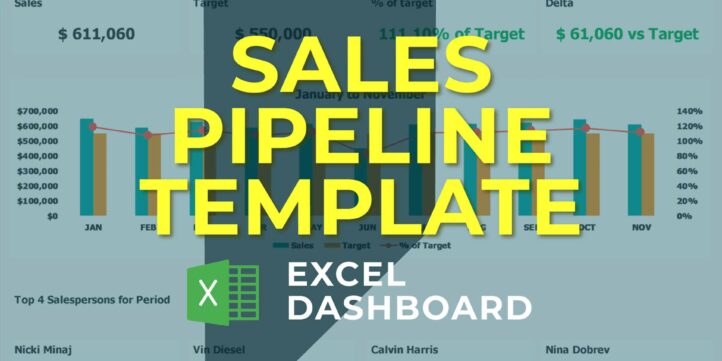
Sales Control | Here you will post all the sales information, from the products or services sold, to which customers, values, negotiation status, and other data will form the reports and dashboards automatically.
Information Registration | Area to record the products or services sold by your company, to record your customers (and their information), which sales channels you use, forms of payment, and the segmentation of customer information (CRM).
Sales Goals | You will be able to set overall sales goals for your business, as well as specific targets for each sales channel.
Sales Reports | Here you will find a general report with the most comprehensive results of your sales (values sold, comparison with goals, etc.), you will have a second report, specific to the analysis of sales channels and a third one to visualize the participation of customers in your general income.
Sales Control Dashboards | The dashboards show you the key sales and charting control indicators that make analysis and decisions easier.
Similar Products
Other customers were also interested in...
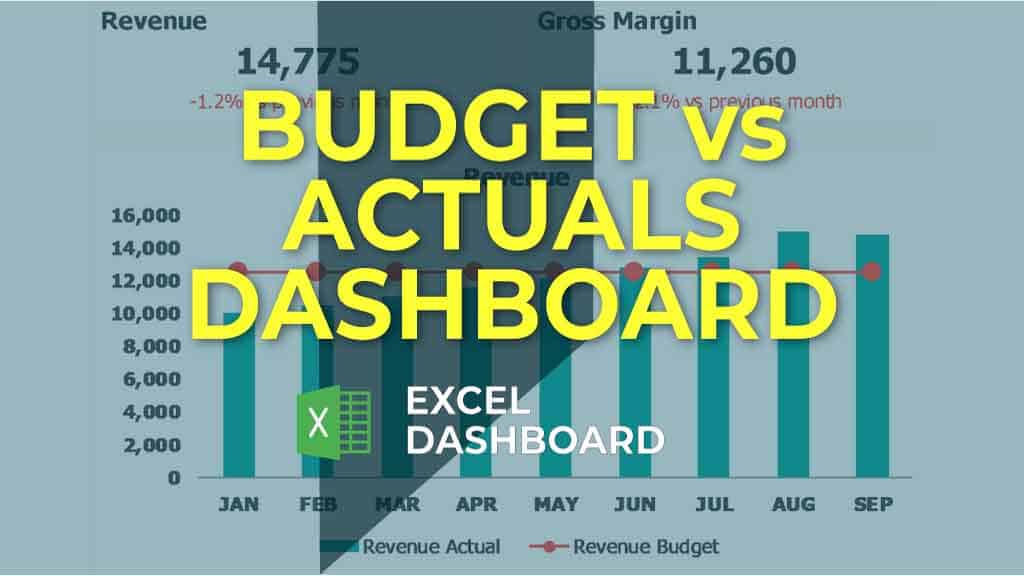
Budget vs Actual Excel Template
Create your very own budget vs actual analysis by trying out this Budget vs Actual Analysis Excel Te... Read more
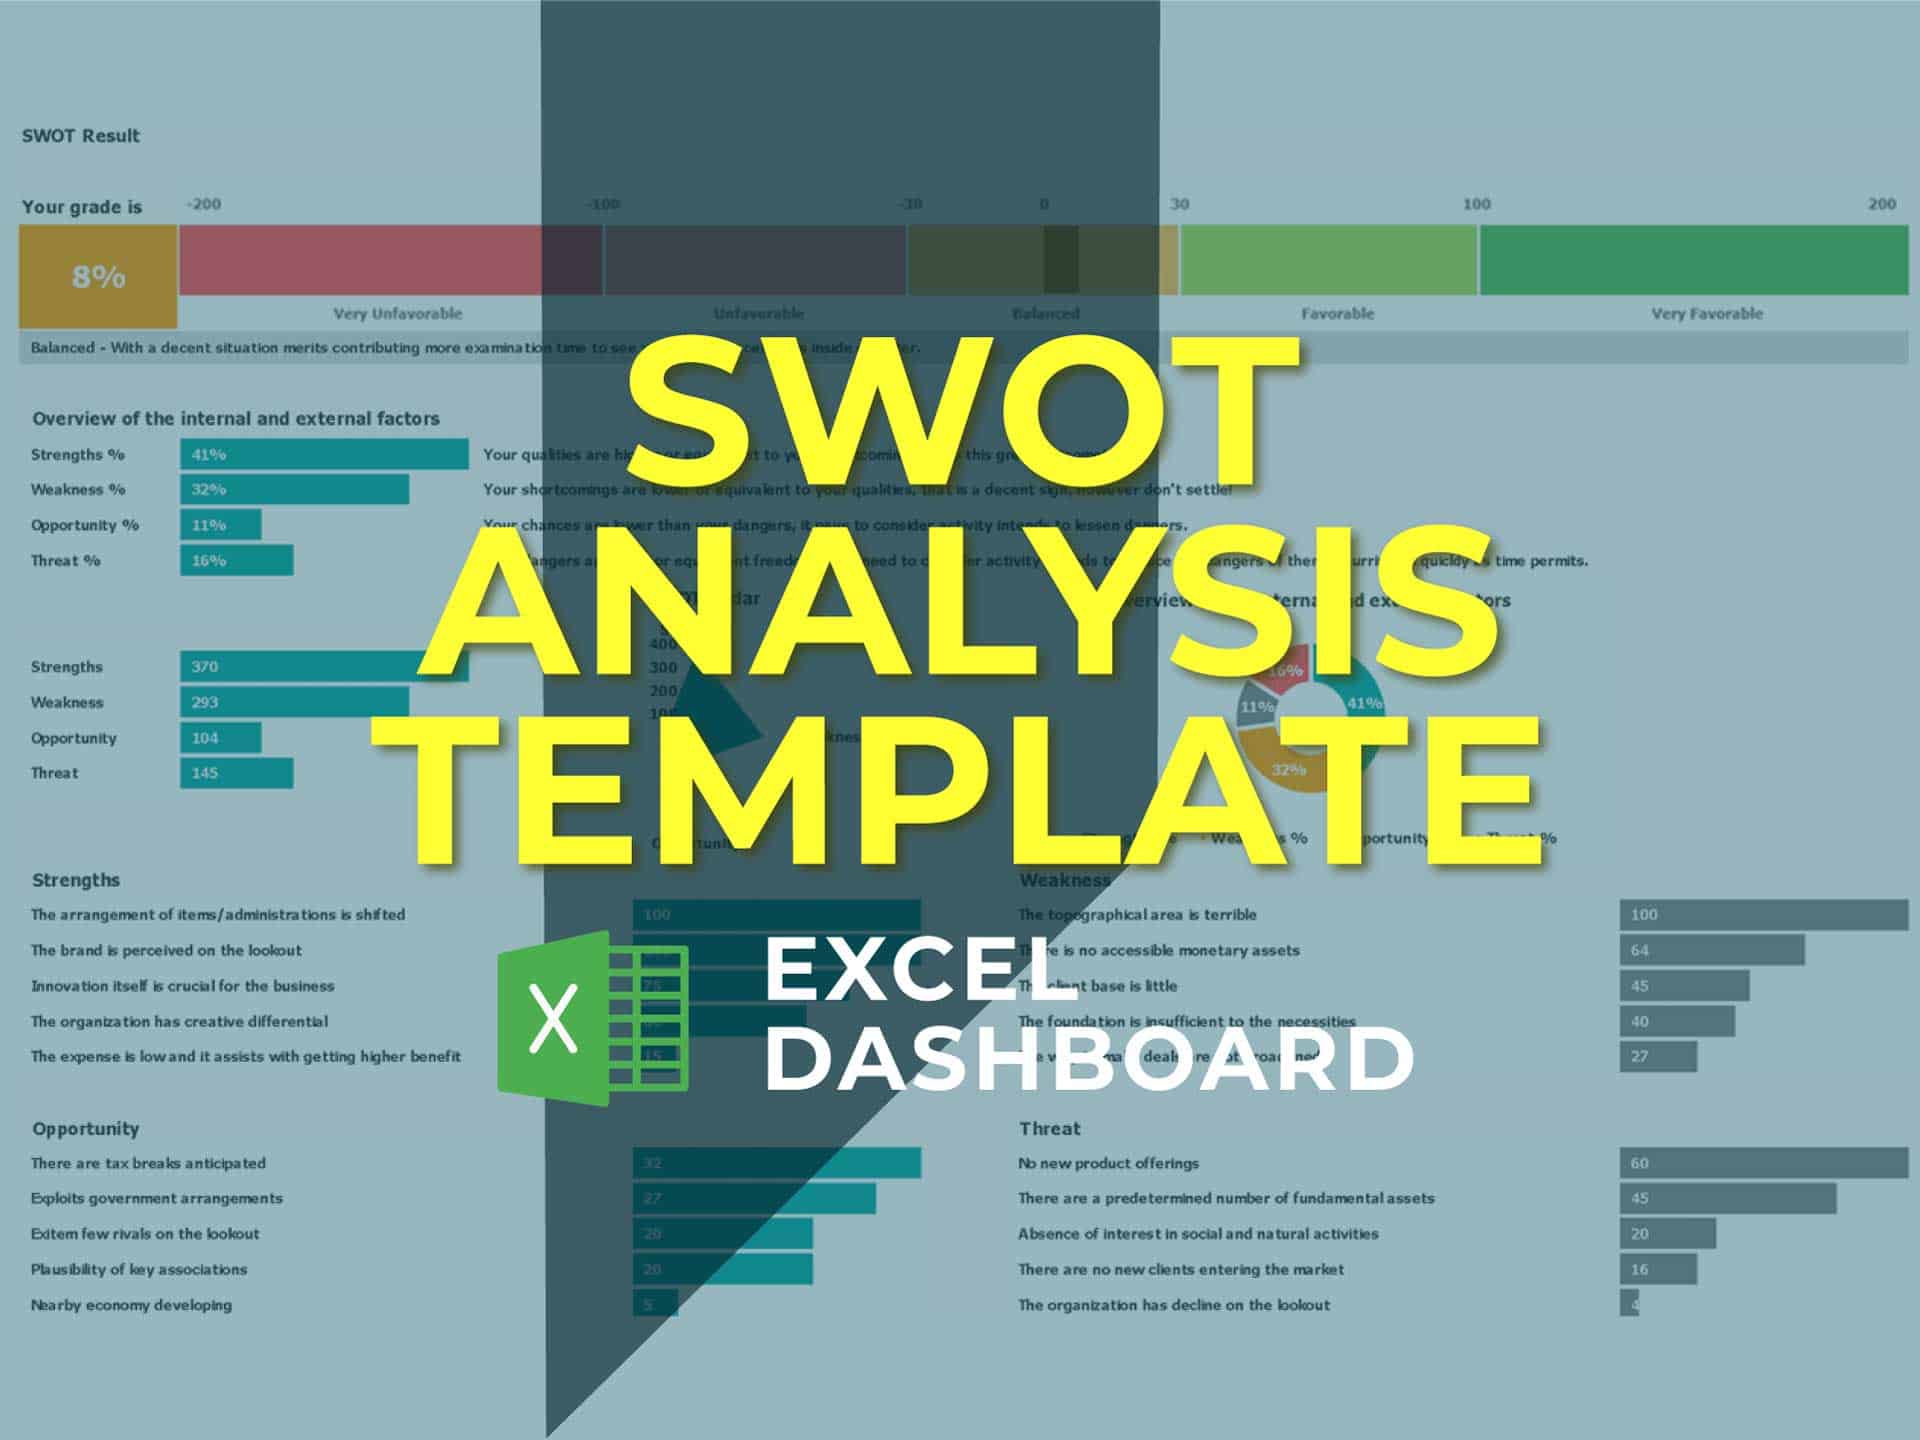
SWOT Analysis Template
NOTE: Single-User pertains to a limited Single User License where the template can only b... Read more
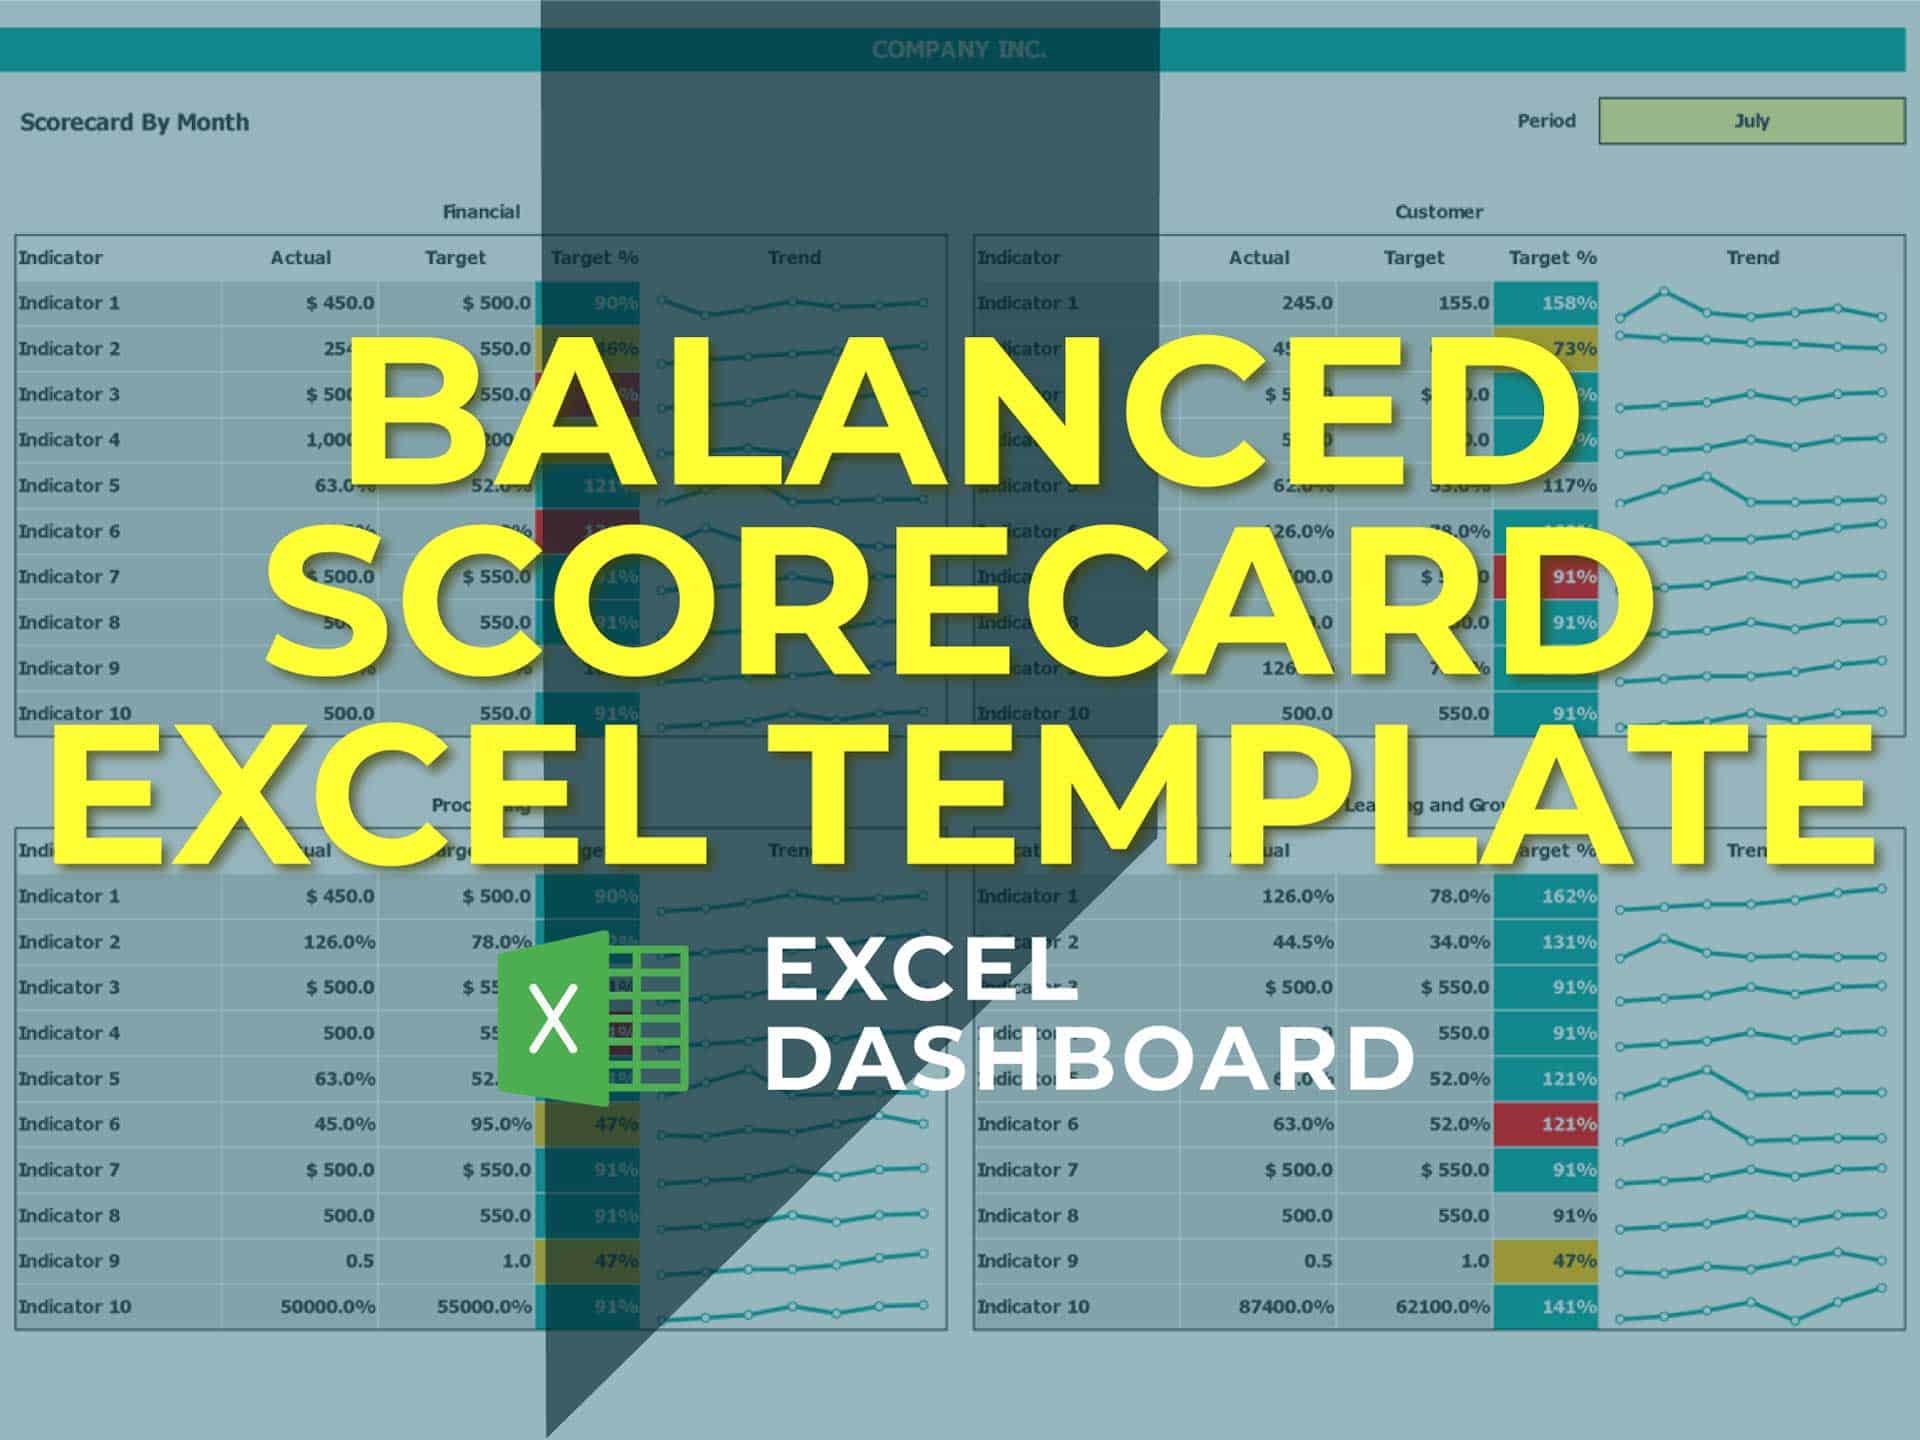
Balanced Scorecard Template Excel
NOTE: Single-User pertains to a limited Single User License where the template can only b... Read more
OKR (Objective – Key Results) Template
Get started with Objectives & Key Results with our OKR Template along with a short guide on how ... Read more
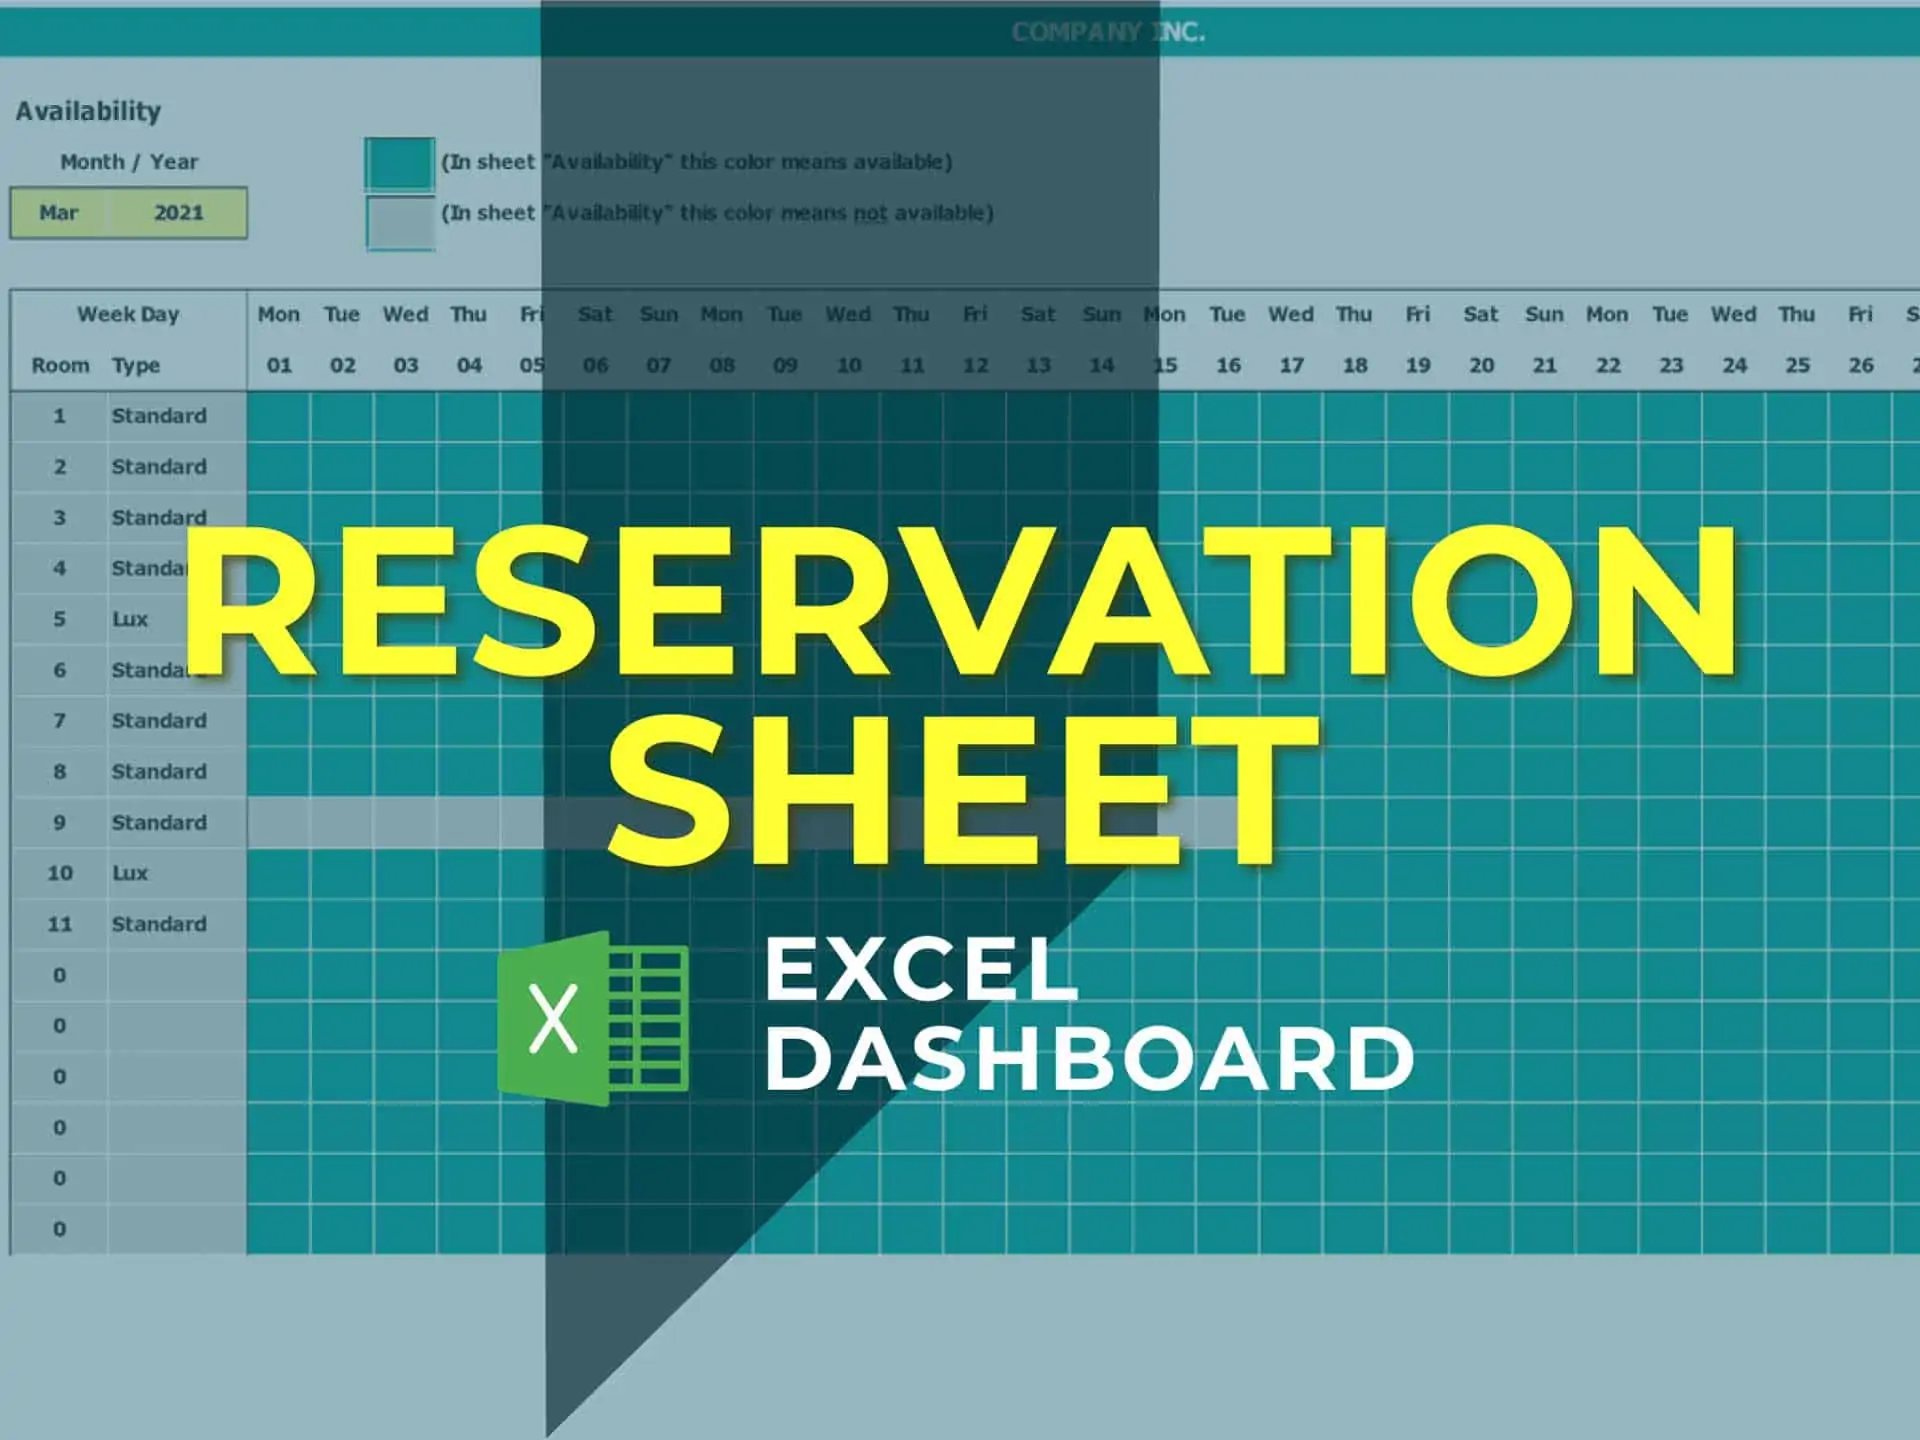
Reservations Sheet Template
A Reservations Sheet provides a quick and easy way to keep track of guests. Download the Reservation... Read more
BCG Matrix Template
BCG matrix template to identify which product units you should invest in and prioritize. Try this BC... Read more
Amortization Schedule Excel Template
Download an Amortization Schedule Excel to create your own amortization schedule, table, or calculat... Read more
Financial Model Excel Template to fight COVID-19
The coronavirus has turned many small and big companies upside down. The decrease in sales, problems... Read more
Inventory Control Software Financial Model Excel T...
Try Inventory Control Software Financial Plan. Solid package of print-ready reports: P&L and Cas... Read more
Business Valuation Expert Financial Model Excel Te...
Get Business Valuation Expert Financial Plan. Includes inputs, outputs and charts to present it in a... Read more
You must log in to submit a review.


