
0 ITEMS

Retail Development REFM Financial Model Excel Template
The Retail Development Financial Model Financial Model Template helps users evaluate the financial feasibility of a retail real estate development project with a structured, ready-to-use forecasting tool. Instead of building a complex model from scratch, buyers can enter project-specific assumptions for rental income, lease-up timing, property development costs, operating expenses, payroll, financing, and exit expectations, then review the impact across revenue, cash flow, profitability, and investor returns. It is designed to support planning for shopping centers, retail plazas, mixed-use retail assets, and multi-property development portfolios. This template is built for entrepreneurs, developers, business owners, consultants, analysts, and founders preparing business plans, investor presentations, lender packages, or internal feasibility studies. It gives users a practical way to organize financial planning assumptions, estimate startup costs and development capital needs, model operating expenses, forecast payroll and overhead, and understand how long the project may take to stabilize. Because retail development often requires significant upfront investment before meaningful rental income begins, the model helps users identify funding gaps, assess liquidity needs, and communicate the project timeline more clearly. The model connects key assumptions with automated financial outputs, including revenue projections, profit and loss summaries, cash flow forecasts, balance sheet views, return metrics, and break-even analysis. Users can test different scenarios, compare outcomes, and evaluate how changes in lease-up pace, rent levels, construction costs, financing terms, or operating expenses affect overall performance. This makes the template useful not only for launch planning, but also for expansion decisions, refinancing discussions, stakeholder reporting, and long-term portfolio strategy. With editable inputs, professional formatting, visual dashboards, and compatibility with Excel and Google Sheets, the Retail Development Financial Model Financial Model Template is made for practical decision-making. It helps users move from assumptions to numbers, from numbers to insights, and from insights to better planning. Whether the goal is to secure funding, refine a development budget, evaluate profitability, or present a credible retail property investment case, this template provides a clear financial framework for understanding the risks, requirements, and potential returns of the project.


Financial Model Overview
The Retail Development Financial Model Financial Model Template gives developers, entrepreneurs, consultants, analysts, and business owners a structured way to evaluate the economics of a retail property development project before major capital is committed. Retail development is different from many operating businesses because revenue may arrive gradually through lease-up while acquisition, construction, corporate overhead, financing, and operating costs appear much earlier.
This template helps organize those moving parts into a clear five-year forecast that can be used for feasibility planning, funding discussions, lender review, investor presentations, and internal decision-making. Users can enter project-specific assumptions, adjust rental income drivers, model property-level costs, forecast cash flow, review profitability, and assess returns through a professional model that is editable and ready to use in Excel or Google Sheets.
All-in-One Dashboard
The all-in-one dashboard brings the core inputs and core outputs of the Retail Development Financial Model into one practical summary view. It is designed to help users quickly understand the project’s most important financial assumptions and results without digging through every worksheet. Inputs may include development timing, rental assumptions, operating cost assumptions, financing terms, property count, lease-up timing, and investment requirements, while outputs may include revenue, EBITDA, cash balance, profit and loss summaries, payback period, break-even timing, IRR, ROE, and other return indicators.
This component is especially useful for founders, developers, and advisors who need to review the project at a high level before going into detail. It helps users spot whether the retail development plan is financially viable, whether projected cash reserves are sufficient, and whether the investment case is strong enough to support a funding conversation. Because the dashboard connects assumptions with calculated results, it also supports faster decision-making when testing different versions of the development plan.
Low, Base, and High Scenario Analysis
The low, base, and high scenario analysis section allows users to compare how the retail development project performs under different operating and market conditions. A base case can represent the most realistic expected outcome, while a low case can reflect downside pressure such as slower lease-up, lower rents, higher construction costs, higher interest rates, or delayed stabilization. A high case can model more favorable outcomes, such as stronger tenant demand, better rent growth, faster occupancy, lower cost overruns, or a more attractive exit valuation.
This component helps users avoid relying on a single forecast and instead evaluate a range of possible financial outcomes. It can generate comparative views of revenue, cash flow, profitability, cash requirements, and return metrics, giving investors and lenders a clearer understanding of risk exposure. For retail development projects where timing and capital requirements can shift materially, scenario analysis is essential for stress testing assumptions, preparing contingency plans, and deciding whether a project remains viable if market conditions change.
Professional Charts and Visual Reports
The professional charts and visual reports section turns the model’s financial projections into clear visuals that are easier to interpret and present. Retail development forecasts can include many layers of information, from property-level rental income and lease-up schedules to operating expenses, financing costs, cash flow shortfalls, and return metrics. Charts help users identify patterns over time, such as when revenue begins to accelerate, when cash burn peaks, when losses narrow, and when the project approaches stabilization.
This component may include visuals for revenue growth, expense trends, cash flow movement, profitability, cumulative investment, and key performance indicators. These outputs are useful for internal planning sessions, investor meetings, lender discussions, and board-level presentations because they make the financial story easier to communicate. Instead of presenting only rows of numbers, users can show the trajectory of the project in a format that supports faster understanding. For a retail development model, this is valuable because stakeholders often need to see both the near-term funding burden and the long-term value creation potential.
ROE Components and DuPont Analysis
The ROE components and DuPont analysis section helps users understand what is driving return on equity rather than simply viewing ROE as a single output. In a retail development project, equity returns can be influenced by operating profitability, asset efficiency, financing structure, leverage, exit value, and timing of cash flows. This component breaks performance into underlying drivers so users can see how changes in margins, asset utilization, and capital structure affect overall equity returns. Inputs may include net income, revenue, total assets, equity contribution, debt levels, and projected exit assumptions, while outputs may include return on equity and related performance ratios.
This is particularly useful for investors and developers who want to understand whether returns are being created through strong operating performance, efficient use of capital, leverage, or a back-ended sale event. By analyzing ROE in more detail, users can make better decisions about financing, development scale, rent strategy, cost control, and hold period assumptions. It also adds credibility when explaining projected returns to sophisticated stakeholders.
Revenue Inputs and Lease Assumptions
The revenue inputs and lease assumptions section is where users define the income engine of the retail development project. Since rental income is the primary driver of value in retail property development, this component allows users to enter assumptions such as monthly rent, rent per square foot, property opening dates, lease-up schedules, occupancy timing, tenant mix, common area maintenance reimbursements, parking income, signage income, and other ancillary revenue sources. The model can then translate these assumptions into monthly and annual revenue projections across the forecast period.
This section is useful because it connects commercial assumptions with financial outcomes, showing how rent levels and occupancy timing shape cash flow, profitability, debt service coverage, and investment returns. Users can customize the assumptions for a single retail property or a multi-property portfolio, making it adaptable for shopping centers, retail plazas, neighborhood centers, and larger retail development pipelines. Clear revenue inputs also help users defend the forecast in business plans, funding documents, and investor conversations by showing how the projected income was built.
Bank-Ready Financial Reports
The bank-ready financial reports section provides structured outputs that lenders, investors, and financing partners typically expect when reviewing a retail development opportunity. These reports may include projected profit and loss statements, cash flow forecasts, balance sheet summaries, debt schedules, funding needs, and key lending metrics such as debt service coverage ratio. The purpose of this component is to translate detailed model assumptions into a clear financial package that can support financing discussions.
For retail development, this is especially important because lenders need to understand the timing of capital outflows, the expected start of rental income, the path to stabilization, and the project’s ability to support debt repayment. Inputs such as loan-to-value ratio, interest rate, amortization, construction draw timing, equity contribution, and operating performance can feed into these reports automatically. This section helps users present their numbers in a professional format, reduce manual reporting work, and improve the quality of conversations with banks, private lenders, equity partners, and other stakeholders involved in the financing process.
Revenue Breakdown by Property and Stream
The revenue breakdown section gives users a more detailed view of where income is expected to come from across the retail development project. Instead of showing only total revenue, this component can separate revenue by property, tenant group, lease category, rental stream, common area maintenance reimbursements, and other income such as parking, signage, or service-related fees. For a multi-property retail development portfolio, this is valuable because different properties may open at different times, lease at different rates, and stabilize at different speeds.
By reviewing revenue at a more granular level, users can identify which assets contribute most to the forecast, which properties may need stronger leasing efforts, and how diversified the income base is across the portfolio. Inputs may include property-specific rental rates, occupancy assumptions, lease start dates, square footage, and reimbursement assumptions. Outputs can help users compare property-level performance and understand the impact of each revenue stream on total project economics. This supports better leasing strategy, budgeting, investor communication, and long-term portfolio planning.
KPI Dashboard and Performance Benchmarks
The KPI dashboard and performance benchmarks section tracks the most important metrics used to evaluate a retail development project. These may include net operating income, EBITDA, debt service coverage ratio, internal rate of return, return on equity, equity multiple, cash-on-cash return, occupancy, revenue growth, margin performance, payback period, and break-even timing. The dashboard helps users compare projected performance against internal targets, lender requirements, investor expectations, or industry benchmarks.
This component is useful because retail development decisions are rarely based on revenue alone. A project may have strong long-term potential but still require careful review of liquidity, leverage, operating efficiency, and return timing. By placing key metrics in one area, the model helps users see whether the project is moving toward stabilization, whether returns justify the capital required, and whether the forecast remains credible under different assumptions. It also supports stakeholder reporting by giving executives, partners, and investors a concise performance view that connects operating activity with financial outcomes.
Development Cost and Startup Capital Planning
The development cost and startup capital planning section helps users estimate the initial investment required before the retail development project can generate meaningful rental income. This component may include corporate setup costs, office setup, technology, professional fees, branding, licensing, acquisition costs, land or property purchase costs, construction costs, design and engineering fees, permits, contingency reserves, initial marketing, leasing costs, and working capital.
For a retail development business, separating corporate startup expenses from property-level development costs is important because each category may be funded differently and occur at different points in the timeline. The model can help users calculate total capital needs, phase costs across the development schedule, and understand how much debt and equity may be required. Outputs from this section support budgeting, funding requests, lender conversations, and investor planning. It also helps reduce the risk of underestimating the capital required to reach stabilization. By creating a clear cost structure, users can make more informed decisions about project scale, acquisition timing, construction phasing, and financing strategy.
Break-Even and Payback Analysis
The break-even and payback analysis section helps users estimate when the retail development project begins to cover its costs and when invested capital may be recovered. This component can use inputs such as fixed operating costs, property expenses, payroll, debt service, rental income, occupancy timing, lease-up assumptions, financing costs, and initial investment to calculate the point where revenue or cash flow becomes sufficient to offset ongoing obligations. It can also estimate the payback period for equity investors by comparing cumulative cash flows and exit proceeds against the initial capital contributed.
This is particularly useful for retail development because profitability often arrives later than the initial spending period, and stakeholders need to understand how long the project may require support before it becomes self-sustaining. Break-even analysis supports funding decisions, cash reserve planning, risk review, and investor communication. Payback analysis helps users evaluate whether the timing of returns aligns with investor expectations. Together, these outputs provide a practical view of financial resilience and help users judge whether the project’s long-term return potential justifies the upfront commitment.
File types:
Excel – Single-User: .xlsx
Excel – Multi-User: .xlsx
Similar ProductsOther customers were also interested in...


 HenrySheykin
Industrial Development REFM Financial Model Excel ...
The Industrial Development Financial Model helps users evaluate a capital-intensive industrial prope... Read more
Condominium Development REFM Financial Model Excel...
The Condo Development Financial Model helps developers, investors, analysts, consultants, and busine... Read more
Self Storage Development REFM Financial Model Exce...
The Self-Storage Development Financial Model is a ready-to-use financial model template designed to ... Read more
Office Development REFM Financial Model Excel Temp...
The Office Development Financial Model Financial Model Template helps users evaluate a commercial of... Read more
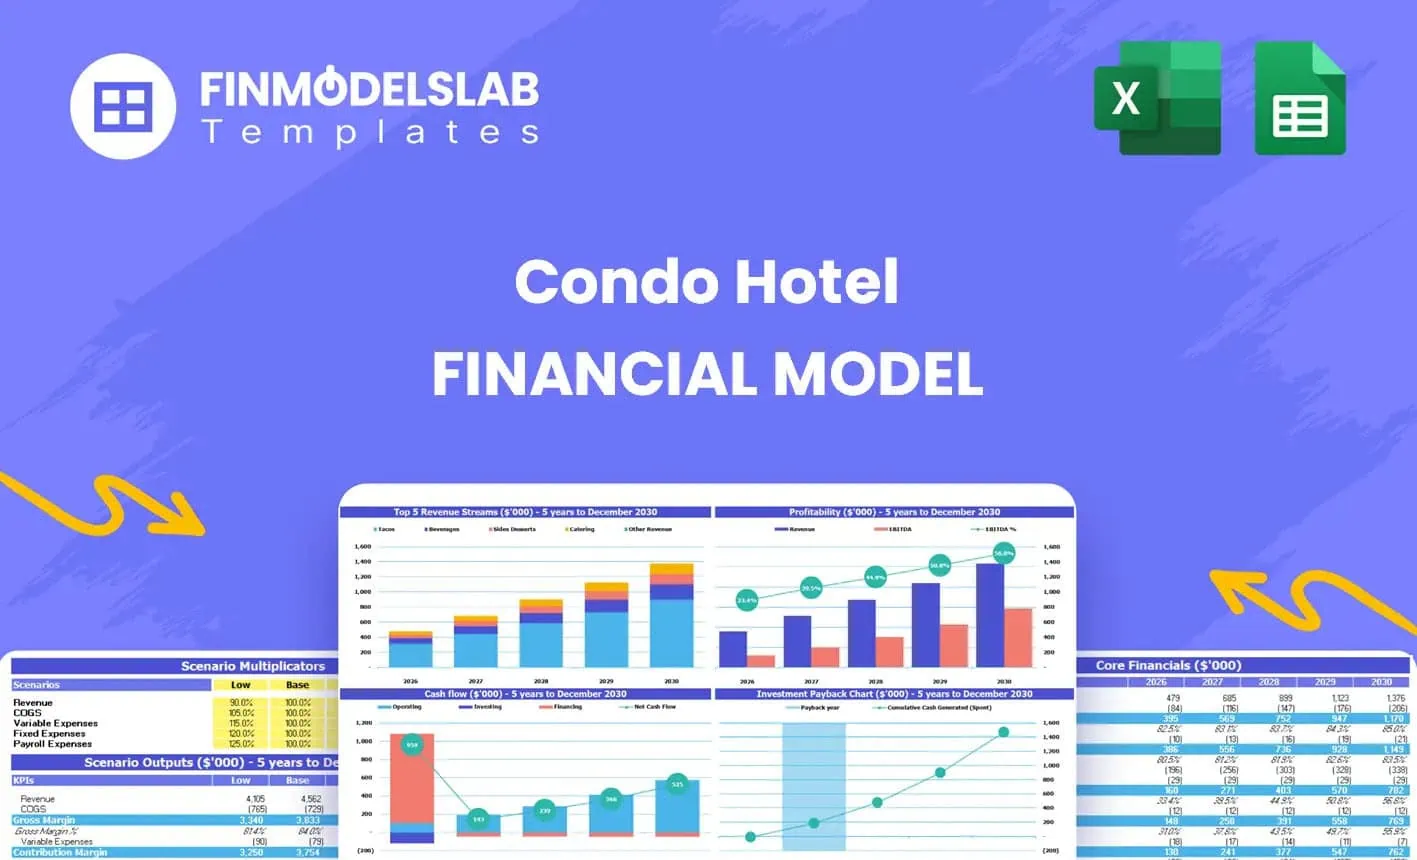
Condo Hotel Financial Model Excel Template
The Condo Hotel Financial Model helps users turn a condo hotel concept, launch plan, or investment o... Read more
 anthony
The Realtors Quintessential ALL-IN-ONE Toolkit
Professional Realtors need a professional Toolkit which allows them to operate at a higher level. Th... Read more
 Pushkar
Commercial Real Estate – Lease or Sell Quart...
Commercial Real Estate - Lease or Sell Quarterly Excel Model with 3 Statements, Valuation, and Devel... Read more

 Giorgos
Residential Building Development Model (Sale, Rent...
Financial model presenting a development scenario for a Residential Building with units available fo... Read more

 Eastwich Advisors
Multifamily Rehab Model (Includes Investor Returns...
Introducing the Multifamily Rehab Flip Model with Investor Returns Waterfall - a comprehensive tool ... Read more
You must log in to submit a review.