
0 ITEMS

Recreation Center Business Plan Financial Model Excel Template
The Recreation Center Financial Model helps entrepreneurs, business owners, consultants, analysts, and planning teams turn a recreation center concept into a structured financial forecast. Instead of building a spreadsheet from scratch, users can work from a ready-to-use financial model template designed around the realities of a community fitness, sports, and recreation facility. It helps organize the key assumptions behind memberships, daily passes, programs, facility rentals, retail sales, startup costs, operating expenses, payroll, cash flow, profitability, and funding requirements in one connected planning tool. This template is built for business planning, investor discussions, lender presentations, feasibility studies, internal budgeting, and strategic decision-making. Users can enter their own assumptions for pricing, visitor volume, membership activity, staffing, capital expenditures, monthly expenses, and growth expectations, then review how those decisions affect the five-year forecast. The model is especially useful for founders preparing a recreation center business plan, owners evaluating expansion, consultants supporting clients, or analysts comparing different operating scenarios before committing capital. The Recreation Center Financial Model connects revenue assumptions with cost structure so users can see whether the business can support its facility, team, equipment, and programming costs. It includes forecasting logic for profit and loss, cash flow, balance sheet outputs, key metrics, and break-even analysis, helping users evaluate whether the center can reach sustainable profitability. Because the assumptions are editable, users can test how changes in membership pricing, daily pass demand, program participation, payroll levels, or startup investment may impact cash flow and financial performance. With pre-built formulas, professional formatting, and presentation-ready outputs, the template saves time while giving users a more disciplined way to plan. It supports practical decision-making by showing not only expected revenue and expenses, but also the timing of cash needs, return metrics, performance benchmarks, and downside or upside scenarios. Whether used for launching a new recreation center, improving an existing sports facility, or preparing funding documents, this financial model template provides a clear framework for assessing feasibility, budgeting operations, and communicating the financial story behind the business.
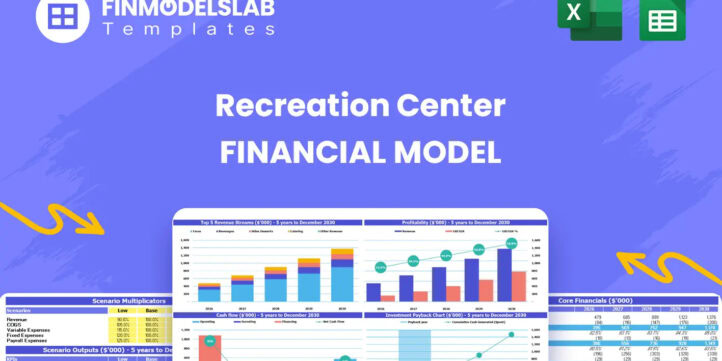


Financial Model Overview
The Recreation Center Financial Model is a ready-to-use planning tool designed to help founders, owners, consultants, analysts, and finance teams evaluate the financial potential of a recreation center, sports facility, community fitness center, or multi-use leisure facility. It brings together the key drivers of the business, including membership activity, daily pass visits, program registrations, facility rentals, retail sales, startup investment, payroll, operating expenses, cash flow, profitability, and investor metrics. The template is built to support a five-year forecast and is structured so users can replace sample assumptions with their own numbers, making it useful for business planning, feasibility analysis, funding preparation, expansion planning, and internal budgeting. By connecting assumptions to financial statements, charts, dashboards, and performance metrics, the model helps users understand how the recreation center may perform before making major capital, staffing, pricing, or financing decisions.
All-in-One Dashboard
The all-in-one dashboard gives users a central place to view the most important inputs and outputs of the Recreation Center Financial Model without needing to move through every worksheet to understand the overall picture. This component is designed to summarize core assumptions such as launch timing, pricing, visitor volumes, membership activity, growth rates, cost expectations, and financing inputs, then connect those assumptions to key outputs such as total revenue, EBITDA, net profit, cash balance, return metrics, and break-even timing. For a recreation center, this is especially useful because the business often has multiple revenue sources and a broad cost base, including facility costs, equipment, payroll, programming, utilities, maintenance, and marketing. The dashboard helps users quickly see whether the plan is financially balanced, whether cash remains sufficient, and whether the business can support its operating model. It is useful for internal reviews, partner discussions, lender meetings, and investor presentations because it turns a detailed spreadsheet into a clear management view that supports faster decision-making.
Low, Base, and High Scenario Analysis
The low, base, and high scenario analysis component allows users to test how the recreation center may perform under different operating conditions. Instead of relying on one fixed forecast, users can compare a conservative case, an expected case, and an upside case by adjusting major drivers such as membership sign-ups, daily pass volume, program participation, facility rental demand, pricing, cost growth, staffing levels, and marketing effectiveness. The outputs may show how each scenario affects revenue, gross margin, EBITDA, net income, cash flow, funding requirements, and return metrics over the forecast period. This is valuable because recreation centers are sensitive to local demand, seasonality, competition, economic conditions, and community adoption. A low case can help users evaluate cash runway and risk if customer acquisition is slower than expected, while a high case can show the upside potential of stronger membership growth or successful programming. For business plans and funding documents, scenario analysis helps demonstrate that the user has considered uncertainty and can make informed decisions under different market outcomes.
Professional Charts and Visual Reports
The professional charts and visual reports component turns the financial forecast into easy-to-read visuals that can be used in presentations, business plans, and stakeholder updates. This section may include charts for revenue growth, expense trends, EBITDA, net profit, cash balance, revenue mix, margin progression, debt or funding needs, and other key performance indicators. For a recreation center, visual reporting is important because stakeholders often need to understand a complex mix of memberships, daily passes, programs, rentals, and retail revenue quickly. Charts can make it easier to identify trends, such as whether membership revenue becomes the largest income source, whether operating costs are scaling efficiently, or whether cash flow improves after the initial startup period. These reports help users communicate the financial story behind the business in a more polished and accessible way. They are useful for investor decks, bank loan discussions, board updates, feasibility reports, and internal planning meetings where a clear visual summary can support better conversations and faster approval decisions.
ROE Components and DuPont Analysis
The ROE components and DuPont analysis section helps users understand the drivers behind return on equity rather than looking only at a single profitability number. This component may break return on equity into underlying factors such as net profit margin, asset turnover, and financial leverage, helping users see whether shareholder returns are being driven by operating profitability, efficient use of assets, or capital structure. For a recreation center, this can be especially useful because the business often requires meaningful upfront investment in equipment, facility improvements, sports courts, HVAC upgrades, technology, furniture, and working capital. By analyzing how assets generate revenue and how profit converts into equity returns, users can assess whether the facility is making efficient use of invested capital. This section can also support investor conversations by showing a more complete view of financial performance and capital efficiency. It helps users evaluate whether operational improvements, pricing adjustments, cost controls, or financing structure changes could improve returns over time.
Revenue Inputs and Assumption Planning
The revenue inputs and assumption planning component is where users define the commercial engine of the recreation center. This section may include editable assumptions for member visits, membership pricing, daily pass visits, pass pricing, program registrations, facility rentals, pro shop sales, concessions, private events, corporate wellness packages, and other income streams relevant to the facility. Users can enter volume, pricing, growth rates, utilization assumptions, and seasonality expectations, then the model translates those inputs into monthly and annual revenue forecasts. This is important because recreation center revenue is often diversified, and each stream may behave differently. Memberships may provide recurring stability, daily passes may fluctuate with demand, programs may depend on class scheduling and instructor capacity, and rentals may depend on partnerships with leagues or community groups. By documenting revenue assumptions clearly, users can test whether the business has enough demand to cover its fixed and variable costs. This section is useful for planning pricing strategy, validating market opportunity, preparing a business plan, and explaining revenue logic to lenders or investors.
Bank-Ready Financial Reports
The bank-ready financial reports component provides the structured financial outputs that lenders, investors, and professional stakeholders typically expect to review. This section may include a profit and loss statement, cash flow statement, balance sheet, summary financial metrics, debt service visibility, profitability measures, and supporting assumptions. For a recreation center seeking financing, these reports are critical because banks and funding partners need to see whether the business can generate enough cash to cover expenses, repay loans, maintain liquidity, and remain profitable under realistic conditions. The reports help convert operational assumptions into formal financial statements, making the plan more credible and easier to evaluate. Users can review revenue, cost of goods sold where applicable, payroll, rent or mortgage-related costs, utilities, maintenance, marketing, insurance, depreciation, taxes, financing costs, and cash balances over time. This component is useful for loan applications, investor meetings, grant proposals, business plan submissions, and owner decision-making because it presents the forecast in a familiar, lender-friendly format.
Revenue Breakdown by Stream
The revenue breakdown by stream component provides a detailed view of how total recreation center revenue is built across the business model. Instead of showing only one revenue line, this section separates income sources such as memberships, daily passes, program registrations, facility rentals, pro shop sales, concessions, special events, personal training, coaching, or other services the user chooses to include. It may show monthly and annual revenue by category, each stream’s percentage of total revenue, growth over time, and contribution to overall performance. This is useful because a recreation center with balanced revenue streams may be less exposed to risk than one that depends on a single source of income. Users can identify which activities drive the most revenue, which streams have the strongest growth potential, and which may need additional marketing, pricing changes, or operational support. The breakdown also helps users communicate the business model clearly to investors and lenders, showing how recurring revenue, visit-based revenue, programming, rentals, and ancillary sales combine to support the facility’s financial plan.
KPI Dashboard and Industry Benchmarks
The KPI dashboard and industry benchmarks component helps users evaluate performance through key metrics that matter for a recreation center business. This section may track indicators such as total visits, average revenue per visit, membership volume, utilization rates, revenue per member, payroll as a percentage of revenue, EBITDA margin, net profit margin, cash balance, break-even point, return on equity, payback period, and other performance measures. It may also allow comparison against benchmark expectations or target ranges, helping users assess whether assumptions appear realistic and whether the operating plan is competitive. For a recreation center, KPI tracking is important because financial success depends on both demand and operational efficiency. A facility may generate strong revenue but still struggle if staffing, maintenance, utilities, or marketing costs are too high relative to sales. This dashboard gives users a faster way to spot strengths, weaknesses, and improvement opportunities. It is useful for management reviews, investor updates, lender conversations, and ongoing planning because it turns detailed financial data into practical performance signals.
Startup and Operating Cost Planning
The startup and operating cost planning component helps users estimate both the initial capital needed to open the recreation center and the recurring expenses required to keep it running. Startup costs may include fitness equipment, sports court flooring, HVAC upgrades, facility improvements, signage, furniture, technology systems, licenses, legal fees, deposits, initial inventory, pre-opening marketing, and working capital. Operating expenses may include payroll, instructor costs, rent or facility costs, utilities, insurance, repairs and maintenance, cleaning, software, marketing, administrative expenses, payment processing, supplies, and other recurring costs. The model can help separate one-time capital expenditures from monthly operating expenses so users can understand both launch funding needs and ongoing budget requirements. This is useful because recreation centers often require significant upfront investment before revenue begins, and underestimating facility or payroll costs can create cash flow pressure. By mapping costs in detail, users can plan funding more accurately, evaluate whether expenses are scalable, and make better decisions about equipment purchases, staffing levels, pricing, and launch timing.
Break-Even Analysis
The break-even analysis component helps users identify when the recreation center is expected to cover its fixed and variable costs and begin generating profit. This section may use assumptions for revenue streams, pricing, customer volume, cost of goods sold, payroll, rent, utilities, maintenance, marketing, and other operating expenses to calculate the point at which total revenue equals total costs. It may show break-even timing by month, required revenue levels, minimum visit or membership volume, and the relationship between contribution margin and fixed cost coverage. For a recreation center, break-even analysis is especially valuable because the business may have a large fixed cost structure tied to the facility, equipment, staffing, and utilities. Understanding the break-even point helps users set realistic sales targets, evaluate pricing, plan pre-opening membership campaigns, assess cash reserves, and determine whether additional funding is needed. It also supports investor and lender discussions because it explains how quickly the facility may become financially self-sustaining and what level of demand is required to reach that milestone.
File types:
Excel – Single-User: .xlsx
Excel – Multi-User: .xlsx
Similar ProductsOther customers were also interested in...


 Giorgos
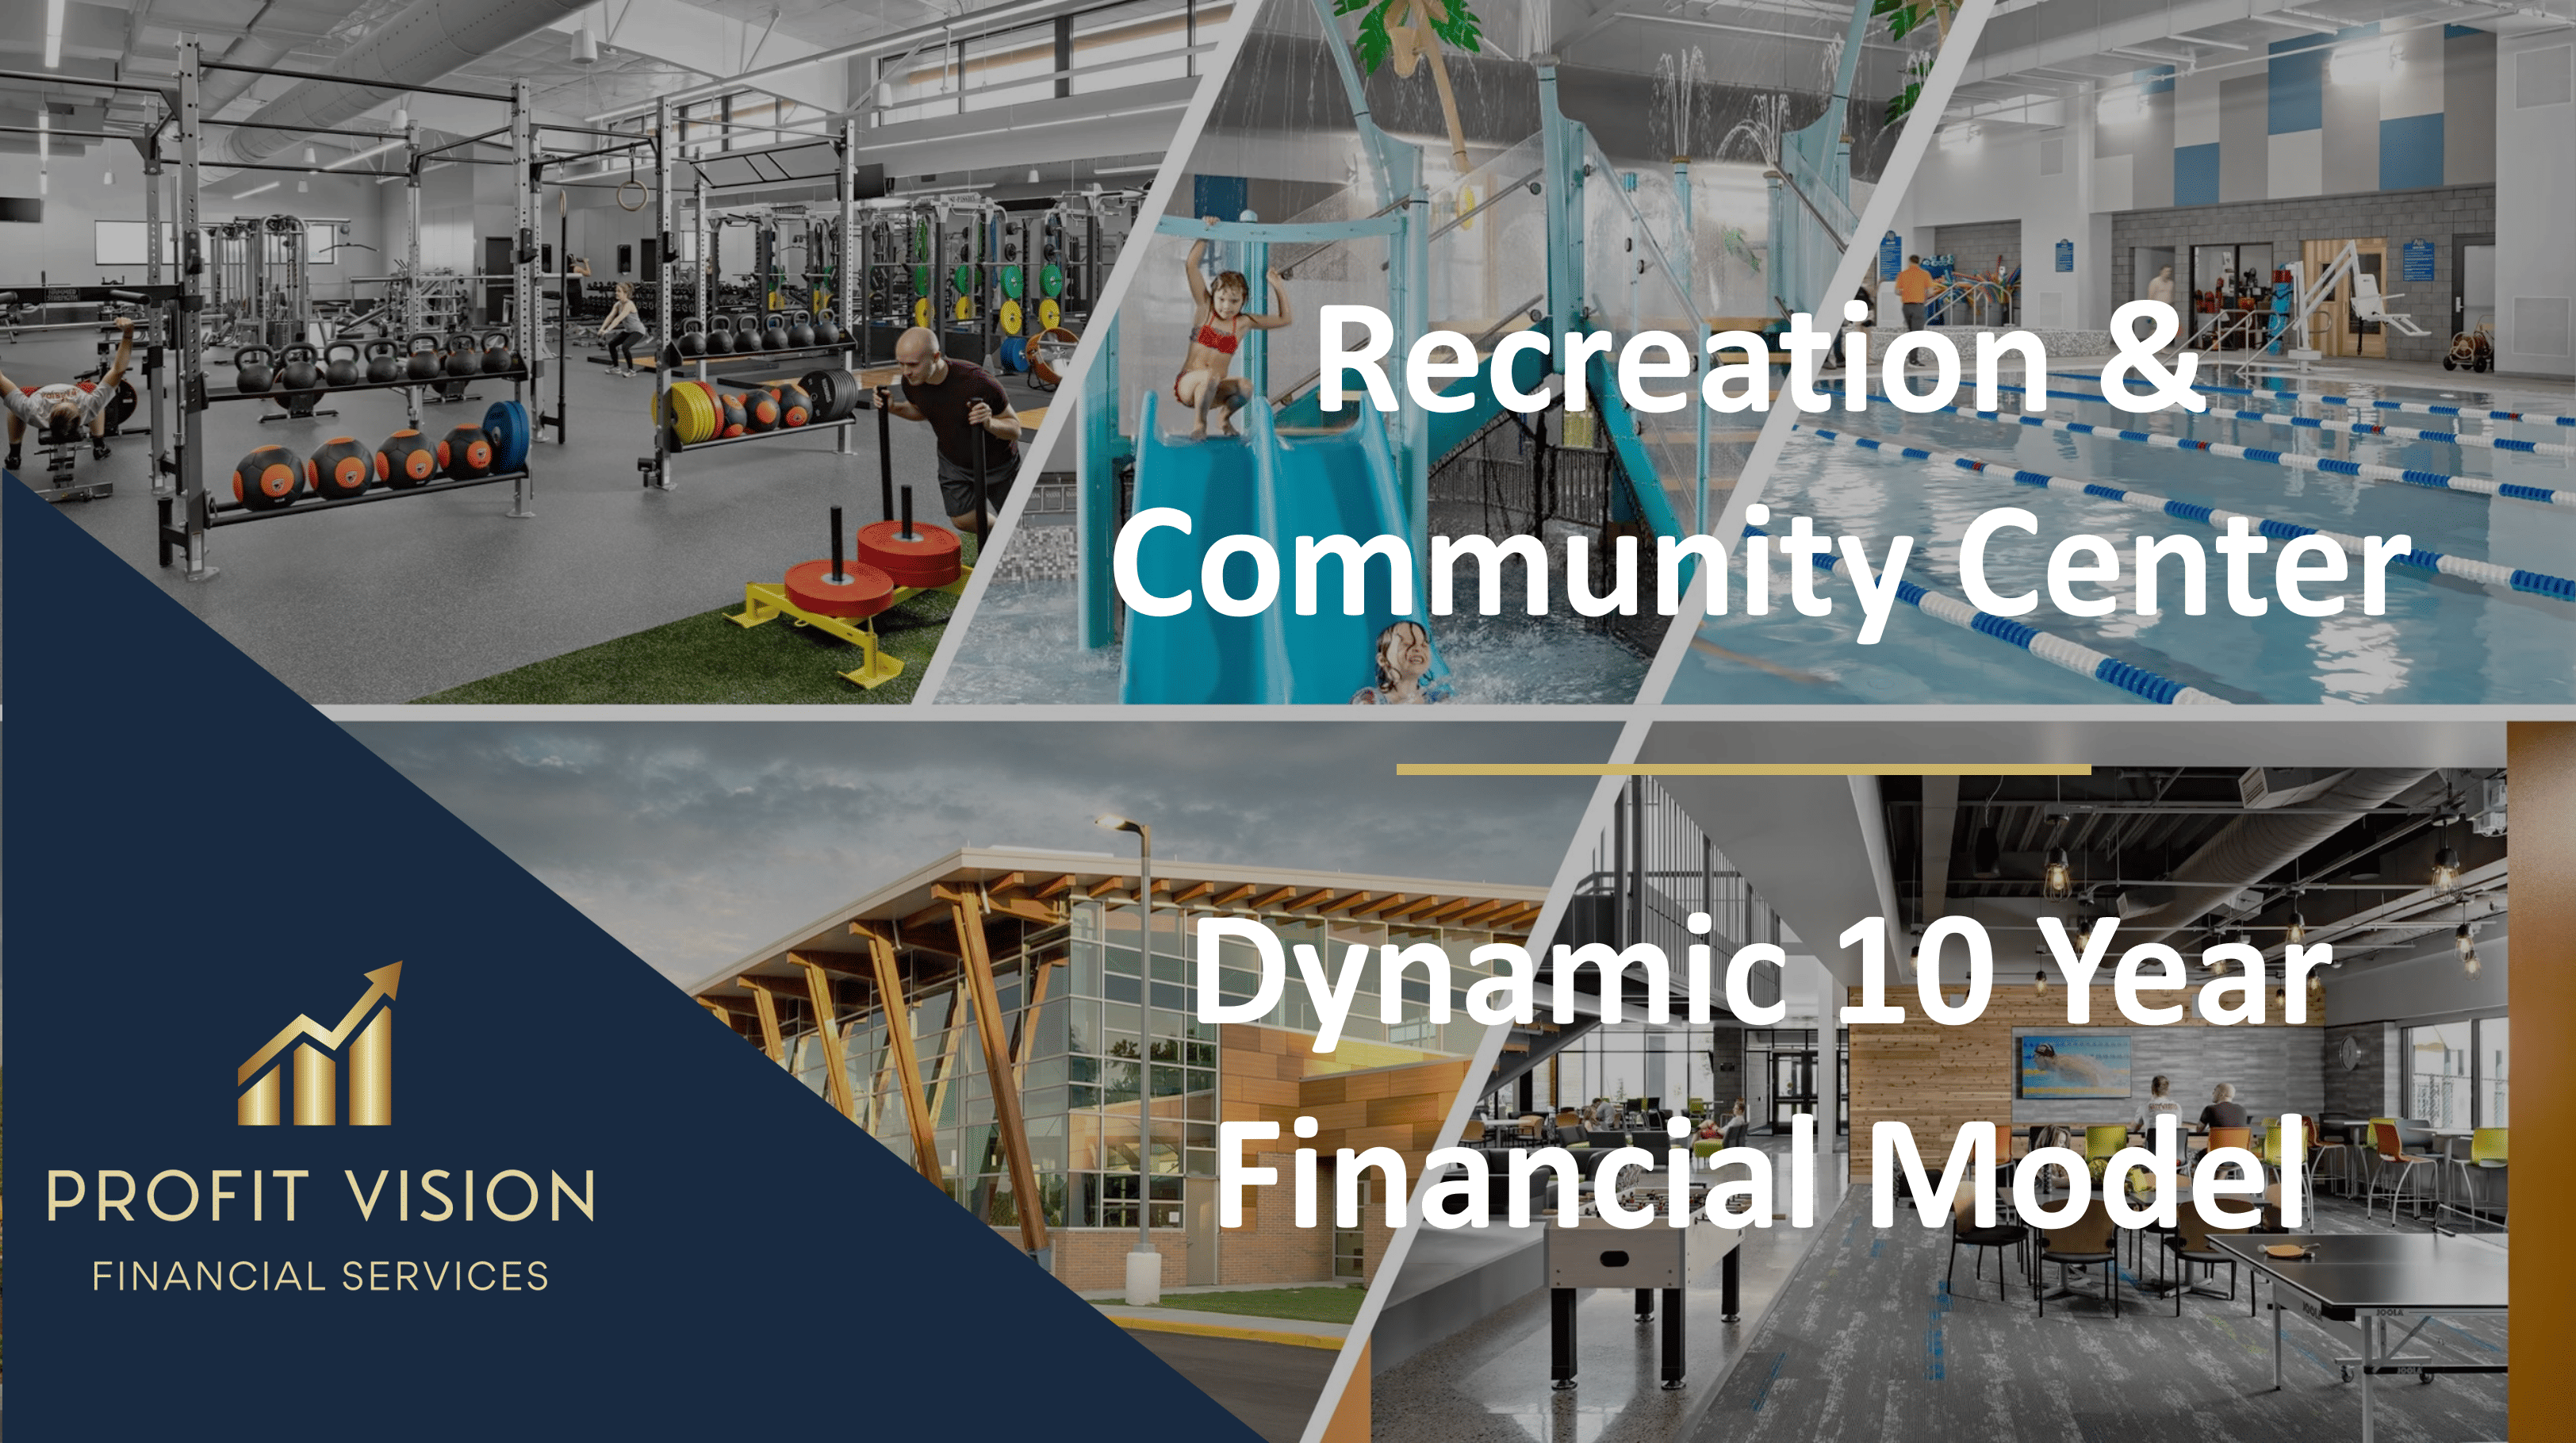
Recreation & Community Center – Dynamic 10 Y...
Financial Model presenting a development and operating scenario of a Recreation & Community Cent... Read more
 HenrySheykin
Mental Health Center Financial Model Excel Templat...
The Mental Health Clinic Financial Model helps users build a structured financial forecast for a the... Read more
Gym Financial Model Excel Template
The Gym Financial Model Financial Model Template helps entrepreneurs, gym owners, consultants, analy... Read more
Physical Fitness Gym Financial Model Excel Templat...
The Gym Financial Model Template helps entrepreneurs, gym owners, consultants, analysts, and busines... Read more
Orthopedic Center Financial Model Excel Template
The Orthopedic Clinic Financial Model helps users build a structured five-year forecast for a capita... Read more

Golf Course Financial Model Excel Template
The Golf Course Financial Model Financial Model Template helps entrepreneurs, owners, consultants, a... Read more

Pool Hall Financial Model Excel Template
The Pool Hall Financial Model helps entrepreneurs, founders, business owners, consultants, and analy... Read more
Pilates Studio Financial Model Excel Template
The Pilates Studio Financial Model helps entrepreneurs, studio owners, consultants, analysts, and bu... Read more
Drug Treatment Center Financial Model Excel Templa...
The Residential Treatment Center Financial Model helps users turn a live-in behavioral health, menta... Read more
Hypnotherapy Center Financial Model Excel Template
The Hypnotherapy Practice Financial Model helps users turn a wellness practice concept into a struct... Read more
You must log in to submit a review.