
0 ITEMS

Orthopedic Center Financial Model Excel Template
The Orthopedic Clinic Financial Model helps users build a structured five-year forecast for a capital-intensive medical practice without starting from a blank spreadsheet. It is designed to support planning for orthopedic services such as surgical procedures, physician assistant consultations, radiology, physical therapy, and nursing services. By connecting revenue assumptions, practitioner capacity, patient utilization, reimbursement expectations, startup costs, operating expenses, payroll, and cash flow, the template gives buyers a practical way to evaluate whether an orthopedic clinic can grow into sustainable profitability. This financial model template is built for entrepreneurs, clinic founders, healthcare business owners, consultants, analysts, and anyone preparing an orthopedic clinic business plan, investor presentation, lender package, or internal feasibility study. It helps users estimate the initial capital needed for equipment, facility setup, renovations, technology, working capital, and pre-opening expenses, while also modeling the ongoing cost structure required to run a specialized medical clinic. Users can adjust assumptions for staffing, treatment volume, pricing, utilization rates, variable costs, insurance, rent, marketing, and other expenses to reflect their own clinic strategy. Instead of relying on disconnected estimates, the model brings the major planning questions into one editable framework. Users can assess how revenue may ramp up over time, how long cash reserves may need to support early operating losses, when break-even may occur, and how profitability changes under different operating assumptions. The template includes financial statements, forecast outputs, scenario analysis, charts, return metrics, revenue breakdowns, and dashboards that make it easier to review performance and communicate the financial plan to partners, lenders, investors, or management teams. The Orthopedic Clinic Financial Model is especially useful for decision-making before launch, expansion, or funding discussions. It helps buyers test whether practitioner capacity can support revenue targets, whether payroll and facility costs are realistic, whether startup investment is sufficient, and whether the clinic has enough cash to bridge the ramp-up period. With editable inputs and pre-built calculations, the template saves time while giving users a more disciplined way to plan startup costs, operating expenses, cash flow, profitability, break-even timing, and long-term financial performance.
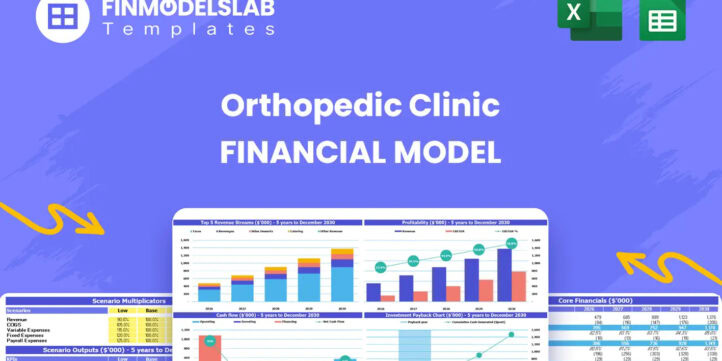


Financial Model Overview
The Orthopedic Clinic Financial Model is a ready-to-use financial model template designed to help founders, operators, consultants, and analysts evaluate the financial feasibility of launching or expanding an orthopedic clinic. Orthopedic practices are often capital-intensive because they may require specialized medical equipment, trained clinical staff, diagnostic services, procedure rooms, and a carefully managed patient acquisition process. This template brings those planning requirements into one structured forecast so users can estimate revenue, expenses, cash flow, funding needs, profitability, and investor returns over a multi-year period. Instead of building a model from scratch, users can begin with an editable framework that connects key assumptions to projected financial statements and decision-ready outputs. It is useful for business planning, lender discussions, investor presentations, internal budgeting, and strategic decision-making because it turns operational assumptions into clear financial projections.
All-in-One Dashboard
The all-in-one dashboard gives users a central place to review the most important inputs and outputs of the Orthopedic Clinic Financial Model. It is designed to simplify financial planning by bringing together high-level assumptions, revenue drivers, cost categories, profitability indicators, cash position, and key financial results in one organized view. Users can adjust core inputs such as practitioner counts, utilization rates, service pricing, staffing levels, operating expenses, and capital investment assumptions, then see how those changes flow through the model. The dashboard is useful because an orthopedic clinic has many moving parts, including surgeons, physician assistants, radiology services, physical therapy sessions, nurses, medical supplies, facility costs, and insurance-related timing. By summarizing these factors in one location, the dashboard helps users quickly understand whether the clinic is financially viable, where the most important risks may be, and which assumptions deserve closer review before presenting the plan to investors, lenders, partners, or internal decision-makers.
Low, Base, and High Scenario Analysis
The Low, Base, and High scenario analysis section allows users to evaluate how different business outcomes may affect the clinic’s financial performance. In a real orthopedic practice, results can vary significantly depending on patient volume, reimbursement rates, referral relationships, practitioner utilization, hiring timelines, equipment costs, and payer mix. This component lets users compare conservative, expected, and optimistic cases without rebuilding the model each time. Inputs may include changes in procedure pricing, treatment capacity, patient utilization, revenue growth, operating expenses, payroll assumptions, and capital expenditure timing. The outputs help show how each scenario affects revenue, EBITDA, cash flow, profit, funding requirements, and return metrics. This is valuable for planning because it gives users a clearer view of downside risk and upside opportunity. For funding discussions, scenario analysis also demonstrates that the user has considered uncertainty and can explain how the clinic may perform if patient demand is lower than expected or if the business achieves stronger pricing and utilization.
Professional Charts
The professional charts section converts the financial forecast into presentation-ready visual outputs that are easier to interpret than raw spreadsheet data. Orthopedic clinic stakeholders often need to understand trends quickly, especially when reviewing revenue growth, cost structure, profitability, cash flow, and break-even timing. This component may visualize monthly or annual revenue, EBITDA development, operating profit, cash balance, expense categories, revenue stream contribution, and key financial ratios. The charts help users identify patterns that may not be obvious from the financial statements alone, such as the impact of early cash burn, the point at which revenue begins to cover fixed costs, or the relationship between utilization growth and margin improvement. For investor or lender presentations, these visuals make the business case more accessible and professional. They also support internal decision-making by allowing owners and managers to track whether the clinic’s planned performance is moving in the right direction and where adjustments may be needed.
ROE Components and DuPont Analysis
The ROE components and DuPont analysis section helps users understand what is driving return on equity rather than only viewing the final percentage. For an orthopedic clinic, return performance may be influenced by profit margin, asset intensity, debt structure, equity investment, revenue ramp-up, and the efficiency of expensive equipment and facilities. This component breaks return on equity into more detailed drivers so users can evaluate how operating profitability, asset utilization, and financial leverage interact over the forecast period. Inputs may include projected net income, revenue, assets, liabilities, equity contributions, financing assumptions, depreciation, and retained earnings. The outputs provide a more analytical view of how the clinic creates or limits shareholder returns. This is especially useful for capital-intensive healthcare ventures because a clinic can generate meaningful revenue while still delivering modest investor returns if fixed assets, startup costs, or financing requirements are too high. DuPont-style analysis helps users identify whether performance improvements should come from margin expansion, better asset productivity, or a more efficient funding structure.
Revenue Inputs
The revenue inputs section is where users define the core assumptions that drive the clinic’s sales forecast. For an orthopedic clinic, revenue is typically shaped by the number of practitioners, monthly treatment capacity, patient utilization, service pricing, reimbursement rates, and service mix across clinical activities. This component may include assumptions for surgical procedures, physician assistant consultations, MRI and X-ray services, physical therapy sessions, and nursing services. Users can adjust the number of surgeons, therapists, assistants, and support staff, then model how their capacity ramps over time. They can also change price per treatment, utilization rates, and growth assumptions to reflect a specific market, payer environment, or operating strategy. The section is useful because revenue forecasting in a healthcare business should be connected to operational reality rather than broad top-down estimates. By linking practitioner capacity and service-level pricing to projected sales, the model helps users test whether their patient volume assumptions are realistic and whether the clinic can generate enough revenue to support payroll, facilities, medical supplies, equipment, and financing costs.
Bank-Ready Reports
The bank-ready reports section provides structured financial outputs that can support lender discussions, funding applications, and professional stakeholder reviews. Orthopedic clinics may require significant upfront funding for equipment, renovations, deposits, working capital, technology, and hiring, so lenders typically want clear projections that show revenue, profitability, cash flow, balance sheet strength, and debt service capacity. This component consolidates the model’s assumptions into formal financial statements and lender-friendly summaries. It may include projected profit and loss statements, cash flow forecasts, balance sheets, EBITDA, net income, working capital, financing needs, and cash balances over the forecast period. The value of this section is that it helps users present the business in a format that financing partners can review efficiently. Instead of sharing disconnected calculations, the user can provide organized reports that show how the clinic intends to grow, when it may become profitable, how much cash is required, and whether the business can support its operating and financing obligations.
Revenue Breakdown
The revenue breakdown section gives users a detailed view of how each service line contributes to total clinic income. Orthopedic practices often include multiple revenue streams, and each stream can have different pricing, capacity, margin, staffing needs, and growth behavior. This component separates revenue by categories such as surgical procedures, physician assistant consultations, radiology services, physical therapy sessions, and nursing services so users can see which services are expected to generate the largest share of sales. Inputs may include treatment volume, number of providers, monthly capacity, utilization rate, price per treatment, and ramp-up assumptions for each service line. The outputs help users compare revenue mix over time and understand how changes in one area affect overall performance. This is important for budgeting and strategic planning because a clinic may need to decide whether to invest more heavily in surgical capacity, diagnostic imaging, therapy services, or ancillary offerings. A clear revenue breakdown also helps investors and lenders understand how the clinic will generate income rather than relying on one undifferentiated revenue total.
KPI Dashboard
The KPI dashboard tracks the performance metrics that matter most for an orthopedic clinic’s financial health and operational progress. While the all-in-one dashboard summarizes major inputs and outputs, the KPI dashboard focuses on measurable indicators that can be monitored against targets. These may include revenue growth, EBITDA margin, net profit margin, cash balance, monthly burn rate, break-even timing, utilization rate, revenue per practitioner, revenue per service line, return on equity, payback period, and other financial or operating benchmarks. Users can review these metrics to understand whether the clinic’s forecast is improving, underperforming, or requiring strategic adjustment. The KPI dashboard is useful for management reporting because it translates the model into practical performance indicators that can guide decisions about hiring, marketing, pricing, payer negotiations, equipment usage, and cost control. It is also helpful for stakeholder communication because it provides a concise view of the clinic’s progress toward profitability, liquidity, and return objectives.
Break-Even Analysis
The break-even analysis section helps users estimate when the orthopedic clinic’s revenue may be sufficient to cover its operating costs and begin generating sustainable profit. This is especially important for a clinic with high fixed expenses, including medical staff salaries, rent, insurance, administrative support, equipment-related costs, and facility overhead. The component may use assumptions for monthly revenue, service pricing, utilization rates, cost of services, payroll, fixed expenses, and variable medical supply costs to determine the level of activity required to cover total costs. Outputs may include the projected break-even month, revenue required to break even, service volume needed to cover expenses, and the gap between current forecast performance and profitability. This section is useful for founders and investors because it shows how long the clinic may operate at a loss during the ramp-up period and what operational improvements can accelerate profitability. It also helps users evaluate whether marketing plans, referral strategies, staffing schedules, and pricing assumptions are strong enough to support the path to break-even.
Startup Costs and CAPEX Planning
The startup costs and CAPEX planning section organizes the initial investment required to open or expand the orthopedic clinic. A specialized medical practice may require major spending before revenue begins, including MRI equipment, X-ray equipment, surgical tools, facility renovations, exam room buildout, furniture, medical technology, software, licenses, deposits, launch marketing, legal setup, and initial working capital. This component allows users to enter or edit each startup cost category and see the total capital requirement before operations begin. It can also help distinguish between capital expenditures, pre-opening expenses, and working capital needs, which is important for accurate cash flow planning and funding discussions. The output helps users understand the minimum funding required, the timing of investment, and the impact of large equipment purchases on cash reserves and balance sheet projections. For an orthopedic clinic, this section is critical because underestimating startup costs can create liquidity pressure before patient volume has time to ramp up. A detailed CAPEX plan gives users a more realistic foundation for launch decisions and financing strategy.
Cash Flow Forecasting
The cash flow forecasting section shows how money moves in and out of the orthopedic clinic over time, helping users anticipate liquidity needs before they become operational problems. A clinic may show improving revenue and profitability while still facing cash constraints due to upfront equipment purchases, payroll obligations, rent, insurance payments, reimbursement delays, loan payments, and working capital requirements. This component uses assumptions from revenue, costs, payroll, startup investment, financing, taxes, and balance sheet movements to calculate projected cash inflows, outflows, ending cash balances, and minimum cash requirements. The outputs help users identify periods of cash burn, funding gaps, and the point at which the business may begin generating positive cash flow. This is useful for planning because a capital-intensive healthcare business often needs sufficient reserves or financing to bridge the gap between launch and stable operations. With a cash flow forecast, users can evaluate whether they need a loan, equity investment, line of credit, equipment financing, or phased rollout plan to protect the clinic’s liquidity.
File types:
Excel – Single-User: .xlsx
Excel – Multi-User: .xlsx
Similar ProductsOther customers were also interested in...

 HenrySheykin
Mental Health Center Financial Model Excel Templat...
The Mental Health Clinic Financial Model helps users build a structured financial forecast for a the... Read more
Drug Treatment Center Financial Model Excel Templa...
The Residential Treatment Center Financial Model helps users turn a live-in behavioral health, menta... Read more

Hypnotherapy Center Financial Model Excel Template
The Hypnotherapy Practice Financial Model helps users turn a wellness practice concept into a struct... Read more

Yoga Studio Financial Model Excel Template
The Yoga Studio Financial Model helps entrepreneurs, founders, studio owners, consultants, and finan... Read more

Weight Loss Center Financial Model Excel Template
The Weight Loss Center Financial Model helps entrepreneurs, clinic owners, consultants, and analysts... Read more

Sports Therapy Financial Model Excel Template
The Sports Medicine Clinic Financial Model helps users turn a clinic concept, launch plan, or expans... Read more

Tai Chi Center Financial Model Excel Template
The Martial Arts School Financial Model helps founders, school owners, consultants, and business pla... Read more

Osteopathic Center Financial Model Excel Template
The Holistic Health Center Financial Model helps entrepreneurs, founders, consultants, analysts, and... Read more

Oriental Medicine Center Financial Model Excel Tem...
The Traditional Chinese Medicine Clinic Financial Model helps entrepreneurs, clinic owners, consulta... Read more

Naturopathy Center Financial Model Excel Template
The Naturopathic Clinic Financial Model Template helps practitioners, founders, consultants, and bus... Read more
You must log in to submit a review.