
0 ITEMS

Sports Therapy Financial Model Excel Template
The Sports Medicine Clinic Financial Model helps users turn a clinic concept, launch plan, or expansion strategy into a structured financial forecast. It is designed for sports injury clinics, rehabilitation practices, physical therapy-led clinics, performance medicine centers, and multidisciplinary facilities offering services such as physical therapy sessions, sports physician consultations, diagnostic specialist services, and performance coaching packages. Instead of building a spreadsheet from scratch, users can start with an editable financial model template that connects revenue assumptions, startup costs, operating expenses, payroll, cash flow, profitability, and funding requirements in one organized planning tool. This template is useful for entrepreneurs, clinic founders, business owners, consultants, analysts, and anyone preparing a sports medicine clinic business plan or funding presentation. It helps users estimate how practitioner count, treatment capacity, utilization rates, pricing, service mix, staffing levels, and facility costs may affect financial performance over time. The model supports practical decision-making by showing how revenue builds month by month, how expenses scale with operations, and how early-stage losses may transition into sustainable profitability as patient volume grows. The Sports Medicine Clinic Financial Model is built for financial planning, investor conversations, lender reviews, and internal management. Users can adjust assumptions for salaries, treatment prices, medical supplies, rent, insurance, equipment, marketing, and other clinic-specific inputs to reflect their own market and operating strategy. The model can help identify the amount of startup funding needed, assess whether the clinic has enough working capital, evaluate break-even timing, and understand the relationship between growth plans and cash flow pressure. With pre-built reports, scenario analysis, dashboards, charts, revenue views, and KPI outputs, the template provides a clear way to review performance from multiple angles. It is suitable for both new clinics preparing to launch and established practices evaluating expansion, additional practitioners, new service lines, or improved utilization. By organizing the key assumptions and financial outputs in a ready-to-use format, this financial model template helps users make better decisions, communicate their plan more clearly, and build a more credible case for investors, lenders, partners, and stakeholders.



Financial Model Overview
The Sports Medicine Clinic Financial Model is a ready-to-use financial model template built to help founders, clinic operators, consultants, and analysts evaluate the economics of launching or expanding a sports medicine clinic. A sports medicine clinic typically depends on a combination of practitioner capacity, patient volume, treatment pricing, service mix, utilization, staffing, facility expenses, equipment investment, and reimbursement timing, so a simple revenue estimate is not enough for reliable planning. This model brings those drivers together into a structured forecast that can be edited for a specific location, business model, and growth strategy. It helps users estimate startup investment, forecast revenue, plan payroll and operating expenses, monitor cash flow, evaluate profitability, prepare funding discussions, and explain financial performance to lenders, investors, partners, and internal decision-makers. Whether the clinic focuses on physical therapy, sports physician consultations, diagnostic services, performance coaching, rehabilitation programs, or a combination of services, the model gives users a practical framework for turning assumptions into financial statements, dashboards, charts, and decision-ready outputs.
All-in-One Dashboard
The all-in-one dashboard gives users a centralized view of the most important inputs and outputs in the Sports Medicine Clinic Financial Model. Instead of switching between multiple tabs to understand whether the clinic is financially viable, users can review key assumptions and headline results in one place. The dashboard may include core drivers such as practitioner count, treatment capacity, utilization rates, average price per session, revenue by service category, operating expenses, EBITDA, cash balance, and break-even timing. It helps translate detailed spreadsheet calculations into a clear business snapshot that can be used during planning meetings, lender discussions, investor reviews, or internal decision sessions. For a sports medicine clinic, this is especially useful because the business is driven by both clinical capacity and commercial performance. A clinic may look promising based on demand, but if staffing, equipment, rent, insurance, and reimbursement cycles are not aligned with patient volume, profitability can take longer than expected. The dashboard helps users quickly see how changes in assumptions affect projected financial outcomes, making it easier to refine a launch plan, evaluate an expansion strategy, and communicate the clinic’s financial story with confidence.
Low, Base, and High Scenario Analysis
The low, base, and high scenario analysis component helps users test how the sports medicine clinic may perform under different operating conditions. A base case can represent the most realistic plan, while a low case can reflect slower patient acquisition, lower utilization, pricing pressure, higher costs, or delayed reimbursement, and a high case can represent stronger demand, better scheduling efficiency, faster referral growth, or successful expansion of higher-margin services. This type of scenario planning is important for a clinic because early performance can vary significantly depending on local competition, payer mix, physician referrals, marketing effectiveness, sports team partnerships, and practitioner productivity. The model allows users to compare outcomes such as revenue, gross margin, EBITDA, net profit, cash balance, funding needs, and break-even timing across different assumptions. This helps founders and advisors understand downside risk before committing capital, while also showing the upside potential if the clinic reaches stronger utilization and pricing targets. For funding conversations, scenario analysis can make the plan more credible because it shows that management has considered multiple outcomes rather than relying on a single optimistic forecast. It also supports contingency planning by helping users identify when they may need to reduce costs, adjust staffing, increase marketing, secure additional working capital, or revise service pricing.
Professional Charts
The professional charts component turns the financial forecast into visual outputs that are easier to review, explain, and present. A sports medicine clinic financial plan can include many moving parts, including patient volume, treatment sessions, consultation revenue, coaching packages, diagnostic services, salaries, rent, equipment costs, marketing expenses, cash flow, and profitability. Charts help simplify that complexity by displaying trends and relationships in a more accessible format. Users can use pre-built visual reports to show revenue growth over time, expense composition, EBITDA progression, cash balance movement, break-even timing, and other key financial metrics. These visuals are especially useful when preparing investor materials, lender presentations, board updates, or internal management reviews, because stakeholders often need to understand the overall direction of the business quickly. For example, a chart showing monthly cash balance can highlight the period when the clinic needs the most working capital, while a revenue chart can show how practitioner hiring and utilization improvements contribute to growth. The professional formatting also helps users avoid the common problem of sending raw spreadsheet tables that require too much interpretation. By converting detailed model outputs into clean charts, this section supports clearer communication, faster decision-making, and a more polished financial presentation.
ROE Components and DuPont Analysis
The ROE components and DuPont analysis section helps users understand what is driving the clinic’s return on equity rather than only looking at the final percentage. Return on equity can be influenced by profit margins, asset efficiency, and financial leverage, and the DuPont framework separates these drivers so users can see where performance is strong and where it may need improvement. For a sports medicine clinic, this can be particularly valuable because the business often requires meaningful upfront investment in build-out, medical equipment, rehabilitation gym equipment, technology, and working capital. The model can help users evaluate whether returns are being limited by weak margins, underused assets, high cost structure, slow revenue ramp-up, or financing choices. Inputs may include net income, revenue, total assets, equity, debt, and operational assumptions that affect profitability and asset usage. Outputs can help owners and investors assess whether the clinic is generating acceptable returns relative to the capital invested. This is useful for evaluating expansion decisions, investor expectations, debt capacity, and long-term financial performance. Rather than treating ROE as a static result, the model helps users explore the underlying mechanics of return generation, making it easier to identify whether better utilization, pricing changes, improved expense control, or a different funding structure could improve the clinic’s financial outlook.
Revenue Inputs
The revenue inputs component is where users define the commercial assumptions that drive the Sports Medicine Clinic Financial Model. For this type of business, revenue is commonly tied to the number of practitioners, monthly treatment capacity, practitioner utilization, service pricing, consultation volume, diagnostic appointments, and package-based performance coaching. Users can adjust assumptions for physical therapy sessions, sports physician consultations, diagnostic specialist services, rehabilitation programs, and coaching packages to reflect their own clinic strategy. Inputs may include the number of physical therapists or sports medicine practitioners, average sessions per month, utilization rate, price per treatment, growth in patient volume, new service launch timing, and expected changes in capacity as the clinic expands. The model then translates those assumptions into monthly and annual revenue projections. This section is useful because revenue in a clinic is not simply a single sales number; it depends on how many providers are available, how efficiently schedules are filled, how services are priced, and how quickly the clinic builds referral and repeat-patient demand. By making these assumptions editable and transparent, the model allows users to test whether their plan is realistic, compare different pricing strategies, evaluate the impact of hiring additional practitioners, and determine how much patient volume is needed to support the clinic’s cost structure.
Bank-Ready Reports
The bank-ready reports component provides organized financial outputs designed to support lender reviews, financing applications, partner discussions, and formal business planning. Banks and financing partners typically want to understand the clinic’s revenue build, expense structure, cash flow, profitability, debt repayment ability, and funding requirement before committing capital. This section helps users present those outputs in a clear format without having to rebuild statements manually. It may include projected income statements, cash flow statements, balance sheets, summary financial metrics, capital requirements, and debt-related outputs that help explain whether the clinic can support borrowing or investment. For a sports medicine clinic, this matters because lenders may need to see how startup costs such as build-out, medical equipment, rehabilitation equipment, software, licensing, insurance, and working capital are supported by future cash generation. The reports can also show when the business is expected to move from early operating losses to positive EBITDA and sustainable cash flow. Clean reporting helps users answer common lender questions about break-even timing, minimum cash balance, payroll obligations, facility costs, and revenue assumptions. By packaging the forecast into lender-friendly outputs, this component saves time, improves credibility, and helps users communicate the financial plan in a format that is easier for external stakeholders to review.
Revenue Breakdown
The revenue breakdown component provides a detailed view of how different services contribute to total clinic revenue. A sports medicine clinic may generate income from physical therapy sessions, sports physician consultations, diagnostic specialist services, performance coaching packages, injury prevention programs, athlete assessments, or other specialized services. Looking only at total revenue can hide important differences between these streams, such as pricing, capacity, utilization, margin contribution, and growth potential. This section helps users see which revenue streams are expected to be the largest, which services may contribute the most to profitability, and how the clinic’s service mix changes over time. Inputs can include price per service, expected volume, practitioner capacity, package sales, consultation frequency, diagnostic appointment rates, and service launch timing. Outputs may show monthly and annual revenue by category, percentage contribution by service line, and the relationship between service mix and overall financial performance. This is useful for planning because a clinic may need to decide whether to invest more heavily in rehabilitation equipment, hire additional therapists, add diagnostic capabilities, create coaching programs, or focus on referral-based medical consultations. By separating revenue streams, the model helps users evaluate growth strategy in a more precise way and identify which parts of the clinic deserve additional marketing, staffing, or operational attention.
KPI Dashboard
The KPI dashboard component helps users track performance metrics that are especially relevant to a sports medicine clinic. While financial statements show revenue, expenses, cash flow, and profit, key performance indicators help explain why those results are happening. This section may include metrics such as practitioner utilization, treatments per practitioner, average revenue per session, revenue per practitioner, gross margin, EBITDA margin, patient volume growth, operating expense ratio, payroll as a percentage of revenue, break-even progress, payback period, return on equity, and cash runway. These KPIs allow users to connect operational performance with financial outcomes. For example, if profitability is below target, the dashboard can help determine whether the issue is low utilization, high payroll, weak pricing, excessive facility costs, or an unbalanced service mix. The KPI dashboard is also useful for comparing actual performance against the plan once the clinic is operating. Management can update assumptions or actual results and use the dashboard to guide decisions about hiring, marketing spend, pricing, service expansion, scheduling, and cost control. For stakeholders, KPI reporting creates a concise way to understand the health of the business without reviewing every line of the financial model. It supports disciplined management and helps users focus on the metrics most likely to improve clinic performance.
Startup Costs and Operating Expense Planner
The startup costs and operating expense planner helps users estimate the investment required to launch the clinic and the recurring costs needed to keep it operating. A sports medicine clinic can involve substantial upfront spending, including facility build-out, treatment rooms, rehabilitation gym equipment, medical equipment, diagnostic tools, furniture, software, licenses, deposits, initial marketing, insurance setup, and working capital. This component organizes those costs so users can understand how much funding may be needed before the clinic begins generating enough revenue to cover expenses. It also helps forecast ongoing costs such as rent, utilities, salaries, benefits, medical supplies, malpractice insurance, billing support, administrative staff, software subscriptions, maintenance, marketing, professional services, and other overhead. Inputs can be customized to reflect clinic size, location, staffing model, equipment strategy, and launch timeline. Outputs may show one-time startup investment, monthly operating expense forecasts, fixed versus variable cost behavior, and the effect of cost assumptions on profitability and cash flow. This section is valuable because underestimating costs is one of the most common risks in clinic planning. By separating launch expenses from recurring operating expenses, the model helps users prepare a more accurate funding request, avoid early cash shortages, evaluate lease versus buy decisions for equipment, and build a budget that supports realistic growth.
Similar ProductsOther customers were also interested in...


 HenrySheykin
Tai Chi Center Financial Model Excel Template
The Martial Arts School Financial Model helps founders, school owners, consultants, and business pla... Read more

Mental Health Center Financial Model Excel Templat...
The Mental Health Clinic Financial Model helps users build a structured financial forecast for a the... Read more

Orthopedic Center Financial Model Excel Template
The Orthopedic Clinic Financial Model helps users build a structured five-year forecast for a capita... Read more
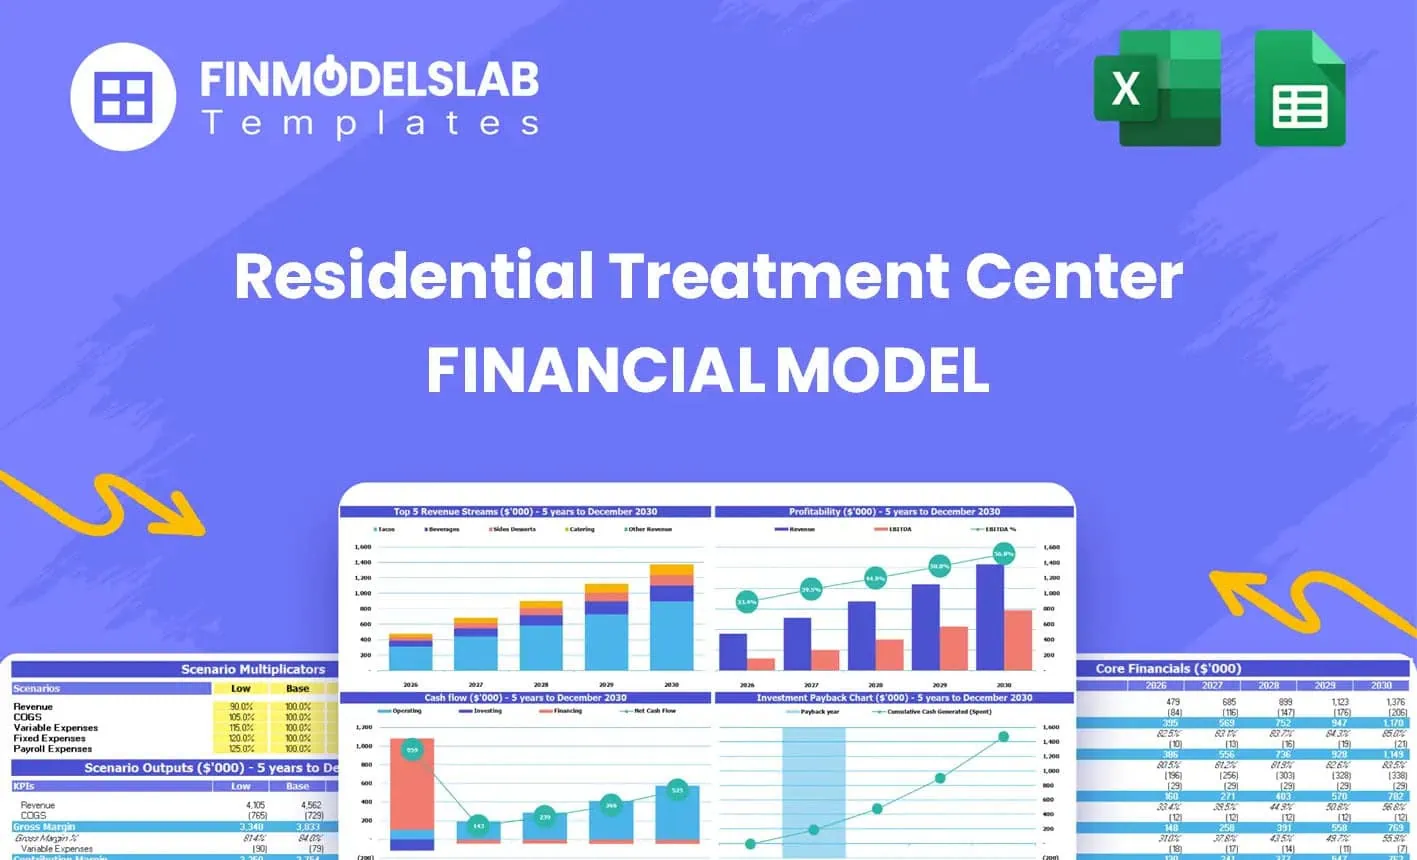
Drug Treatment Center Financial Model Excel Templa...
The Residential Treatment Center Financial Model helps users turn a live-in behavioral health, menta... Read more

Hypnotherapy Center Financial Model Excel Template
The Hypnotherapy Practice Financial Model helps users turn a wellness practice concept into a struct... Read more

Yoga Studio Financial Model Excel Template
The Yoga Studio Financial Model helps entrepreneurs, founders, studio owners, consultants, and finan... Read more

Weight Loss Center Financial Model Excel Template
The Weight Loss Center Financial Model helps entrepreneurs, clinic owners, consultants, and analysts... Read more

Dance Studio Financial Model Excel Template
The Dance Studio Financial Model Financial Model Template helps entrepreneurs, studio owners, consul... Read more

Osteopathic Center Financial Model Excel Template
The Holistic Health Center Financial Model helps entrepreneurs, founders, consultants, analysts, and... Read more

Oriental Medicine Center Financial Model Excel Tem...
The Traditional Chinese Medicine Clinic Financial Model helps entrepreneurs, clinic owners, consulta... Read more
You must log in to submit a review.