Performance Tracker: Car Salesperson (with Excel and Google Sheet version)
This is a tool designed to help car salespeople. The template helps keep track of leads within the sales pipeline as well as producing reports for win rate/sales by a variety of slicers and metrics. Available in Excel/Google Sheets.

Video Tutorial:
This template is built in Excel, but there is also a Google sheet version (requires a Gmail account, and the link is on the “instruction” tab) to use. the Excel version requires Office 365 and enrollment in the ‘insiders’ program because it uses filter functions.
The style of this workbook is simple. You have a ‘data’ tab where new leads are entered. On that tab, there is a column with the ‘status’ type, and based on that, various other tabs will populate relevant data to help leads be tracked no matter where they are in the sales process.
The 4 stages (which the names of can be changed) are: Called, Appointment Set, Follow Up, and Long Term. Anything marked as ‘Sold’ or ‘Lost’ will not show up in the pipeline.
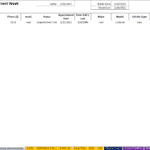
Any lead marked as ‘Appointment Set’ will populate on the ‘Upcoming Appointments’ tab dynamically as you move through time based on any lead with a date within the current week and that pipeline status.
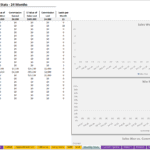
The monthly stats tabs will show 24 months at a time by month. The 24-month total will also display. Stats by month include: wins / losses / $sold / $commissions / $lost / $commission lost. Everything auto-updates as data is entered, including the charts/visuals for those stats.
There is an aggregate monthly stats tab, as well as 4 that can be filtered by car make, 1 that is for filtering by car type, and 1 for car type + make. The by ‘make’ and by ‘car type’ tabs can be duplicated by right-clicking the tab and copying it if you want reports that are more than what is there (a dropdown is at the top to select a different make/type).
Also, the start month can be changed to any month. Make sure the month entered is always the first day of that month.
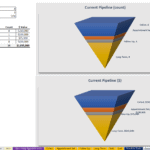
Finally, there is a pipeline snapshot with some cool visuals that show the total count of leads and the $ value of those leads in each pipeline status based on what has been entered in the ‘data’ tab. This visual took a LONG time to get right.
Similar Products
Other customers were also interested in...
Online Car Rental – 3 Statement Financial Mo...
Online Car Rental Platform Business Plan Model is a perfect tool for a feasibility study on launchin... Read more
Auto Parts Store – 5 Year Financial Model
This Financial Model Template provides an advanced 5-year financial plan for a startup or operating ... Read more
Retail Business Financial Model
The Retail Financial Plan is an all-inclusive financial planning template for the retail industry. W... Read more
Car Dealership Financial Model – Dynamic 10 Year...
A car dealership, or car dealer, is a business that sells new or used cars, at the retail level, bas... Read more
Pawn Shop / Broker 5 Year Financial Model
Video Tutorial: https://www.youtube.com/watch?v=3mZFMB4z0Qc The model have revenue a... Read more
Subscription Box Financial Model – Up to 72 ...
Test many variables in this financial model for a subscription box company. Includes up to six prici... Read more
Hair Salon Financial Plan | Beauty Salon Business ...
Plan out the financial plan your hair or beauty salon. The beauty & hair salon business plan goe... Read more
Industry Based Financial Models (Variety Bundle)
There are currently 52 unique financial models included in this bundle. Nearly all of that include a... Read more
Services Industry Financial Model Bundle
Bundle of financial model templates for Service Industry businesses and its related sectors such as ... Read more
Jewelry Shop / Store 5 Year Startup Business Model
A bottom-up financial model that is designed specifically for a jewelry store, but could easily be u... Read more
You must log in to submit a review.


