
0 ITEMS

Mobile Spa Salon Financial Model Excel Template
The Mobile Spa Financial Model Template helps users turn a mobile beauty and wellness business idea into a structured five-year financial forecast. Instead of building a spreadsheet from scratch, entrepreneurs and planners can work from a ready-to-use model designed around the operating realities of a mobile spa, including service pricing, daily appointment volume, service mix, therapist staffing, vehicle-related costs, supplies, marketing, and recurring operating expenses. It supports financial planning by connecting revenue assumptions, startup costs, operating expenses, payroll, cash flow, profitability, and funding needs in one editable framework. This template is built for mobile spa founders, salon and wellness business owners, consultants, analysts, and anyone preparing a business plan, loan application, investor presentation, or internal budget. Users can enter their own assumptions, review projected profit and loss, cash flow, balance sheet outputs, and evaluate whether the business can support its growth plan. It is useful for both first-time entrepreneurs validating a mobile massage or spa concept and established operators considering a new mobile service line, additional vehicles, or expanded appointment capacity. The model helps users understand the relationship between bookings, pricing, cost of goods sold, labor, fuel, marketing, and profitability. It can be used to test how different customer volumes, service packages, add-ons, and retail product sales affect revenue and margins. It also helps estimate how much capital may be required before launch, how monthly cash balances may change as the business ramps up, and when the company may reach break-even. This makes the template practical for decision-making before committing money to vehicles, equipment, inventory, hiring, and marketing. With built-in reports, dashboards, charts, and scenario analysis, the Mobile Spa Financial Model Template gives users a clear way to communicate financial expectations to partners, lenders, investors, or internal stakeholders. The model is editable, presentation-ready, and compatible with Excel and Google Sheets, making it suitable for ongoing planning as assumptions change. By organizing the key financial drivers of a mobile spa business, it helps users make more confident decisions about pricing, staffing, cash flow management, profitability targets, and long-term business viability.
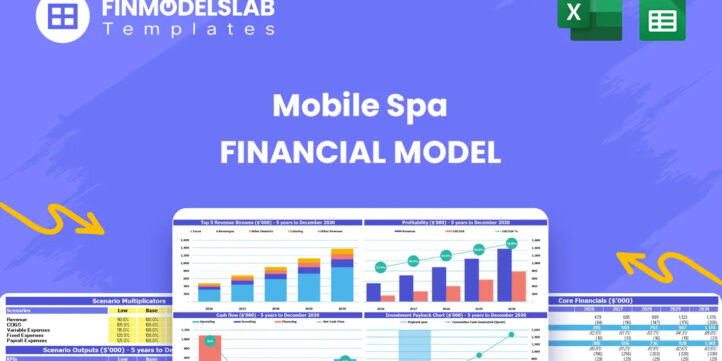


Financial Model Overview
The Mobile Spa Financial Model Template is a ready-to-use financial planning tool designed for entrepreneurs, mobile wellness operators, consultants, analysts, and business owners who need a structured way to forecast the performance of a mobile spa business. A mobile spa has a different cost structure from a fixed-location salon because revenue depends on appointments, travel efficiency, therapist availability, vehicle capacity, service mix, add-ons, group bookings, and route-related expenses. This template brings those assumptions into one organized model so users can estimate startup costs, forecast revenue, plan operating expenses, review cash flow, evaluate profitability, and prepare professional outputs for lenders, investors, partners, or internal decision-making. The model is built to support up to five years of projections and is designed to be editable, allowing users to replace default assumptions with their own pricing, service volume, payroll, equipment, vehicle, marketing, and funding details. Instead of guessing whether the business can generate enough revenue to cover costs and reach profitability, users can input practical assumptions and review the financial impact across profit and loss, cash flow, balance sheet, break-even, payback, and return metrics. For a mobile spa startup, this is especially useful because launch decisions such as buying vehicles, hiring therapists, purchasing spa equipment, investing in branding, and setting service prices can have a major impact on cash requirements and long-term profitability.
All-in-One Dashboard
The all-in-one dashboard gives users a central view of the most important inputs and outputs in the Mobile Spa Financial Model Template. This section is designed to simplify the planning workflow by connecting the core assumptions entered into the model with the main financial results users need to review. Inputs may include service pricing, appointment volume, operating days, service mix, add-on sales, staffing costs, vehicle costs, supplies, marketing, startup investment, and financing assumptions. Outputs may include five-year revenue, gross profit, EBITDA, net income, cash position, break-even timing, payback period, and return metrics. For a mobile spa business, this dashboard is useful because it helps users quickly see whether the business plan is financially realistic before reviewing the detailed schedules. It allows founders and advisors to check the effect of changes in daily visits, average service price, therapist compensation, fuel costs, or marketing spend without losing sight of overall financial performance. The dashboard also helps during investor or lender conversations because it provides a clean summary of the business case, making it easier to explain how revenue is generated, how costs are controlled, and what financial outcomes are expected over time.
Low, Base, and High Scenario Analysis
The low, base, and high scenario analysis section helps users test the Mobile Spa Financial Model under different business conditions. A mobile spa can perform very differently depending on appointment ramp-up, customer acquisition success, local demand, seasonality, corporate wellness bookings, event packages, pricing power, and staff utilization. This component allows users to compare a conservative case, a realistic base case, and an upside case using adjustable assumptions. Inputs may include daily visits, operating days, average pricing, service mix, revenue growth, marketing effectiveness, labor needs, product costs, fuel expenses, and expansion timing. The outputs show how each scenario affects revenue, operating profit, cash flow, break-even, funding needs, and staffing requirements. This is valuable for planning because it helps users understand the financial consequences of slower-than-expected demand or better-than-expected growth. A low scenario can highlight cash flow risks and the need for a funding buffer, while a high scenario can show when additional therapists, vehicles, inventory, or administrative support may be required. For founders preparing a business plan or investor pitch, scenario analysis adds credibility because it shows that the plan has been stress-tested rather than relying on a single optimistic forecast.
Professional Charts
The professional charts section converts key financial outputs into visual reports that are easier to review, present, and explain. Financial models often contain many assumptions and linked calculations, but decision-makers usually need clear visuals that communicate trends quickly. This component may include charts for revenue growth, expense trends, gross profit, EBITDA, net income, cash balances, margin progression, startup investment, and performance over the forecast period. For a mobile spa business, these visuals can show how appointment volume and service mix translate into revenue, how operating costs scale as the business grows, and how profitability improves as fixed costs are spread across more bookings. The charts are useful for business plans, funding decks, management meetings, and monthly performance reviews because they help users identify patterns that may not be obvious from rows of numbers alone. For example, a chart may show whether profitability depends too heavily on aggressive growth, whether cash dips occur during the launch phase, or whether expenses rise faster than revenue. By presenting financial results in a polished and accessible format, this section helps users communicate the mobile spa opportunity more professionally to lenders, investors, partners, and advisors.
ROE Components and DuPont Analysis
The ROE components and DuPont analysis section helps users evaluate the drivers behind return on equity rather than looking only at a single return figure. Return on equity is important for investors and owners because it shows how effectively the business uses invested capital to generate profit. A DuPont-style view breaks this return into underlying components, which may include profitability margin, asset efficiency, and financial leverage. In the context of a mobile spa, these drivers can be influenced by service margins, appointment utilization, vehicle productivity, equipment investment, debt financing, retained earnings, and cost management. Users can input or adjust assumptions that affect net income, assets, equity, and financing structure, then review how those changes influence return performance over the forecast period. This component is useful because it helps users understand whether returns are being driven by strong operating profitability, efficient use of vehicles and equipment, or increased leverage. For investors, it provides a more sophisticated view of business performance. For founders, it helps identify practical improvement areas such as increasing premium service sales, improving therapist productivity, reducing idle vehicle time, controlling operating costs, or optimizing the mix of debt and equity funding.
Revenue Inputs
The revenue inputs section is one of the most important parts of the Mobile Spa Financial Model Template because it defines how the business generates income. A mobile spa typically earns revenue from services such as massages, facials, group packages, private events, add-ons, and retail product sales. This component allows users to enter assumptions for pricing, appointment volume, operating days, daily visits, service mix, package sales, add-on penetration, and potential growth over time. It may also allow users to adjust assumptions by year or scenario so the business can be modeled as it ramps from launch to a more mature operating level. Outputs from this section flow into the revenue forecast, profitability calculations, cash flow forecast, and performance dashboards. This is useful because even small changes in pricing, visit count, or service mix can materially affect revenue and margins. For example, increasing premium services or add-ons can improve average transaction value, while a slower appointment ramp-up may delay break-even and increase cash requirements. By making revenue assumptions transparent and editable, the model helps users build a forecast that reflects their target market, operating capacity, and customer acquisition strategy instead of relying on generic sales estimates.
Bank-Ready Reports
The bank-ready reports section provides structured financial outputs that can support loan applications, investor discussions, and formal business planning. Lenders and investors typically want to see more than a revenue estimate; they need a complete view of projected profitability, liquidity, assets, liabilities, and capital needs. This component helps generate professional reports such as the profit and loss statement, cash flow statement, balance sheet, and summary financial outputs. Inputs from the rest of the model, including revenue assumptions, payroll, operating expenses, startup costs, capital expenditures, financing, taxes, and working capital, flow into these reports automatically. For a mobile spa, these reports help explain how the business will fund vehicles and equipment, manage monthly expenses, generate enough sales to cover labor and supplies, and maintain cash through the launch period. This section is especially useful for founders seeking small business loans, equipment financing, lines of credit, or investor capital because it presents the numbers in a format stakeholders are familiar with. It also helps users answer due diligence questions about margins, cash flow, debt service capacity, profitability timeline, and long-term financial viability.
Revenue Breakdown
The revenue breakdown section gives users a detailed view of how different income streams contribute to total sales. Rather than showing only one revenue line, this component separates the business into its key revenue categories, such as standard massages, deluxe facials, group packages, private events, add-ons, and retail product sales. Inputs may include the percentage mix of each service type, average price by service, number of bookings, package frequency, product attachment rates, and growth assumptions. Outputs show the contribution of each revenue stream to monthly or annual sales, helping users understand which services drive the most revenue and which may offer the strongest margins. For a mobile spa business, this is useful because not all services perform the same way financially. A premium facial, corporate wellness package, or group event may produce higher revenue per visit than a single standard appointment, while retail add-ons may improve profitability without requiring much additional travel time. The breakdown helps users refine pricing, decide which services to promote, plan inventory, and identify the best opportunities for growth. It also helps create a more convincing business plan because stakeholders can see the specific sources of revenue rather than relying on a single broad sales assumption.
KPI Dashboard
The KPI dashboard provides a performance-focused view of the metrics that matter most when managing or evaluating a mobile spa business. While financial statements show overall results, key performance indicators help users understand the operational drivers behind those results. This component may track metrics such as appointment volume, average revenue per visit, revenue growth, gross margin, EBITDA margin, net profit margin, cash balance, break-even status, payback period, return on equity, and other performance benchmarks. It may also help compare projected results against industry standards or internal targets so users can judge whether assumptions are realistic. For a mobile spa, KPI tracking is especially helpful because day-to-day performance depends on both sales activity and operational efficiency. Strong revenue may not translate into profit if travel time, fuel costs, product usage, therapist compensation, or marketing spend are too high. The KPI dashboard gives users a concise way to monitor business health, identify weak spots, and make informed decisions about pricing, staffing, marketing, and expansion. It is also useful for stakeholder updates because it provides a clear snapshot of whether the business is on track financially and operationally.
Startup Cost and Funding Requirements
The startup cost and funding requirements section helps users estimate the initial capital needed to launch the mobile spa before revenue begins to ramp up. A mobile spa may require investment in vehicles, spa treatment equipment, massage tables, facial equipment, towels and linens, product inventory, uniforms, booking software, branding, website development, licenses, insurance, deposits, initial marketing, and working capital. This component organizes those costs into a structured launch budget so users can see the total amount required and identify which expenses are one-time setup costs versus recurring operating expenses. It may also allow users to model different funding sources, such as owner equity, investor capital, bank loans, equipment financing, or lines of credit. The outputs help estimate the opening cash position, funding gap, debt balances, and potential financing needs. This is useful because underestimating startup costs is one of the most common risks for service-based startups. For a mobile spa, vehicle and equipment decisions can significantly affect both upfront investment and ongoing cash flow. By planning startup costs carefully, users can approach lenders or investors with a more realistic funding request and avoid launching with insufficient cash reserves.
Break-Even and Payback Analysis
The break-even and payback analysis section helps users understand when the Mobile Spa Financial Model projects the business will become self-sustaining and when the initial investment may be recovered. Break-even analysis typically compares revenue against fixed costs, variable costs, payroll, supplies, fuel, marketing, rent or storage, software, insurance, and other operating expenses to determine the point at which the business covers its costs. Payback analysis estimates how long it may take for cumulative cash flows or profits to recover the startup investment. Inputs that affect this section may include appointment volume, pricing, service margins, staffing levels, startup costs, operating expenses, financing terms, and revenue growth. Outputs may include break-even month, break-even revenue, required appointment volume, payback period, and sensitivity to key assumptions. This component is useful for decision-making because it shows whether the mobile spa can realistically reach profitability within an acceptable timeframe. It also helps users identify actions that may accelerate break-even, such as improving pre-bookings, increasing average order value, promoting high-margin add-ons, optimizing routes, controlling payroll, and reducing launch costs.
File types:
Excel – Single-User: .xlsx
Excel – Multi-User: .xlsx
Similar ProductsOther customers were also interested in...

 HenrySheykin
Spa Financial Model Excel Template
The Spa Financial Model helps entrepreneurs, spa owners, consultants, analysts, and business planner... Read more
Nail Salon Financial Model Excel Template
The Nail Salon Financial Model Financial Model Template helps entrepreneurs, salon owners, consultan... Read more

Beauty Salon Financial Model Excel Template
The Beauty Salon Financial Model helps entrepreneurs, salon owners, consultants, analysts, and found... Read more

Hair Salon Financial Model Excel Template
The Hair Salon Financial Model helps salon owners, founders, consultants, and business planners turn... Read more

Tattoo Parlor Financial Model Excel Template
The Tattoo Studio Financial Model helps entrepreneurs, studio owners, consultants, analysts, and bus... Read more

Tanning Salon Financial Model Excel Template
The Tanning Salon Financial Model helps entrepreneurs, salon owners, consultants, analysts, and busi... Read more

Sauna Financial Model Excel Template
The Sauna Financial Model helps entrepreneurs, founders, consultants, analysts, and wellness busines... Read more

Mobile Massage Salon Financial Model Excel Templat...
The Mobile Massage Financial Model Template helps entrepreneurs, founders, consultants, analysts, an... Read more

Massage Salon Financial Model Excel Template
The Massage Salon Financial Model helps entrepreneurs, salon owners, consultants, analysts, and busi... Read more

Makeup Salon Financial Model Excel Template
The Makeup Salon Financial Model helps entrepreneurs, salon founders, consultants, analysts, and bus... Read more
You must log in to submit a review.