
0 ITEMS

Industrial Acquisition REFM Financial Model Excel Template
The Real Estate Acquisition Financial Model Financial Model Template helps investors, developers, analysts, consultants, and acquisition teams evaluate a property purchase or development opportunity with a structured underwriting framework. Instead of starting with a blank spreadsheet, users can work from a ready-to-use model designed around the realities of acquisition pricing, construction or remodeling costs, financing, sale timing, operating expenses, and project returns. It supports financial planning for buy-fix-sell, build-sell, remodeled unit sale, and broader property acquisition strategies where revenue is driven by eventual asset sales rather than recurring rental income. This template is useful for entrepreneurs, real estate business owners, founders, investment analysts, brokers, lenders, and advisors preparing business plans, investor presentations, funding documents, or internal approval materials. It brings together revenue assumptions, startup costs, capital expenditures, payroll, overhead, debt service, cash flow, profitability, and return metrics in one editable model. Users can adjust acquisition costs, development timelines, sale prices, financing terms, staffing needs, and operating expense assumptions to reflect a specific deal, portfolio, or market scenario. The model is built to help users understand both the upside and the risks of a real estate acquisition. Because property development and resale strategies often require significant cash investment before revenue is realized, the template places strong emphasis on liquidity, funding needs, monthly cash flow, and break-even analysis. It helps identify when the business may become profitable, how much capital may be required before sales proceeds arrive, and how changes in pricing, construction cost, or project timing can affect investor returns. Designed for practical decision-making, the Real Estate Acquisition Financial Model Financial Model Template includes professional outputs that can support lender conversations, investor review, board discussions, and acquisition committee analysis. Its editable assumptions, visual charts, KPI summaries, revenue breakdowns, and scenario planning features make it easier to compare cases, defend projections, and decide whether a deal is financially viable. Whether used for a single acquisition, a development project, or a pipeline of property opportunities, it provides a clear financial planning structure for evaluating profitability, cash flow, funding requirements, and long-term project performance.
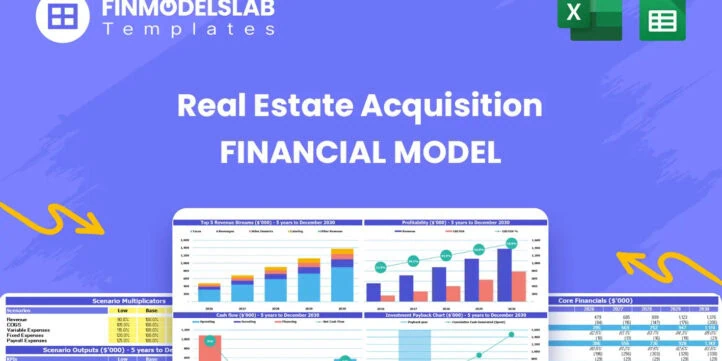


Financial Model Overview
The Real Estate Acquisition Financial Model Financial Model Template gives buyers, investors, developers, consultants, and analysts a structured way to underwrite a property acquisition before committing capital. It is designed for acquisition and development strategies where value is created through buying, remodeling, building, improving, and selling real estate assets, rather than relying primarily on recurring rental income. The model helps users connect acquisition price, construction or renovation cost, sale timing, debt service, operating overhead, payroll, cash flow, break-even timing, and investor returns in one organized forecast. This makes it useful for preparing business plans, funding documents, lender packages, investor presentations, and internal decision materials. Because real estate acquisition projects can involve large upfront cash outflows followed by delayed and uneven revenue events, the template places strong emphasis on liquidity planning, scenario analysis, profitability timing, and capital requirements. Users can update the assumptions to match a specific property, portfolio, market, financing structure, or exit strategy, allowing the model to support both early deal screening and more detailed underwriting.
All-in-One Dashboard
The all-in-one dashboard brings the most important inputs and outputs into a single control view so users can quickly understand the financial position of a real estate acquisition opportunity. This section is designed to summarize core assumptions such as acquisition price, development or remodeling costs, sale values, project timing, financing assumptions, operating expenses, and equity requirements, while also displaying key outputs such as revenue, profit, cash flow, return metrics, and funding gaps. For buyers and stakeholders, the dashboard is valuable because it reduces the need to move through multiple tabs just to understand whether a deal appears viable. It can help users review the overall investment case, compare planned assumptions against expected outcomes, and identify areas that require deeper analysis. For lenders and investors, a clean dashboard also provides a fast executive summary of the transaction, showing how the project is expected to perform from purchase through exit. In practical use, this component supports deal screening, acquisition committee review, investor conversations, and management decision-making by turning a complex underwriting model into a focused summary of the opportunity.
Low Base High Scenario Analysis
The Low Base High scenario analysis section allows users to test how the acquisition performs under different market and execution conditions. Real estate acquisition projects are sensitive to sale prices, construction costs, project delays, financing terms, absorption speed, and exit timing, so this section helps users move beyond a single fixed forecast. The low case may reflect conservative assumptions such as higher costs, slower sales, lower exit pricing, or delayed completion, while the base case can represent the expected plan and the high case can show upside potential under stronger pricing, faster sales, or more efficient execution. By adjusting key assumptions across these cases, users can evaluate how revenue, margins, cash flow, IRR, ROE, payback period, and funding requirements change. This is especially useful when presenting to investors or lenders because it demonstrates that the sponsor has considered risk rather than relying only on an optimistic projection. The scenario section supports better decision-making by showing whether a project remains financeable under pressure, how much capital reserve may be needed, and which assumptions have the greatest effect on final returns.
Professional Charts
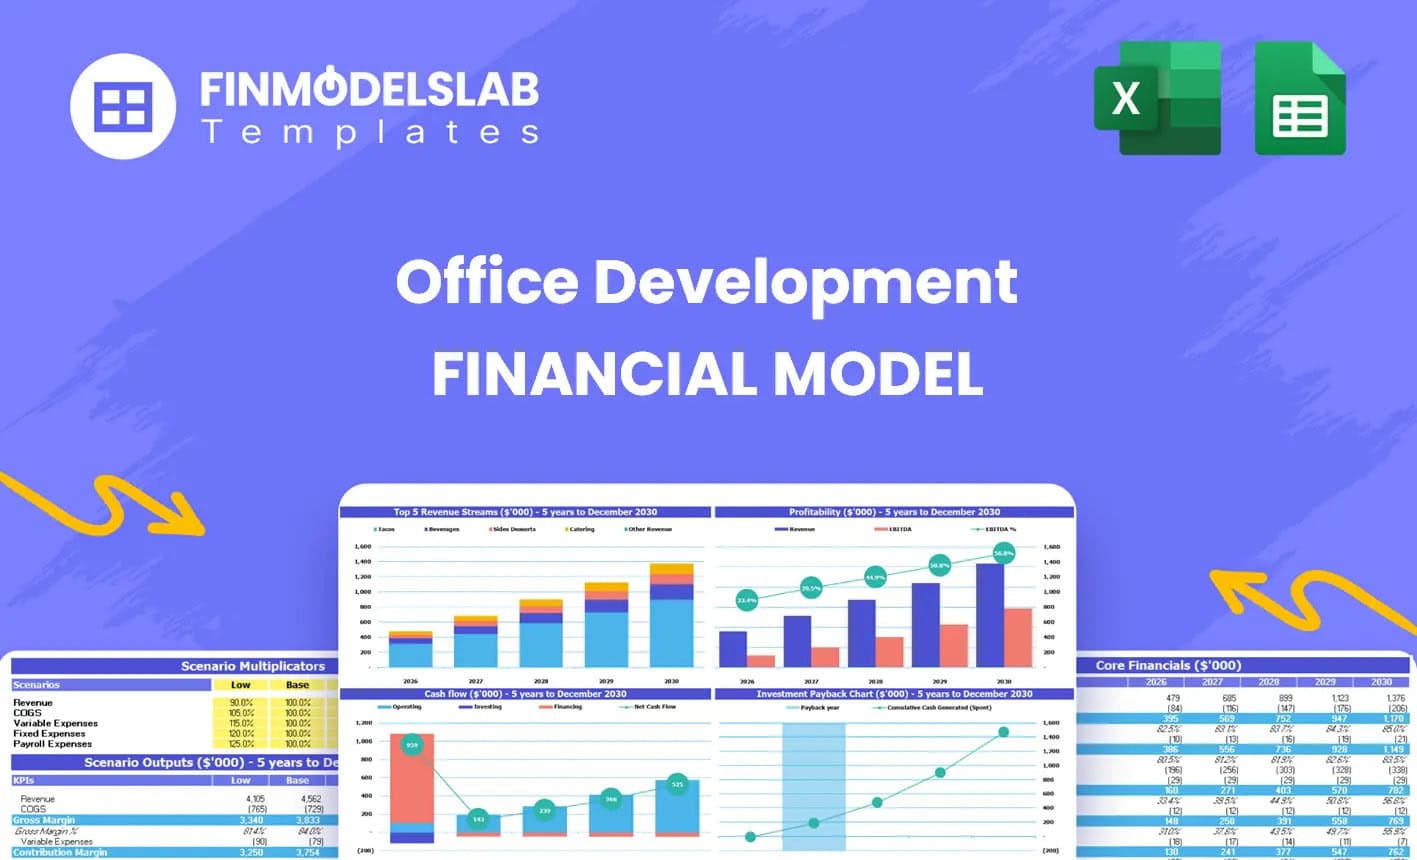
The professional charts section converts the model’s financial outputs into visual reports that are easier to understand and present. Real estate acquisition forecasts often include large amounts of monthly and annual data, including acquisition spending, development costs, revenue recognition, debt service, cash balances, EBITDA, profit, and return metrics. Charts help turn this data into a clearer story by showing trends, timing, risk points, and financial milestones. Users can use visual outputs to display when major cash outflows occur, when revenue from property sales is expected, how profitability develops over the forecast period, and how different scenarios compare. This component is useful for pitch decks, lender discussions, partner meetings, and internal approvals because many stakeholders need a concise picture of the deal before reviewing detailed schedules. The charts also help users spot issues faster, such as a prolonged negative cash position, a late break-even point, margin compression, or a return profile that does not meet investor expectations. By providing presentation-ready visuals, the template helps users communicate the acquisition plan in a more polished and professional way.
ROE Components and DuPont Analysis
The ROE components and DuPont analysis section helps users understand the drivers behind return on equity rather than looking only at a final return figure. In a real estate acquisition model, equity returns can be affected by profit margin, asset efficiency, leverage, financing costs, sale timing, and the relationship between invested equity and total project value. This component breaks down return performance into more detailed elements so users can see whether equity return is being created through strong margins, efficient capital deployment, leverage, or a combination of factors. Inputs may include net income, revenue, asset values, equity investment, debt balances, and financing assumptions, while outputs can include ROE, leverage effects, margin indicators, and supporting ratios. This is useful for investor analysis because two projects may show similar headline returns but have very different risk profiles. A project dependent on excessive leverage may be less attractive than one supported by stronger operating margins or disciplined acquisition pricing. By using ROE component analysis, users can better explain what is driving investor returns and determine where changes to the deal structure could improve the investment case.
Revenue Inputs
The revenue inputs section allows users to define the assumptions that drive projected income from the sale of developed, remodeled, or improved properties. For this type of real estate acquisition model, revenue is typically generated from asset sales rather than recurring rental income, so timing, price, unit mix, sales velocity, and exit value become critical drivers. Users can enter assumptions for the sale of developed land, completed buildings, remodeled units, condominium units, or other property assets depending on the deal structure. The section may include inputs for expected sale price, number of units or assets sold, sales schedule, completion timing, market appreciation, and any discounts or timing adjustments. These assumptions feed directly into revenue projections, cash flow, profitability, and return metrics. The revenue input section is especially important because many real estate acquisition projects experience large and uneven income events, with significant costs incurred before any sale proceeds are received. By organizing the revenue assumptions clearly, the model helps users test whether the proposed exit value is realistic, whether the sale timing supports liquidity needs, and whether the overall deal can generate sufficient profit to justify the required capital.
Bank-Ready Reports
The bank-ready reports section produces lender-friendly financial outputs that help users communicate the acquisition plan in a format suitable for financing discussions. Real estate acquisition projects often require debt financing, construction loans, bridge loans, or other credit facilities, and lenders need to understand the borrower’s capital plan, repayment capacity, collateral value, cash flow timing, and downside risk. This section can summarize key financial statements, projected cash flow, debt service, funding needs, profitability, and return metrics in a clean reporting format. It helps users present the project professionally when applying for financing or negotiating loan terms. Inputs such as loan amount, interest rate, fees, repayment schedule, draw timing, and equity contribution can be reflected in the reports, allowing lenders to see how debt fits within the overall project economics. The output may also support conversations around loan-to-cost, loan-to-value, required reserves, minimum equity contribution, and debt coverage expectations. By providing organized financial reports, the template helps users avoid fragmented spreadsheets and gives banks, private lenders, and capital partners a clearer view of how the deal is expected to perform.
Revenue Breakdown
The revenue breakdown section provides a more detailed view of how total projected income is generated across property types, units, assets, sale events, or project phases. While the revenue inputs define the assumptions, this component helps users see the composition of revenue over time. For example, a project may include several remodeled units, a completed building sale, a phased condominium sellout, or multiple asset dispositions. The revenue breakdown can show how each stream contributes to the total forecast, when each stream is expected to occur, and which sale events have the greatest impact on cash flow and profitability. This is useful because real estate acquisition and development projects can appear profitable in total while still carrying major timing risks. If most revenue is concentrated late in the forecast, the project may require more interim financing and may be more exposed to market changes. By reviewing the revenue breakdown, users can evaluate whether the sales plan is balanced, whether projected pricing assumptions are defensible, and whether the model depends too heavily on one large exit event. This section supports better planning, investor communication, and risk review by making the revenue structure transparent.
KPI Dashboard
The KPI dashboard summarizes the key performance indicators that matter most when assessing a real estate acquisition opportunity. Instead of focusing only on total profit, this section can display metrics such as IRR, ROE, equity multiple, payback period, gross margin, EBITDA, cash-on-cash return, project margin on cost, peak funding need, break-even timing, debt exposure, and cash balance trends. These KPIs help users evaluate both profitability and risk. A deal may generate a large profit in absolute dollars but still produce a weak return if it requires too much equity, takes too long to complete, or creates severe negative cash flow before exit. The KPI dashboard makes these trade-offs easier to see by showing the most important results in one performance-focused area. It can also help users compare multiple acquisition opportunities using consistent metrics, which is valuable for investors, developers, consultants, and acquisition teams managing a pipeline of deals. For funding and presentation purposes, the KPI dashboard provides stakeholders with a concise view of financial performance and helps answer whether the project meets the required return threshold, risk tolerance, and capital strategy.
Break-Even Analysis
The break-even analysis section helps users identify when the real estate acquisition project is expected to recover its accumulated costs and begin generating positive cumulative profit. This is particularly important for acquisition, remodeling, and development strategies because the project may operate at a loss for an extended period while capital is being deployed into property purchases, construction, soft costs, financing, overhead, and staffing. Inputs that influence break-even timing may include acquisition cost, construction budget, operating expenses, payroll, financing costs, sale price, sales velocity, and project completion schedule. The output helps users understand the month or year in which cumulative revenue and profit are sufficient to offset prior losses and investment outlays. This section is useful for planning because it highlights how long investors and lenders may need to support the project before it becomes financially self-sustaining. It also helps users test whether faster sales, lower costs, higher exit pricing, or reduced overhead could accelerate the break-even point. For decision-making, break-even analysis provides a clear milestone that can be used to assess risk, funding duration, capital reserve needs, and the feasibility of the proposed acquisition strategy.
Funding Requirements and Debt Service
The funding requirements and debt service section helps users estimate how much capital may be needed to complete the acquisition and carry the project through to sale. Real estate acquisition opportunities often require a combination of equity, debt, construction financing, bridge funding, and reserves, so understanding the timing and size of capital needs is essential. This component can account for acquisition price, closing costs, construction or renovation costs, soft costs, startup costs, working capital, operating expenses, loan proceeds, interest, fees, repayments, and refinancing or exit proceeds. It helps users identify peak cash requirement, monthly funding gaps, minimum cash balance, and the amount of equity or debt required to keep the project solvent. Debt service assumptions may include interest rate, loan term, draw schedule, repayment timing, interest-only periods, and financing fees, allowing users to see how borrowing affects profitability and cash flow. This section is useful for preparing lender packages, negotiating financing terms, planning investor contributions, and avoiding undercapitalization. By showing the relationship between capital sources, project spending, and future sales proceeds, the template helps users determine whether the deal can be funded responsibly and whether the proposed capital structure supports the intended return profile.
File types:
Excel – Single-User: .xlsx
Excel – Multi-User: .xlsx
Similar ProductsOther customers were also interested in...


 HenrySheykin
Retail Acquisition REFM Financial Model Excel Temp...
The Real Estate Acquisition Financial Model Financial Model Template helps investors, developers, an... Read more
Hotel Acquisition REFM Financial Model Excel Templ...
The Hotel Acquisition Financial Model helps buyers, investors, developers, consultants, and analysts... Read more
Retail Development REFM Financial Model Excel Temp...
The Retail Development Financial Model Financial Model Template helps users evaluate the financial f... Read more
Office Acquisition REFM Financial Model Excel Temp...
The Real Estate Acquisition Financial Model Financial Model Template helps investors, developers, an... Read more
Industrial Development REFM Financial Model Excel ...
The Industrial Development Financial Model helps users evaluate a capital-intensive industrial prope... Read more
Condominium Development REFM Financial Model Excel...
The Condo Development Financial Model helps developers, investors, analysts, consultants, and busine... Read more
Bed And Breakfast Financial Model Excel Template
The Bed and Breakfast Financial Model is a ready-to-use financial model template built to help entre... Read more
Self Storage Development REFM Financial Model Exce...
The Self-Storage Development Financial Model is a ready-to-use financial model template designed to ... Read more
Real Estate Agency Financial Model Excel Template
The Real Estate Brokerage Financial Model Financial Model Template helps users build a structured fo... Read more
Office Development REFM Financial Model Excel Temp...
The Office Development Financial Model Financial Model Template helps users evaluate a commercial of... Read more
You must log in to submit a review.