
0 ITEMS

B2B Financial Model Excel Template
The B2B Business Financial Model Financial Model Template helps entrepreneurs, founders, consultants, analysts, and business owners turn a B2B business plan into a structured five-year financial forecast. Instead of starting with a blank spreadsheet, users can work from a ready-to-use model that connects revenue assumptions, customer acquisition, repeat purchases, product mix, cost of goods sold, payroll, startup costs, operating expenses, cash flow, and profitability in one organized planning tool. Built for business planning, investor discussions, bank submissions, and internal decision-making, this template gives users a practical way to test whether a B2B business can scale profitably. The model is designed around editable assumptions, allowing users to adjust pricing, marketing spend, customer acquisition cost, retention, sales mix, supplier costs, capital investments, staffing, and overhead. As assumptions change, the forecast updates to show the effect on revenue growth, margins, EBITDA, cash balances, funding needs, and long-term financial performance. The template is especially useful for people preparing business plans, pitch decks, loan applications, investor updates, or strategic growth plans. It includes core financial statements and visual reporting outputs that help explain the business case clearly to stakeholders. Users can review projected profit and loss, cash flow, balance sheet movement, and key performance indicators while also comparing different operating outcomes through scenario analysis. This makes it easier to understand risks, upside potential, and the financial levers that matter most. For a B2B operation, decisions around customer acquisition, repeat purchasing, product category margins, payroll, supplier costs, and working capital can materially affect financial results. This financial model template helps organize those decisions into a clear forecasting framework so users can plan launch capital, assess operating expenses, monitor cash flow, review profitability, estimate break-even timing, and make better decisions before committing resources. It is fully editable, compatible with Excel and Google Sheets, and structured to save time while producing professional, investor-ready financial outputs.
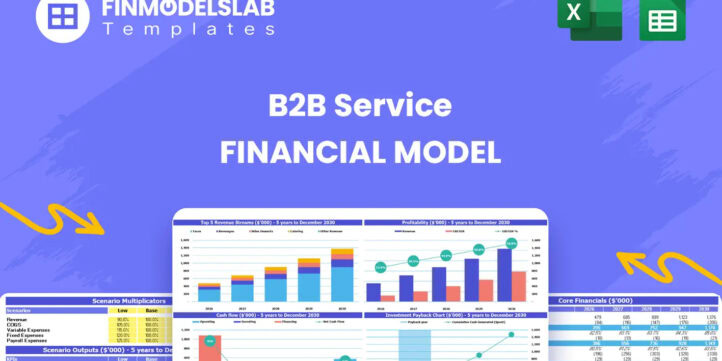


Financial Model Overview
The B2B Business Financial Model Financial Model Template is a ready-to-use planning tool for building a structured five-year forecast for a business-to-business operation. It helps users move from high-level strategy to detailed financial projections by connecting customer acquisition, repeat orders, product category revenue, supplier costs, payroll, operating expenses, capital investments, cash flow, profitability, and investor returns in one editable model. For entrepreneurs, founders, consultants, analysts, and business owners, the template provides a practical foundation for business planning, fundraising, bank discussions, board reporting, and internal decision-making. Rather than building formulas and reporting layouts from scratch, users can update the assumptions that matter most to their B2B business and review how those assumptions flow through the financial statements, dashboard, charts, and performance metrics. The result is a more organized, transparent, and defensible financial plan that can be adapted for launch planning, expansion planning, funding preparation, or ongoing performance review.
All-in-One Dashboard
The all-in-one dashboard brings the model’s core assumptions and outputs into one central view, making it easier to understand the financial position of the B2B business without navigating through every supporting schedule. This section typically summarizes important inputs such as marketing spend, customer acquisition cost, repeat customer behavior, revenue assumptions, operating expense levels, payroll, capital investments, and scenario selections. It then translates those inputs into key outputs such as projected revenue, gross profit, EBITDA, cash position, funding needs, return metrics, and break-even timing. For planning and decision-making, the dashboard is useful because it gives users a fast way to review whether the business plan is financially viable and whether changes in assumptions are producing the intended results. It can support investor conversations by presenting the most important figures in a clean and consolidated format, while also helping management monitor the relationship between growth, margin, liquidity, and profitability over the forecast period.
Low, Base, and High Scenario Analysis
The Low, Base, and High scenario analysis section allows users to evaluate how the B2B business may perform under different market, pricing, acquisition, and operating conditions. Instead of relying on a single forecast, users can create a conservative case, an expected case, and an upside case by adjusting key drivers such as customer acquisition cost, marketing investment, conversion efficiency, repeat purchase rates, product pricing, supplier cost percentages, headcount timing, and operating expense assumptions. The model then shows how those assumptions affect revenue growth, margins, EBITDA, cash flow, and funding requirements across the forecast period. This component is valuable for entrepreneurs and investors because it clarifies both risk and opportunity. A Low case can help identify cash gaps, delayed break-even timing, or pressure on profitability, while a High case can highlight scalability and upside potential. For funding documents and strategic planning, scenario analysis makes the financial plan more credible by showing that the user has considered more than one possible outcome.
Professional Charts
The professional charts section converts the financial model’s outputs into visual reports that are easier to understand, present, and discuss with stakeholders. These charts may display revenue trends, EBITDA growth, cash balances, margin development, operating expense movement, customer growth, revenue mix, break-even timing, or scenario comparisons. The inputs come from the underlying forecast schedules, while the outputs are automatically generated visuals that help users identify patterns and communicate financial performance clearly. This is especially useful when preparing investor presentations, lender packages, internal planning decks, or management updates because charts often explain the business story faster than rows of numbers. For a B2B business, visuals can show how new customer acquisition develops into repeat revenue, how supplier cost improvements support margin expansion, and how early investment translates into future profitability. The charts also help users spot inconsistencies, pressure points, and opportunities for improvement before sharing the plan externally.
ROE Components and DuPont Analysis
The ROE components and DuPont analysis section helps users understand the drivers behind return on equity rather than viewing it as a single isolated percentage. This component breaks return performance into underlying factors such as profitability, asset efficiency, and leverage, allowing the user to see whether returns are being driven by operating margin, revenue scale, balance sheet efficiency, or financing structure. Inputs may include net income, equity, assets, revenue, margins, and balance sheet assumptions generated by the broader financial model. The outputs can help show how efficiently the B2B business is converting investment into shareholder value over time. This is useful for investors, founders, and financial analysts because it provides a deeper view of capital performance and helps explain why returns improve or decline as the company scales. In a B2B model where growth may require marketing spend, working capital, technology investment, and staffing, DuPont analysis helps users evaluate whether the business is producing attractive returns from the resources deployed.
Revenue Inputs
The revenue inputs section is where users define the commercial assumptions that drive the forecast. For a B2B business, these inputs may include marketing spend, customer acquisition cost, number of new customers, repeat purchase rates, customer retention period, order frequency, product pricing, annual price increases, and revenue allocation across multiple product or service categories. In the source model, revenue is built around new customer acquisition, repeat customer cohorts, and a sales mix across categories such as network hardware and office ergonomics, but every assumption can be edited to match the user’s own business plan. This component is essential because revenue is rarely a single top-line estimate in a well-built financial model. It should be tied to measurable operating drivers that management can influence. By adjusting customer acquisition, retention, pricing, and category mix, users can test how realistic their growth plan is and determine whether the expected revenue base can support payroll, operating expenses, supplier costs, capital investment, and profitability targets.
Bank-Ready Reports
The bank-ready reports section organizes the financial outputs in a format that can be used for lender discussions, loan applications, credit review, or other financing conversations. These reports typically include structured projections for the profit and loss statement, cash flow forecast, balance sheet, capital requirements, debt capacity, liquidity position, and operating performance. The inputs come from the assumptions and forecast schedules throughout the model, while the outputs present the business in a lender-friendly way that focuses on repayment ability, cash flow stability, profitability, and financial discipline. For a B2B business seeking startup capital, working capital support, equipment financing, or expansion funding, these reports help communicate how funds will be used and how the business is expected to generate enough cash to meet obligations. They also support internal planning by showing whether the business has sufficient liquidity during the early growth phase, whether operating costs are manageable, and whether forecasted profits are supported by actual cash flow.
Revenue Breakdown
The revenue breakdown section gives users a more detailed view of where sales are expected to come from across customer types, order sources, product lines, or service categories. Instead of reviewing total revenue only, users can examine the contribution of new customers, repeat buyers, retained cohorts, and individual revenue streams. Inputs may include sales mix percentages, product prices, annual price increases, order volumes, category-level growth assumptions, and customer retention behavior. The resulting outputs help users understand which revenue streams are contributing most to growth, which categories may carry higher or lower margins, and how changes in sales mix affect overall performance. For B2B planning, this is important because not all revenue is equal. A business may grow quickly but still face weak margins if sales are concentrated in lower-margin categories, or it may improve profitability by shifting focus toward higher-value products or recurring customer relationships. This component helps users make more informed decisions about pricing, marketing priorities, product strategy, and customer targeting.
KPI Dashboard
The KPI dashboard section tracks the performance metrics that matter most for evaluating the health and scalability of the B2B business. These metrics may include revenue growth, gross margin, EBITDA margin, cash balance, customer acquisition cost, customer lifetime value, retention, repeat purchase behavior, payback period, return on equity, internal rate of return, and other operating or financial indicators. Inputs are pulled from the model’s assumptions, revenue forecast, expense schedules, and financial statements, while the outputs are presented as clear metrics that help users assess whether the business is moving in the right direction. This component is useful because it bridges financial planning and management execution. Founders can use it to identify whether marketing spend is creating valuable customers, whether operating costs are scaling efficiently, and whether profitability is improving as revenue grows. Consultants and analysts can use it to benchmark assumptions, explain performance to stakeholders, and support recommendations. Investors can use it to evaluate the relationship between growth, efficiency, liquidity, and returns.
Startup Cost and Capital Investment Planning
The startup cost and capital investment planning section organizes the initial funding required before and during launch. For a B2B business, this may include custom software integration, IT infrastructure, delivery vehicles, office furniture, equipment, deposits, licenses, initial marketing, professional services, technology setup, inventory, and working capital reserves. Inputs can be entered as one-time costs, phased investments, or category-level capital expenditures, allowing users to model when cash will be spent and how those investments affect the opening balance sheet and cash flow forecast. This component is useful because many B2B businesses require meaningful upfront investment before revenue reaches a sustainable level. By separating launch costs from recurring operating expenses, users can avoid underestimating funding needs and can present a clearer use-of-funds plan to investors, lenders, or internal stakeholders. It also supports better budgeting by showing which investments are essential at launch, which can be delayed, and how early spending affects liquidity during the first months of operation.
Break-Even and Payback Analysis
The break-even and payback analysis section helps users identify when the B2B business is expected to cover its costs and recover its initial investment. Break-even analysis compares projected revenue with fixed costs, variable costs, supplier costs, payroll, and operating expenses to determine when the business becomes profitable on an operating basis. Payback analysis then evaluates how long it may take for the initial capital invested to be recovered through future cash flows or profits. Inputs may include pricing, order volume, customer acquisition cost, repeat purchase behavior, gross margin, fixed overhead, payroll timing, and startup investment. The outputs help users understand the timeline to sustainability, the cash runway required before profitability, and the sensitivity of returns to key business drivers. This is especially valuable for funding preparation because investors and lenders often want to know how long the business will need support before it can stand on its own. It also helps management set realistic milestones, monitor progress, and make decisions that can accelerate profitability.
File types:
Excel – Single-User: .xlsx
Excel – Multi-User: .xlsx
Similar ProductsOther customers were also interested in...

 HenrySheykin
Online Clothing Store Financial Model Excel Templa...
The Online Clothing Store Financial Model helps founders, entrepreneurs, business owners, consultant... Read more
B2C Financial Model Excel Template
The B2C Business Financial Model Financial Model Template helps entrepreneurs, founders, business ow... Read more
Dropshipping Financial Model Excel Template
The Dropshipping Business Financial Model helps entrepreneurs, founders, consultants, analysts, and ... Read more
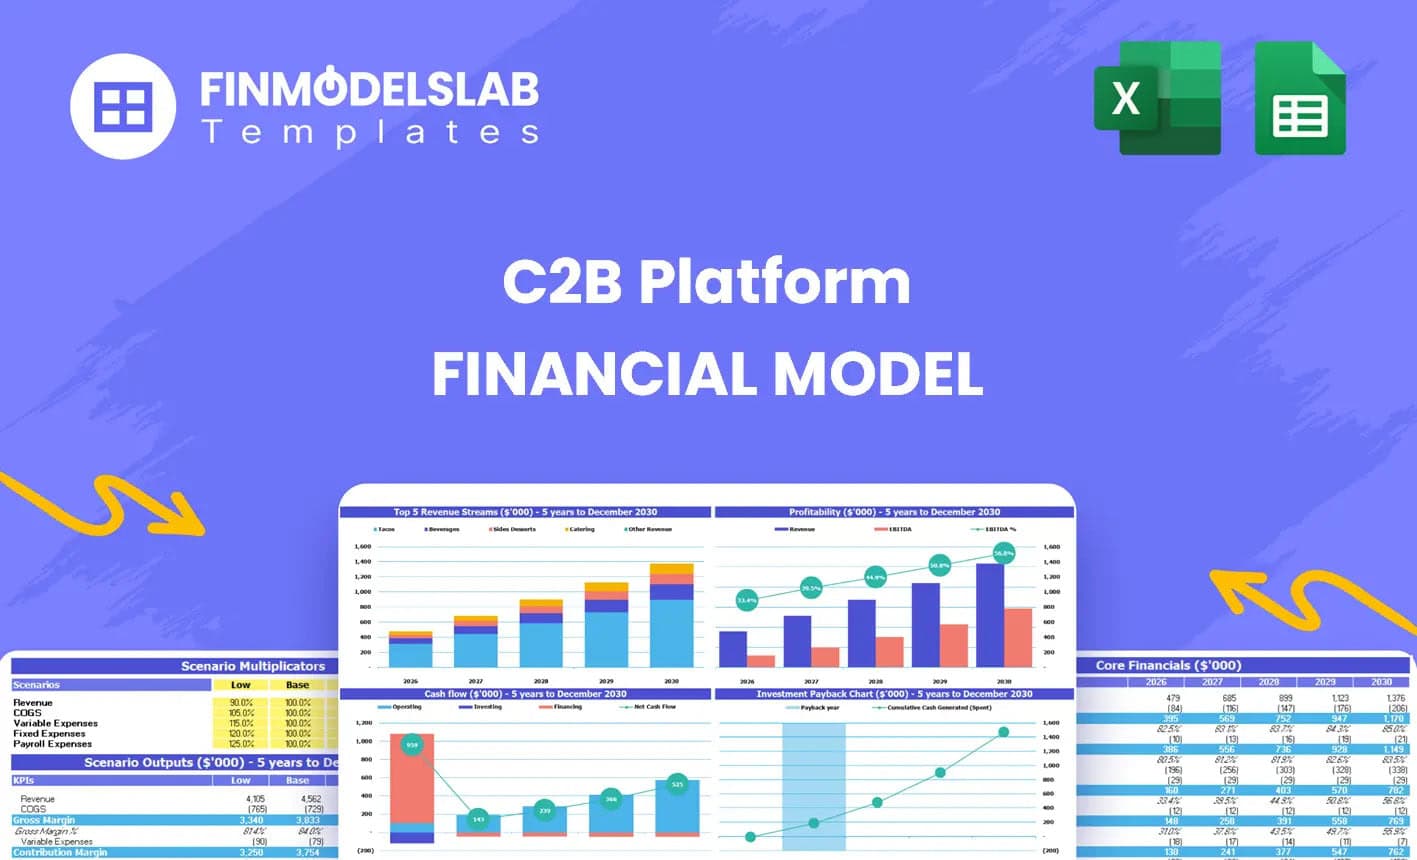
C2B Financial Model Excel Template
The C2B Platform Financial Model Financial Model Template helps users evaluate the financial potenti... Read more
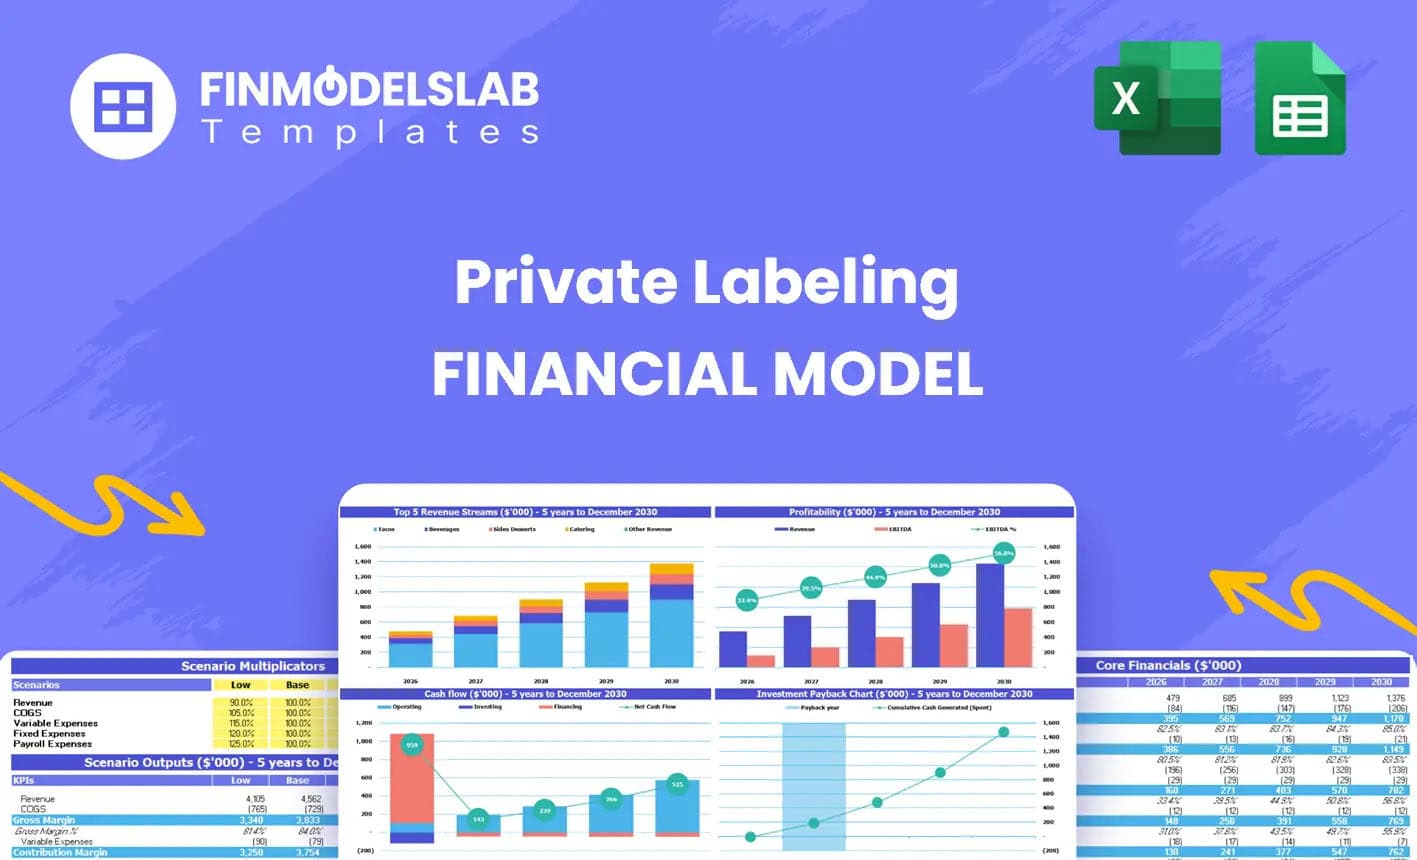
Private Labeling Financial Model Excel Template
The Private Labeling Financial Model Financial Model Template helps entrepreneurs, founders, busines... Read more
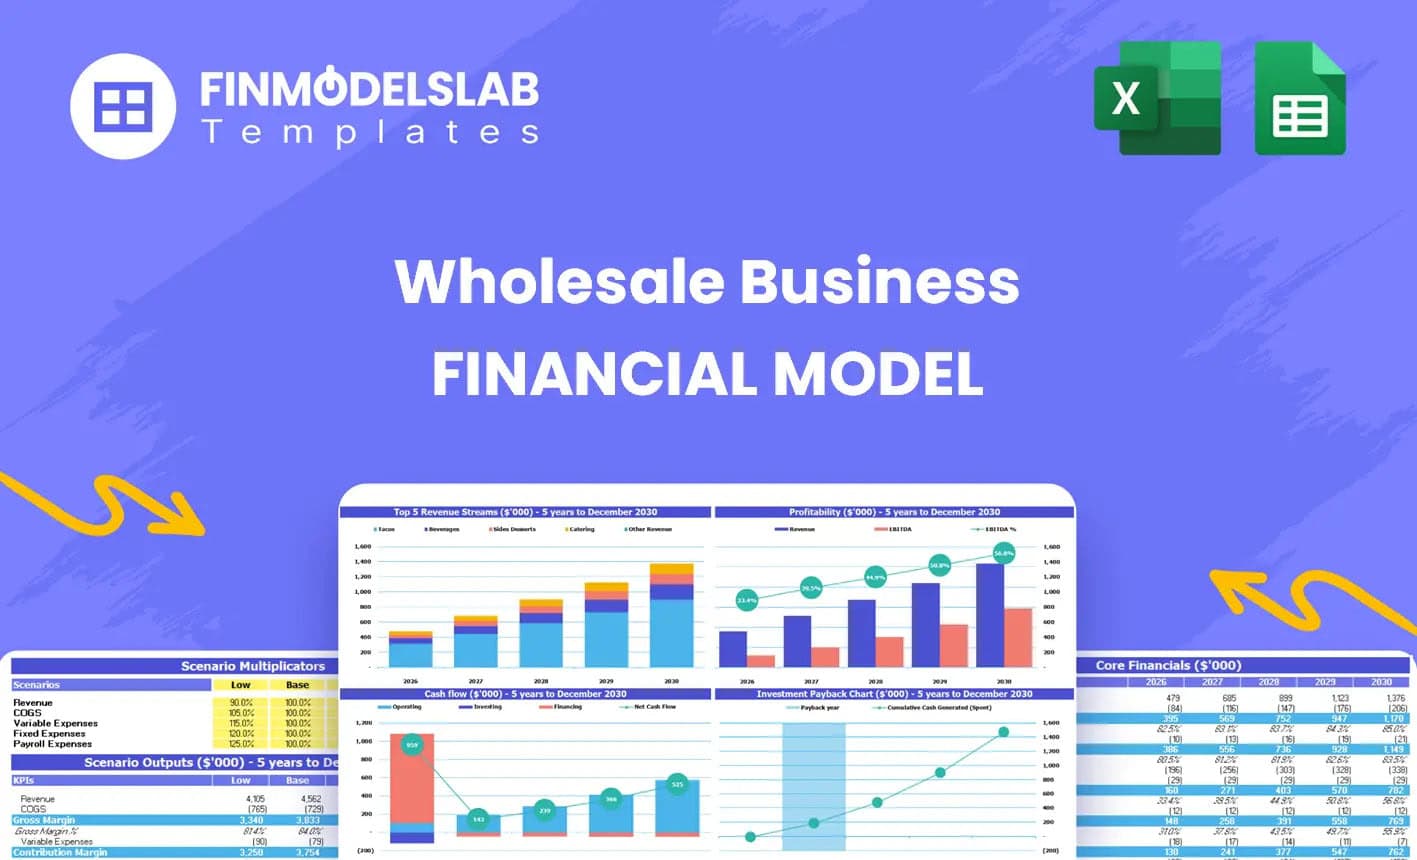
Wholesaling E-Commerce Financial Model Excel Templ...
The Wholesale Business Financial Model helps entrepreneurs, founders, business owners, consultants, ... Read more
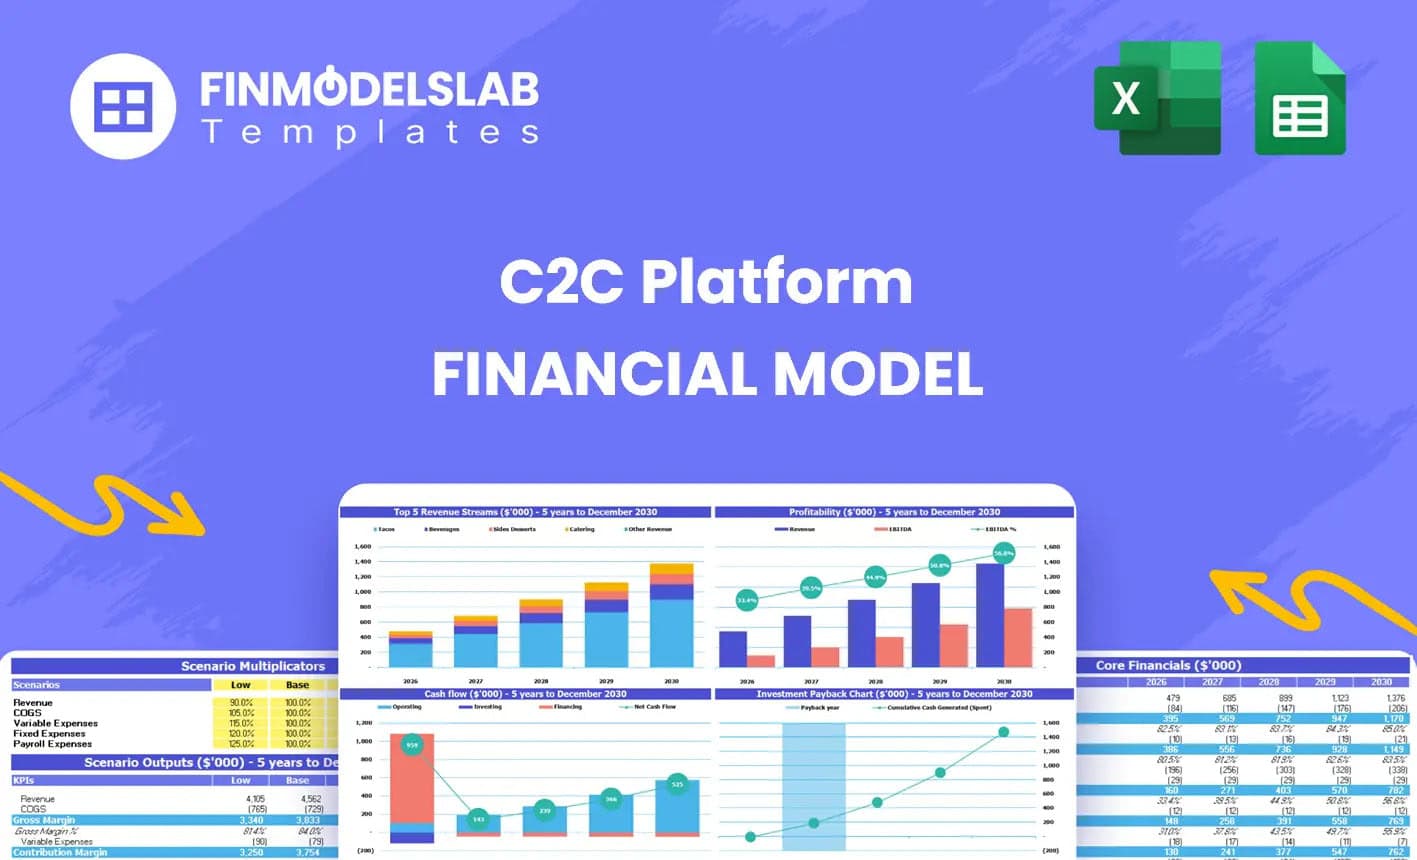
C2C Financial Model Excel Template
The C2C Platform Financial Model helps founders, entrepreneurs, consultants, analysts, and business ... Read more
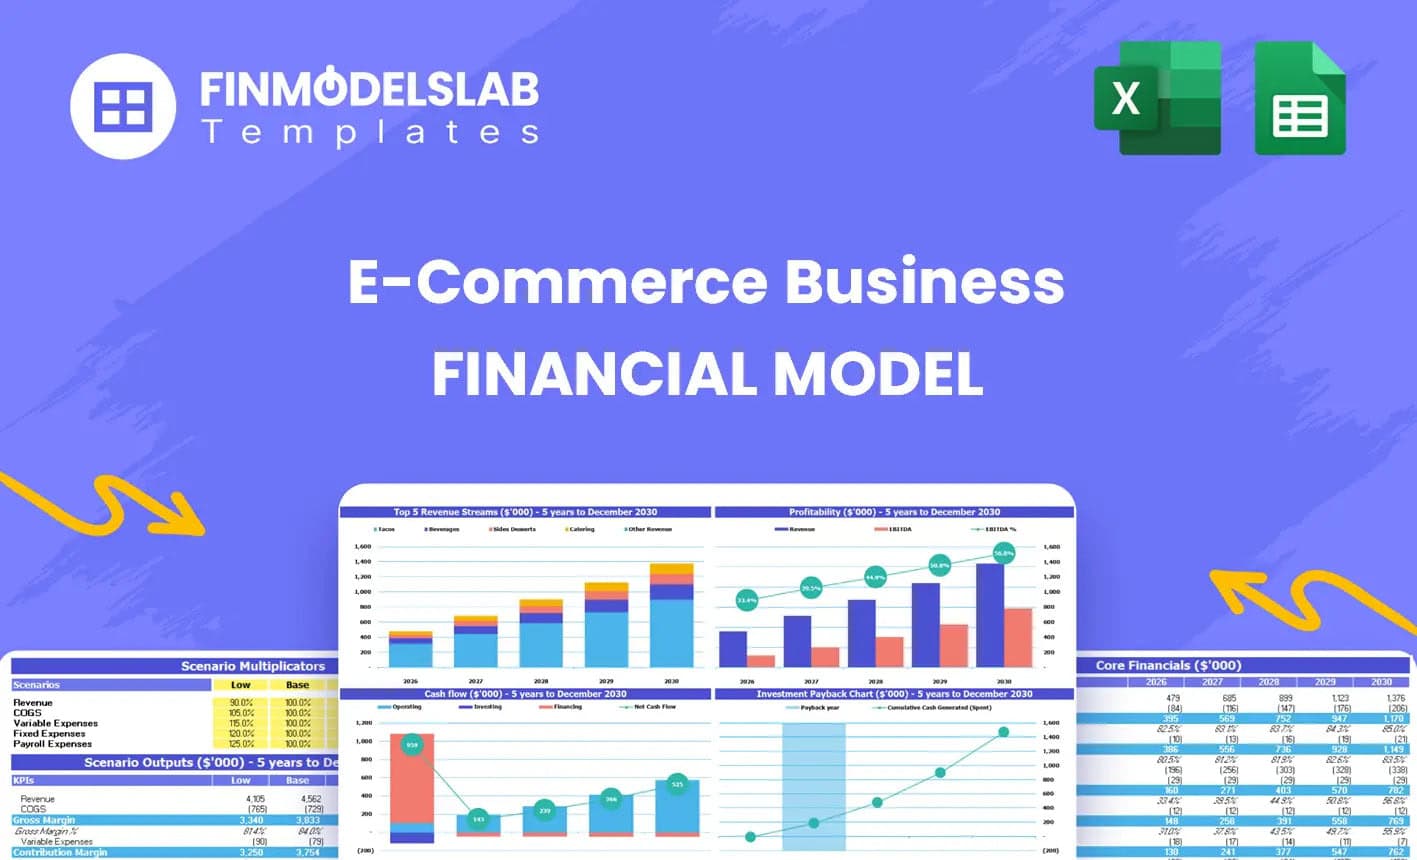
E-com Simple Financial Model Excel Template
The E-Commerce Business Financial Model Template helps founders, online store owners, consultants, a... Read more
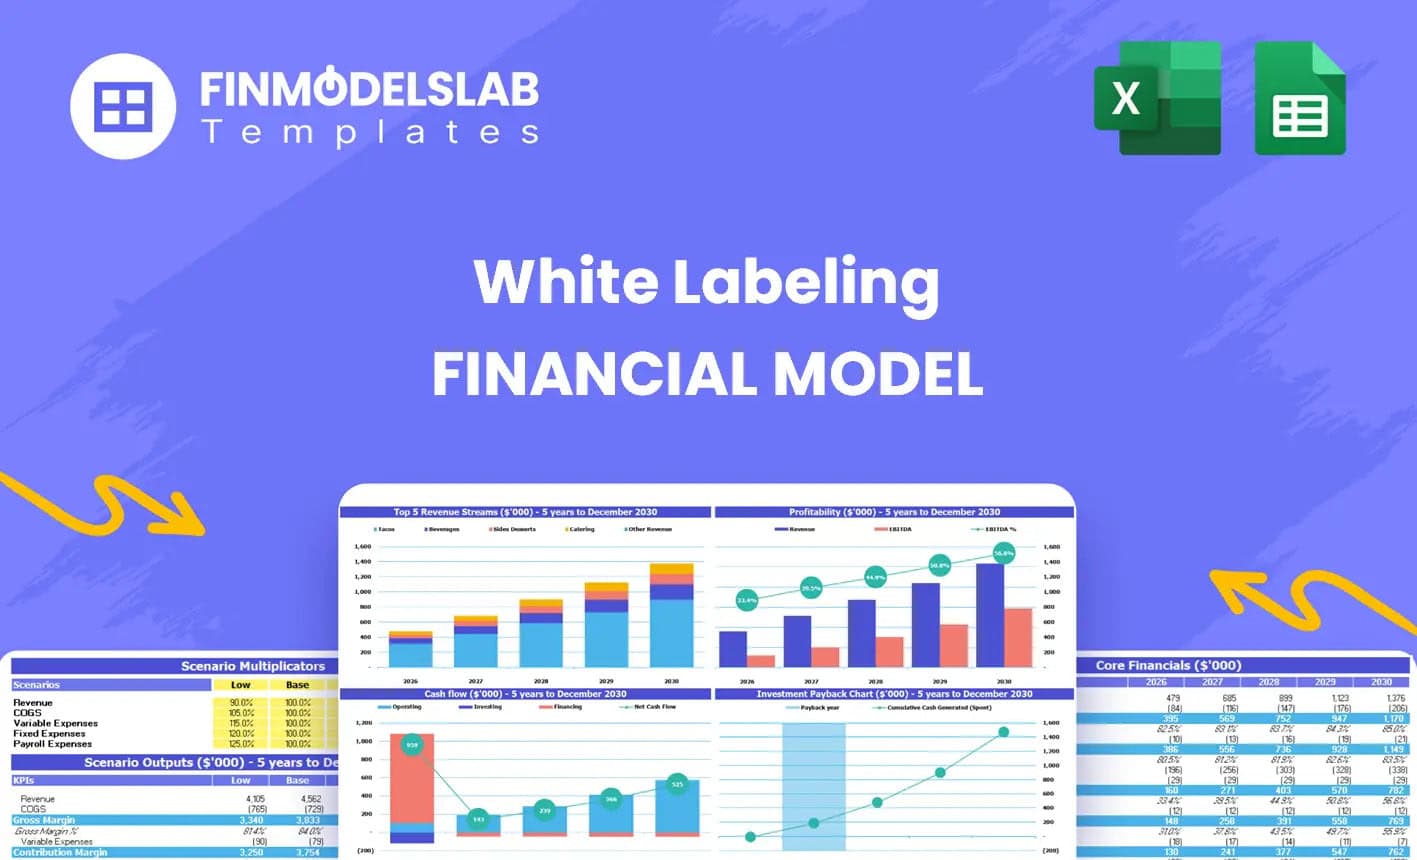
White Labeling Financial Model Excel Template
The White Labeling Financial Model helps entrepreneurs, founders, consultants, analysts, and busines... Read more
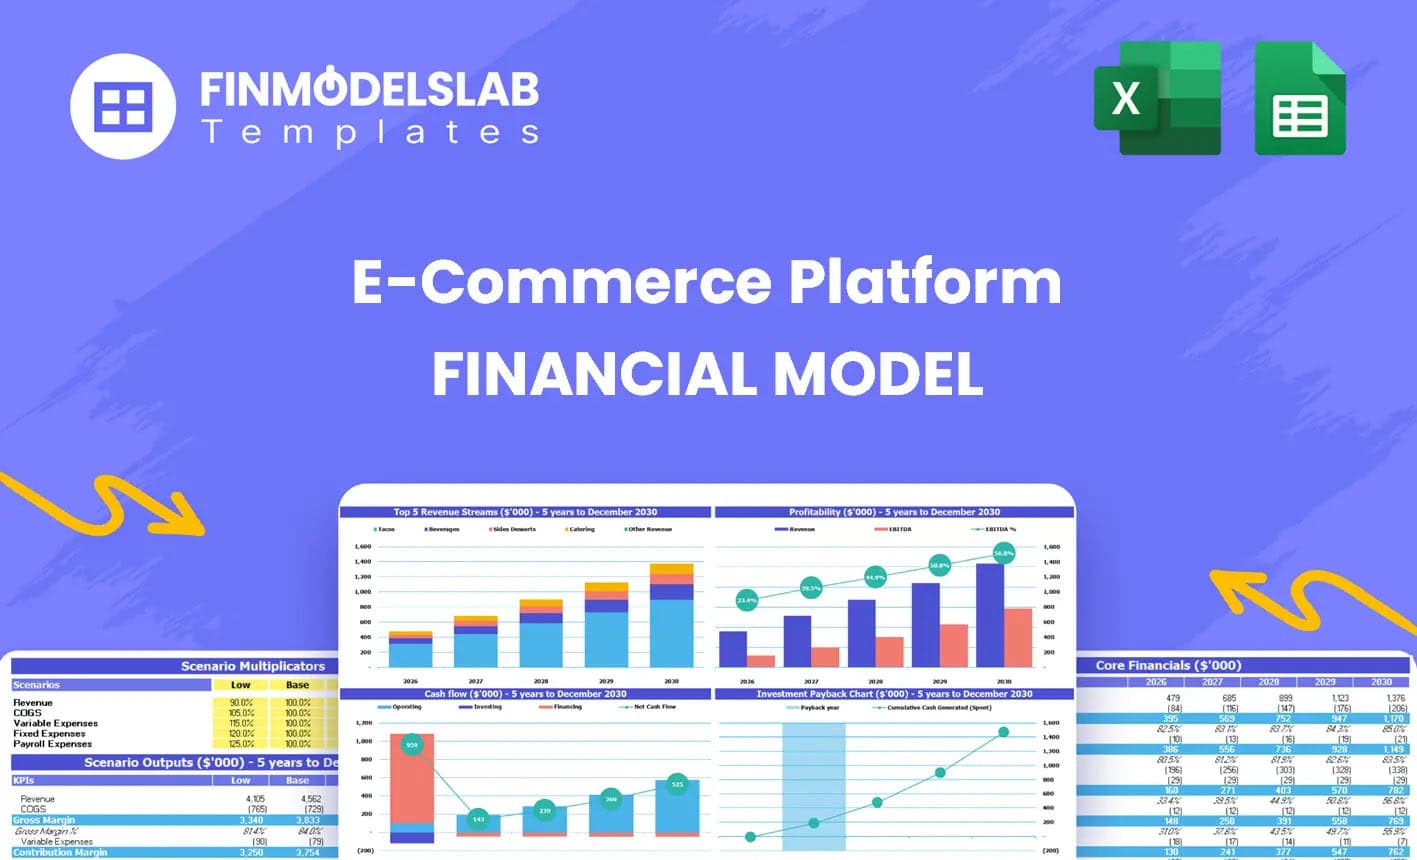
E-Commerce Software Financial Model Excel Template
The E-Commerce Platform Financial Model Financial Model Template helps founders, entrepreneurs, cons... Read more
Reviews
 perfect model
perfect model
471 of 919 people found this review helpful.
Help other customers find the most helpful reviews
Did you find this review helpful?
You must log in to submit a review.