
0 ITEMS

Dropshipping Financial Model Excel Template
The Dropshipping Business Financial Model helps entrepreneurs, founders, consultants, analysts, and e-commerce business owners turn a dropshipping concept into a structured financial forecast. Instead of relying on rough estimates for margins, advertising spend, customer acquisition, and cash runway, this financial model template gives users a ready-to-use planning framework for projecting revenue, startup costs, operating expenses, payroll, cash flow, profitability, and long-term growth. It is designed for users who want to evaluate whether a dropshipping store can become financially sustainable before committing major time, capital, or marketing budget. Built around the realities of an inventory-light e-commerce business, the template connects key assumptions such as marketing spend, customer acquisition cost, repeat purchase rate, average order value, product pricing, supplier costs, and operating overhead. Users can adjust the model to reflect their own product categories, pricing strategy, conversion assumptions, staffing plan, software subscriptions, and growth targets. This makes it useful for preparing business plans, investor materials, loan applications, internal budgets, or strategic forecasts for a new or expanding online retail business. The model is especially helpful for understanding the financial pressure points that matter in dropshipping. It helps users see how paid advertising efficiency, product margins, repeat buyers, and fixed expenses affect cash flow and profitability over time. By organizing revenue assumptions, startup costs, cost of goods sold, payroll, operating expenses, and forecast outputs in one connected file, the template makes it easier to identify funding needs, review projected financial statements, and assess the path toward break-even. This supports more informed decision-making around launch timing, marketing investment, hiring, and supplier negotiations. Fully editable and compatible with Microsoft Excel and Google Sheets, the Dropshipping Business Financial Model is built to save time while still allowing detailed customization. Users can work from pre-built formulas, professional formatting, dashboard views, scenario tools, and investor-oriented outputs instead of building a forecast from scratch. Whether used by a first-time founder, an established online seller, a financial consultant, or a team preparing funding documents, the template provides a practical way to test assumptions, communicate the business case, and plan for sustainable growth.
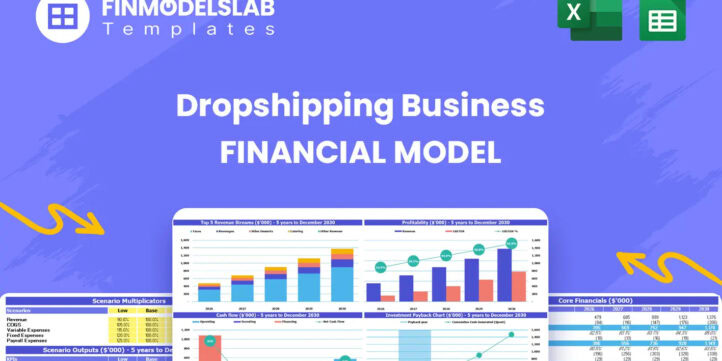


Financial Model Overview
The Dropshipping Business Financial Model is a ready-to-use financial model template created for planning, launching, funding, and managing a dropshipping e-commerce business. It gives entrepreneurs, founders, consultants, analysts, and business owners a structured way to estimate how the business may perform across revenue, customer acquisition, product margins, operating expenses, payroll, cash flow, profitability, and investor returns. Dropshipping can look simple because it avoids traditional inventory ownership, but the economics still depend heavily on advertising efficiency, supplier costs, conversion rates, repeat purchases, average order values, software tools, and operating discipline. This model brings those assumptions together in one connected forecast so users can replace guesswork with a practical financial planning process. It is fully editable, designed for Microsoft Excel and Google Sheets, and suitable for business plans, funding discussions, stakeholder presentations, internal budgeting, and ongoing decision-making. By using a structured model instead of disconnected spreadsheets, users can test assumptions, review projected outcomes, and understand the financial runway required to build a sustainable online store.
All-in-One Dashboard
The all-in-one dashboard gives users a centralized view of the most important inputs and outputs in the Dropshipping Business Financial Model. It is designed to help decision-makers quickly understand the current forecast without searching through multiple tabs or recalculating figures manually. Key inputs may include marketing budget, customer acquisition cost, repeat customer assumptions, product pricing, supplier costs, payroll, fixed expenses, startup costs, and funding assumptions. Key outputs may include projected revenue, gross profit, EBITDA, net income, cash balance, payback timing, and other high-level performance indicators. For a dropshipping business, this is especially useful because performance can shift quickly when paid advertising costs rise, product margins change, or repeat purchase behavior improves. The dashboard helps users connect assumptions to outcomes and provides a clear starting point for planning conversations. It can support founders who need a fast view of financial health, consultants preparing client forecasts, and investors or lenders who want a concise summary of the business model. Because the dashboard is dynamic and connected to the underlying calculations, any changes to assumptions can flow through the model and update the key results, making it easier to compare strategies and communicate the financial story.
Low, Base, and High Scenario Analysis
The low, base, and high scenario analysis section helps users test how the dropshipping business may perform under different market and operating conditions. Instead of relying on one forecast, the model allows users to compare conservative, expected, and optimistic cases based on changes in key assumptions. These assumptions may include conversion rates, marketing spend, customer acquisition cost, repeat purchase rate, average order value, wholesale product cost, shipping-related charges, operating expenses, and hiring pace. In a dropshipping business, scenario planning is highly valuable because profitability can be sensitive to advertising performance and supplier pricing. A small increase in customer acquisition cost or a decline in conversion rate can materially affect cash flow, while stronger repeat purchasing can improve margins and accelerate break-even. This component helps users understand downside risk, plan for funding needs, and identify which assumptions have the greatest impact on performance. The low case can show the cash runway required if growth is slower than expected, the base case can support the primary business plan, and the high case can illustrate upside potential if marketing efficiency and customer retention improve. This makes the model more useful for investor conversations, contingency planning, and practical decision-making.
Professional Charts
The professional charts component turns the financial forecast into clear visual outputs that are easier to review, present, and explain. Rather than forcing users to interpret rows of numbers, the charts can display trends in revenue growth, gross profit, EBITDA, net income, cash balance, expenses, customer activity, and other financial metrics over time. For a dropshipping business, visual reporting is helpful because many of the most important questions involve trends, such as whether marketing investment is translating into sales growth, whether margins are improving, and whether the cash position remains strong enough to support expansion. These charts can be used in pitch decks, business plan appendices, stakeholder updates, lender discussions, or internal review meetings. They also help non-financial users understand the forecast more quickly by showing the direction and scale of change across months and years. Since the charts are connected to the model’s assumptions and calculations, users can update drivers such as ad spend, customer acquisition cost, pricing, product mix, or overhead and immediately see how the visual outputs change. This makes the financial model more practical for communication, not just calculation, and helps users present a polished, investor-ready financial story.
ROE Components and DuPont Analysis
The ROE components and DuPont analysis section helps users understand the drivers behind return on equity rather than looking at a single return figure in isolation. This component breaks down financial performance into underlying elements such as profitability, asset efficiency, and leverage, helping users see why the business is generating a particular level of return. For a dropshipping business, this is useful because the model may have lower inventory requirements than traditional retail, but returns still depend on margin quality, expense control, working capital needs, and funding structure. Inputs may include net income, equity investment, asset levels, liabilities, revenue, and expense assumptions. Outputs can help explain how operating performance and capital structure combine to create the projected return on equity. This is particularly relevant for founders and investors who want to understand whether returns are being driven by sustainable operating improvements or by financial leverage. It also supports better strategic planning by showing which levers can improve returns, such as raising gross margins, reducing customer acquisition costs, improving repeat purchase rates, controlling fixed overhead, or using capital more efficiently. By including DuPont-style analysis, the template goes beyond basic forecasting and gives users a more analytical view of business performance.
Revenue Inputs
The revenue inputs section is where users define the commercial assumptions that drive the dropshipping forecast. It may include marketing spend, customer acquisition cost, new customer volume, repeat customer rate, purchase frequency, average units per order, product categories, selling prices, product mix, and other assumptions that determine sales potential. In a dropshipping business, revenue is not just a function of website traffic. It depends on how efficiently advertising converts into customers, how much those customers buy, how often they return, and which products they purchase. This section helps users document those assumptions in a structured way so the revenue forecast is transparent and easy to adjust. For example, users can test the effect of increasing ad spend, lowering customer acquisition cost, improving repeat customer behavior, adding higher-priced product categories, or increasing average order value through bundles and upsells. The outputs generated from this section feed into projected sales, gross revenue, product-level revenue, and profitability calculations. This makes the revenue inputs section one of the most important parts of the model because it connects marketing strategy, customer behavior, and product economics. It is useful for founders building a launch plan, consultants validating assumptions, and investors reviewing whether the growth forecast is realistic.
Bank-Ready Reports
The bank-ready reports component organizes the model’s financial outputs into a format that can support lending discussions, funding applications, and professional stakeholder review. These reports may include projected income statements, cash flow statements, balance sheets, revenue summaries, expense summaries, debt assumptions, repayment capacity, profitability metrics, and other lender-friendly outputs. For a dropshipping business, bank-ready reporting is important because lenders and financing partners often want to understand whether the business can cover operating costs, maintain liquidity, and repay obligations even if sales fluctuate. This section helps users present a structured view of the company’s financial position rather than providing fragmented estimates. Inputs from the broader model, such as startup costs, marketing budget, product margins, operating expenses, payroll, funding sources, and repayment assumptions, flow into the reports to create a consistent financial picture. These outputs can help users explain how much capital is needed, how funds may be used, when the business may become cash flow positive, and whether projected profits can support debt service or reinvestment. The professional format also helps create credibility with banks, lenders, grant reviewers, investors, and internal decision-makers who expect clear financial statements and well-supported assumptions.
Revenue Breakdown
The revenue breakdown section gives users a detailed view of how sales are generated across different revenue streams, product categories, customer segments, or order types. In a dropshipping business, not all products contribute equally to performance. Some items may have higher selling prices but lower margins, while others may generate repeat purchases, bundle opportunities, or stronger conversion rates. This component allows users to separate revenue by category so they can see how each part of the product mix contributes to total sales and profitability. Inputs may include product pricing, units sold, average order size, customer counts, purchase frequency, and category-level mix assumptions. Outputs may include revenue by product category, share of total revenue, category growth over time, and the contribution of new versus repeat customers. This is useful for planning merchandising strategy, supplier negotiations, marketing allocation, and pricing decisions. If one category produces strong revenue but weak margins, users can reconsider promotional strategy or supplier costs. If another category has strong profitability, the business may choose to focus more advertising budget there. A detailed revenue breakdown helps make the forecast more realistic and actionable because it shows what is driving sales rather than treating all revenue as one general number.
KPI Dashboard
The KPI dashboard provides a performance-focused view of the metrics that matter most for managing and scaling a dropshipping business. It may include customer acquisition cost, conversion rate, average order value, repeat customer rate, gross margin, contribution margin, EBITDA margin, cash runway, payback period, revenue growth, and other indicators that help users monitor business health. This component is useful because dropshipping performance often depends on a small set of operational levers. If customer acquisition cost rises faster than average order value, profitability may decline. If repeat customer rates improve, lifetime value can increase and marketing efficiency may become more attractive. If gross margin falls due to supplier costs or discounting, cash flow may tighten even when sales are growing. The KPI dashboard turns these relationships into a practical management tool by summarizing them in one place. Users can compare forecast performance against targets, industry benchmarks, or internal goals, helping them identify where the business is performing well and where adjustments may be needed. For stakeholder presentations, this dashboard can also communicate the quality of the business model in a concise way. It supports better decision-making by helping users focus on the metrics that directly affect growth, profitability, and cash stability.
Startup Cost Breakdown
The startup cost breakdown section helps users estimate the initial investment required before the dropshipping business is ready to operate and generate sales. Even though dropshipping does not require the same upfront inventory investment as a traditional retail business, it still involves meaningful launch costs. These may include website development, e-commerce platform setup, branding, product photography, content creation, customer relationship management tools, payment systems, legal setup, business registration, initial marketing assets, software subscriptions, office equipment, and working capital reserves. This component allows users to itemize one-time costs separately from recurring operating expenses, making it easier to understand how much funding is needed before launch. Outputs may include total startup investment, timing of cash outflows, funding gap estimates, and the amount of capital required to reach the first meaningful revenue milestones. This is useful for founders preparing a launch budget, consultants building a feasibility study, and investors assessing whether the initial capital request is realistic. A clear startup cost breakdown also helps prevent underfunding, which is a common problem for e-commerce businesses that underestimate technology, advertising, and setup requirements. By separating launch expenses from ongoing costs, the model supports more accurate funding planning and better cash management from the beginning.
Break-Even Analysis
The break-even analysis component helps users identify when the dropshipping business is expected to cover its cumulative costs and begin generating profit. This section connects revenue growth, cost of goods sold, marketing spend, payroll, fixed overhead, and startup investment to determine the point at which the business moves from loss-making to financially sustainable. Inputs may include gross margin, monthly sales volume, average order value, customer acquisition cost, repeat customer behavior, operating expenses, and initial capital requirements. Outputs may include the estimated break-even month, cumulative profit or loss, required sales levels, and the relationship between revenue and total costs. For a dropshipping business, break-even analysis is especially important because early-stage marketing investment can create losses before repeat purchases and brand recognition improve unit economics.
File types:
Excel – Single-User: .xlsx
Excel – Multi-User: .xlsx
Similar ProductsOther customers were also interested in...

 HenrySheykin
Online Clothing Store Financial Model Excel Templa...
The Online Clothing Store Financial Model helps founders, entrepreneurs, business owners, consultant... Read more
Private Labeling Financial Model Excel Template
The Private Labeling Financial Model Financial Model Template helps entrepreneurs, founders, busines... Read more
C2B Financial Model Excel Template
The C2B Platform Financial Model Financial Model Template helps users evaluate the financial potenti... Read more
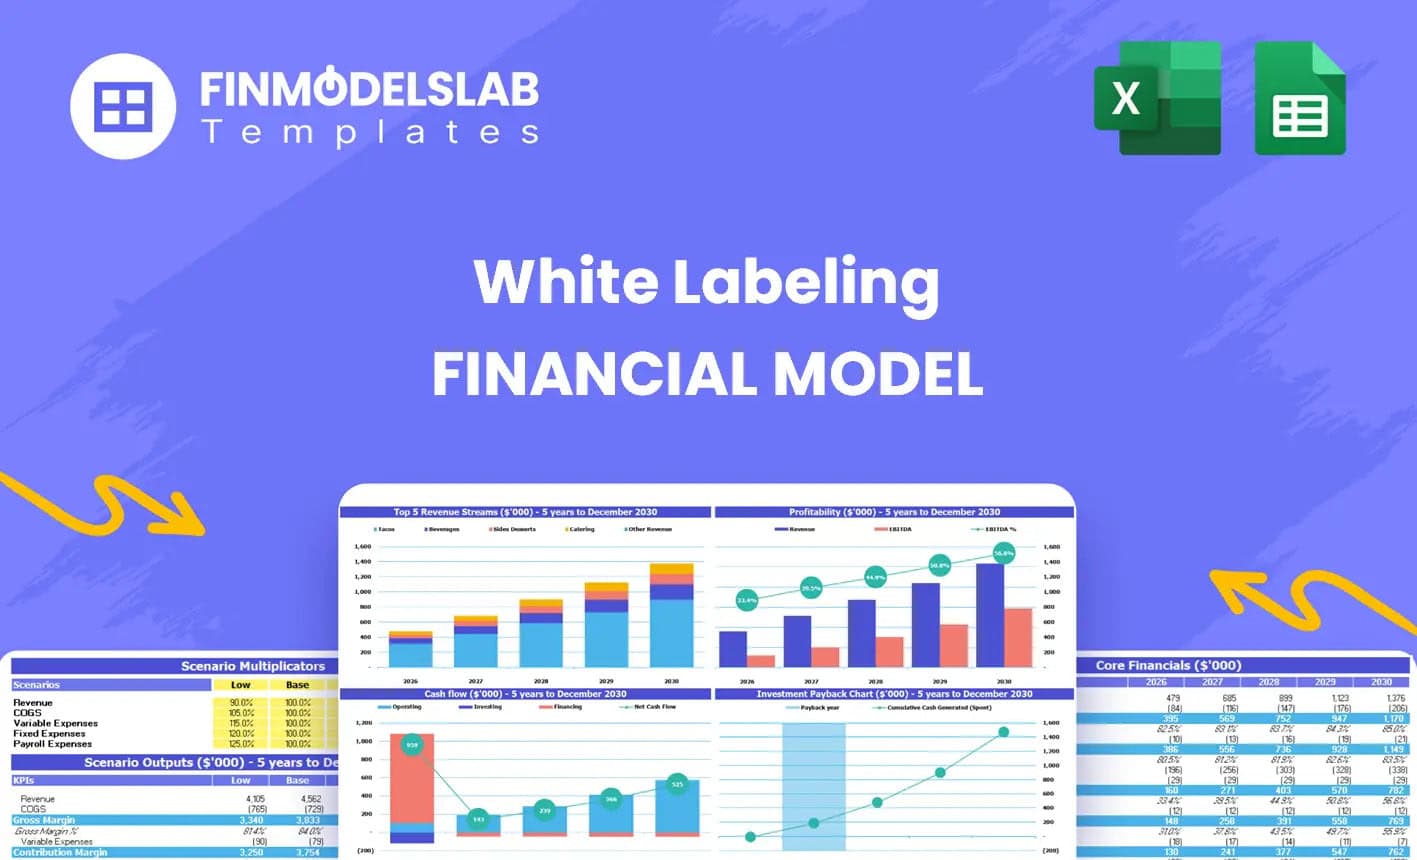
White Labeling Financial Model Excel Template
The White Labeling Financial Model helps entrepreneurs, founders, consultants, analysts, and busines... Read more
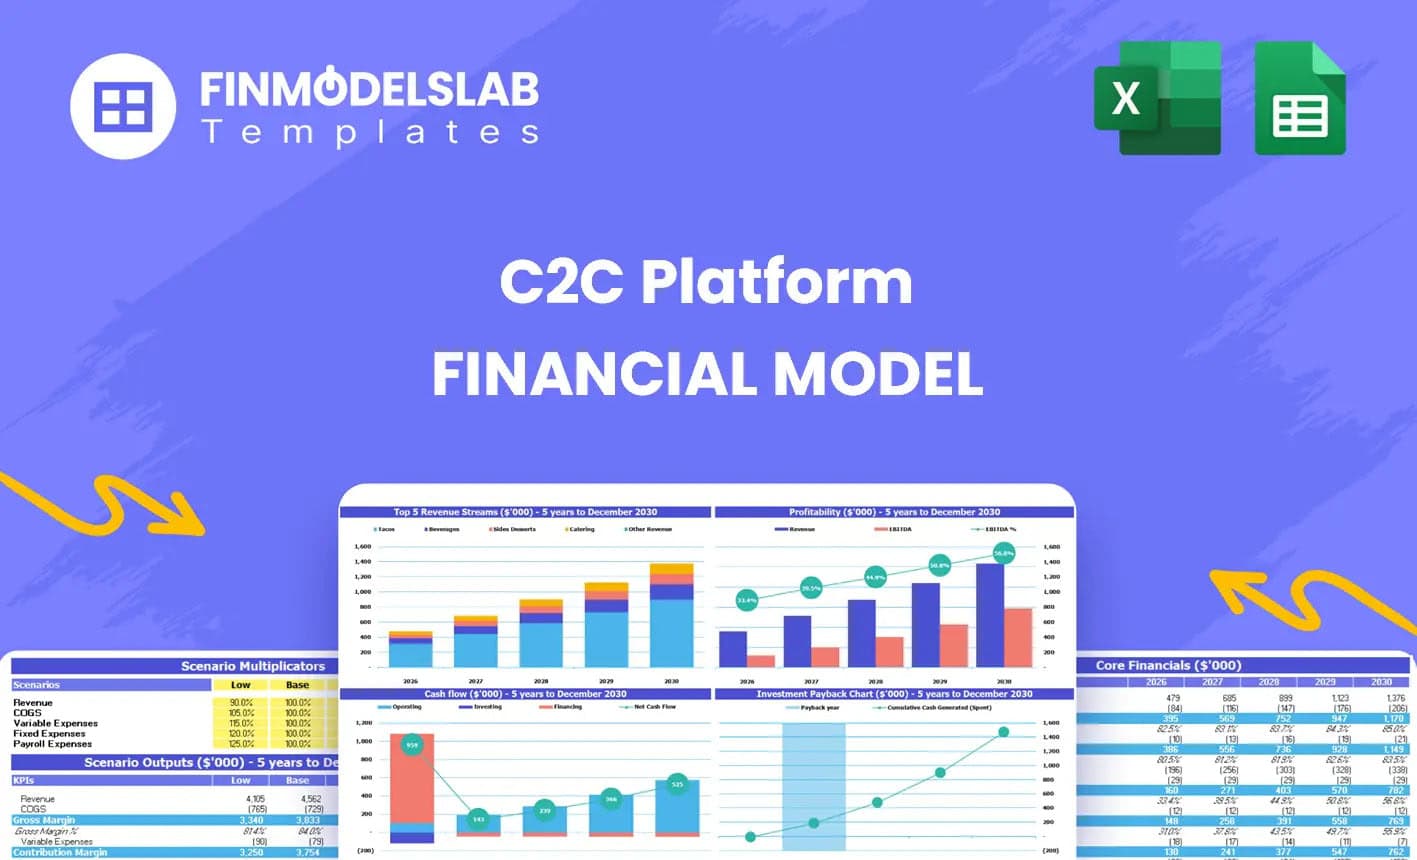
C2C Financial Model Excel Template
The C2C Platform Financial Model helps founders, entrepreneurs, consultants, analysts, and business ... Read more
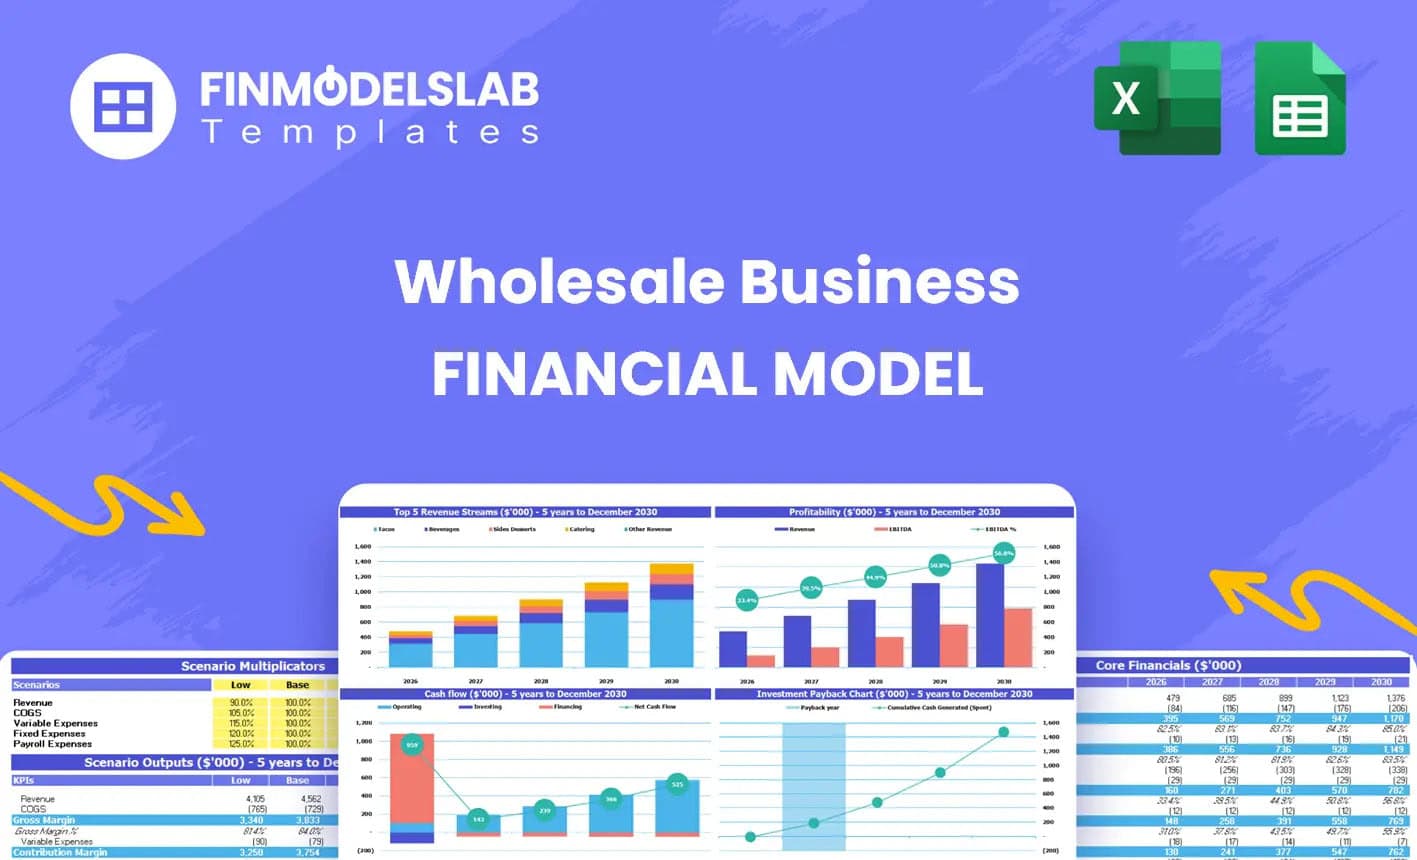
Wholesaling E-Commerce Financial Model Excel Templ...
The Wholesale Business Financial Model helps entrepreneurs, founders, business owners, consultants, ... Read more
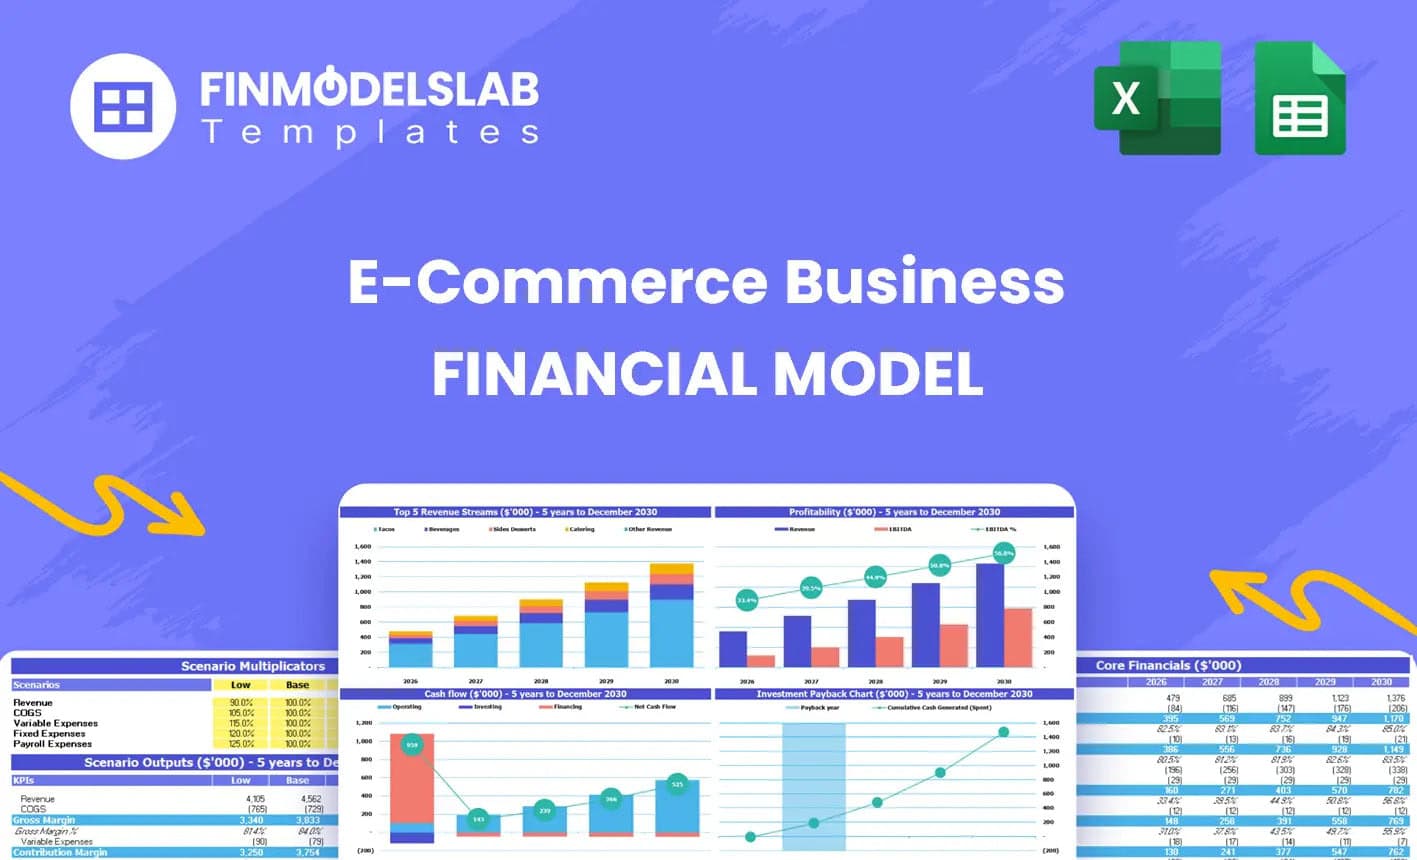
E-com Simple Financial Model Excel Template
The E-Commerce Business Financial Model Template helps founders, online store owners, consultants, a... Read more
B2C Financial Model Excel Template
The B2C Business Financial Model Financial Model Template helps entrepreneurs, founders, business ow... Read more
B2B Financial Model Excel Template
The B2B Business Financial Model Financial Model Template helps entrepreneurs, founders, consultants... Read more
E-Commerce Software Financial Model Excel Template
The E-Commerce Platform Financial Model Financial Model Template helps founders, entrepreneurs, cons... Read more
You must log in to submit a review.