
0 ITEMS

C2C Financial Model Excel Template
The C2C Platform Financial Model helps founders, entrepreneurs, consultants, analysts, and business owners turn a consumer-to-consumer marketplace idea into a structured five-year financial forecast. Instead of starting with a blank spreadsheet, users can work from a ready-to-use financial model template built around the realities of a C2C platform, including transaction commissions, seller and buyer subscriptions, add-on seller services, user acquisition spending, technology costs, payroll, and operating expenses. It gives users a practical way to organize revenue assumptions, estimate startup costs, evaluate cash flow, and understand whether the business can support sustainable profitability over time. This template is designed for business planning, investor discussions, lender presentations, internal budgeting, and strategic decision-making. It helps users test how changes in take rate, average order value, seller growth, buyer activity, subscription adoption, marketing efficiency, and fixed overhead can affect revenue, gross margin, EBITDA, cash balance, and long-term returns. The model is especially useful for marketplace startups that need to explain how they will attract users, monetize transactions, fund the early growth period, and eventually reach break-even. With editable assumptions and automated calculations, it allows users to customize the forecast to match their own platform concept, niche, geography, launch plan, and growth strategy. The C2C Platform Financial Model also supports funding preparation by connecting startup costs, initial capital needs, operating expenses, payroll plans, and cash flow requirements in one organized structure. Users can estimate how much funding may be needed before launch, how long cash burn may continue, and when the platform may become profitable based on realistic assumptions. The financial model template includes professional outputs that help communicate revenue potential, profitability, financial statements, scenario results, key performance indicators, and return metrics in a format suitable for stakeholders. For anyone preparing a business plan, pitch deck, loan application, acquisition review, or internal financial strategy, this template provides a faster and more reliable way to assess the economics of a C2C marketplace. It helps replace guesswork with a clear planning framework, making it easier to compare scenarios, refine assumptions, review break-even analysis, and make better decisions before committing capital, hiring a team, or scaling marketing spend.


Financial Model Overview
The C2C Platform Financial Model is a ready-to-use financial model template created for entrepreneurs, founders, business owners, consultants, and analysts planning a consumer-to-consumer marketplace. A C2C platform usually depends on a combination of transaction volume, seller participation, buyer activity, subscription adoption, commission rates, payment processing costs, platform development, marketing spend, and scalable operating infrastructure. This template brings those drivers together in one structured model so users can forecast revenue, startup investment, operating expenses, payroll, cash flow, profitability, and funding needs over a multi-year planning period. It is useful for early-stage planning, investor presentations, lender discussions, internal budgeting, and strategic decision-making because it translates marketplace assumptions into financial outputs that are easier to review, challenge, and present. Users can edit the assumptions to reflect their own niche, pricing model, take rate, launch budget, staffing plan, user acquisition strategy, and growth timeline, while the built-in formulas update the related financial projections automatically.
All-in-One Dashboard
The all-in-one dashboard gives users a central view of the most important inputs and outputs in the C2C Platform Financial Model. It is designed to help users quickly understand how the platform is expected to perform without jumping between multiple tabs or manually consolidating figures. This section may include core assumptions such as marketplace transaction volume, average order value, commission rate, fixed order fee, subscription pricing, seller and buyer acquisition volumes, marketing spend, payroll, overhead, and startup investment. It then summarizes key outputs such as revenue, EBITDA, net income, cash flow, cash balance, funding needs, return metrics, and profitability timing. For planning purposes, the dashboard is valuable because it connects operational assumptions with financial results in a clear, presentation-ready format. Founders can use it to review whether the marketplace concept is financially viable, consultants can use it to communicate findings to clients, and investors can use it to quickly assess whether the business has a credible path from launch investment to sustainable operations.
Low, Base, and High Scenario Analysis
The low, base, and high scenario analysis component helps users test how the C2C platform may perform under different market and execution conditions. A marketplace business can be highly sensitive to assumptions such as user acquisition cost, transaction frequency, average order value, take rate, subscription conversion, seller retention, buyer engagement, and marketing efficiency. This section allows users to compare conservative, expected, and optimistic versions of the forecast so they can understand the range of possible outcomes rather than relying on a single static projection. Inputs may include different growth rates, CAC assumptions, revenue stream adoption levels, expense levels, staffing requirements, and margin expectations. Outputs may show revenue, EBITDA, cash flow, cash balance, funding requirements, payback period, and profitability across each case. This is especially useful for funding conversations because investors and lenders often want to see how the business performs if growth is slower than expected or costs are higher than planned. It also helps management make better decisions by identifying which assumptions carry the greatest impact and which risks need to be managed before scaling.
Professional Charts
The professional charts component converts key financial results into visual outputs that are easier to understand, share, and present. A C2C marketplace model can include many moving parts, including commissions, subscription revenue, seller services, marketing budgets, payroll, payment processing costs, fixed overhead, capital investment, and cash burn. Charts help simplify that complexity by displaying trends in revenue growth, gross profit, EBITDA, net profit, cash flow, cash balance, expense categories, revenue mix, and performance over time. The inputs behind these visuals are driven by the model’s assumptions and financial statements, while the outputs create presentation-ready views for business plans, pitch decks, management updates, and stakeholder meetings. This component is useful because financial models are not only tools for calculation, but also tools for communication. Founders can use the charts to explain how the platform scales, where the largest costs occur, when profitability improves, and how funding supports the growth plan. Clear visuals can make the forecast more accessible to non-financial stakeholders while still supporting deeper analysis for investors, analysts, and advisors.
ROE Components and DuPont Analysis
The ROE components and DuPont analysis section helps users understand what is driving return on equity within the C2C Platform Financial Model. Instead of looking only at a single return figure, DuPont analysis breaks return on equity into underlying drivers such as profitability, asset efficiency, and leverage. For a consumer-to-consumer marketplace, this can be especially helpful because the model may rely heavily on platform development, marketing investment, and scalable digital infrastructure rather than traditional inventory-heavy operations. Inputs may include net income, revenue, total assets, equity, debt, retained earnings, and balance sheet assumptions. Outputs may show how margins, asset turnover, and financial structure contribute to overall return performance. This section is useful for investors and founders because it goes beyond basic profit projections and helps explain whether returns are being generated from real operating performance, efficient use of capital, or financial leverage. It can also support strategic decision-making by showing how changes in pricing, expense control, platform utilization, or funding structure may improve or weaken investor returns over the forecast period.
Revenue Inputs
The revenue inputs component is where users define the commercial assumptions that drive the C2C platform’s forecast. A marketplace business can generate income from several sources, including commissions on transactions, fixed order fees, seller subscription tiers, buyer subscription tiers, promoted listings, advertising tools, and other seller extras. This section allows users to enter assumptions such as take rate, fixed fee per order, average order value, number of active sellers, number of active buyers, transaction frequency, subscription pricing, subscription conversion rates, and adoption of paid seller tools. These inputs feed into the broader revenue forecast and help calculate monthly and annual sales potential over the planning period. The value of this section is that it forces users to think clearly about how the platform actually makes money and which levers matter most. For example, a small change in average order value, take rate, or paid subscription adoption can materially affect revenue and profitability as the user base grows. By organizing these assumptions in one editable area, the template makes it easier to test different monetization strategies and build a more defensible business plan.
Bank-Ready Reports
The bank-ready reports component provides structured financial outputs that can be used for lenders, investors, partners, advisors, and internal decision-makers. These reports typically include the core financial statements and summaries needed to evaluate the health of the business, such as profit and loss projections, cash flow forecasts, balance sheet outputs, funding requirements, and profitability measures. For a C2C platform, lender-friendly reporting is important because the business may require upfront capital for platform development, server infrastructure, brand development, marketing, payroll, and working capital before reaching profitability. Inputs from the assumptions, revenue forecast, cost structure, payroll plan, startup costs, and financing assumptions flow into these reports to create a consistent financial view. The outputs help users demonstrate whether the platform can generate enough revenue to cover expenses, service obligations, maintain liquidity, and progress toward sustainable profitability. This component is useful for anyone preparing a loan application, investor package, business plan appendix, or financial review because it presents the forecast in a professional format that stakeholders can evaluate quickly.
Revenue Breakdown
The revenue breakdown component gives users a more detailed view of how total revenue is generated across the platform’s different income streams. Rather than showing only a single revenue total, this section separates the contribution from transaction commissions, fixed order fees, seller subscriptions, buyer subscriptions, seller advertising, promotional services, and any additional marketplace monetization methods included in the model. Inputs may include pricing assumptions, user tier participation, order volume, subscription adoption, promotional tool usage, and growth rates by revenue stream. Outputs may show monthly revenue by category, annual revenue mix, percentage contribution by revenue stream, and changes in revenue composition over time. This is useful because a C2C marketplace may become more stable and profitable when it develops recurring and high-margin revenue streams in addition to transaction-based income. The revenue breakdown helps users identify which streams are driving growth, which assumptions need validation, and where commercial strategy may need adjustment. It can also support investor discussions by showing that the platform is not dependent on a single revenue source and has multiple ways to monetize its user base.
KPI Dashboard
The KPI dashboard component tracks the operational and financial performance indicators that matter most for a C2C platform. A marketplace business cannot be evaluated only through revenue and profit because user growth, engagement, acquisition cost, transaction activity, subscription conversion, and cash efficiency are often leading indicators of long-term viability. This section may include KPIs such as active sellers, active buyers, average order value, gross merchandise value, take rate, number of orders, revenue per user, seller CAC, buyer CAC, marketing spend, EBITDA margin, cash runway, gross margin, payback period, and return metrics. Inputs come from the user growth plan, marketing budget, revenue assumptions, operating expenses, and financial statements, while outputs provide a concise performance summary for management review and stakeholder reporting. The KPI dashboard is useful because it helps users compare actual or projected performance against targets and industry benchmarks. It also supports better decision-making by highlighting whether growth is efficient, whether monetization is improving, whether marketing spend is producing enough volume, and whether the company is moving toward a scalable marketplace model.
Startup Cost and Funding Requirements
The startup cost and funding requirements component helps users estimate the capital needed to launch and operate the C2C platform through its early growth phase. A consumer-to-consumer marketplace often requires upfront spending before revenue becomes meaningful, including platform development, server infrastructure, product design, brand identity, website setup, legal setup, licenses, office setup, early software tools, launch marketing, and working capital. This section allows users to organize those costs into clear categories and distinguish one-time capital expenditures from recurring operating expenses. It may also connect startup investment with financing assumptions, investor contributions, loan proceeds, cash reserves, and timing of funding inflows. Outputs may include total initial investment, pre-launch budget, funding gap, cash runway, and the amount of capital needed to avoid liquidity pressure before the business reaches break-even. This component is valuable for founders preparing a funding request because it helps justify how much money is needed and how it will be used. It also helps prevent underfunding, which is a common risk for marketplace startups that must spend on both technology and user acquisition before network effects begin to develop.
Break-Even and Cash Flow Planning
The break-even and cash flow planning component helps users understand when the C2C platform may become profitable and how much cash may be required before that point. Break-even analysis is particularly important for marketplace businesses because they often operate with negative EBITDA during the early years while investing in user acquisition, platform development, payroll, and brand building. Inputs may include revenue growth, contribution margin, payment processing fees, payroll, marketing spend, fixed overhead, capital expenditures, financing activity, and working capital assumptions. Outputs may include monthly cash balance, operating cash flow, net cash flow, peak funding need, break-even month, payback period, and the point at which recurring revenue and transaction volume can support the cost structure. This component is useful for decision-making because it helps users see whether their launch plan is financially realistic and whether they need more funding, slower hiring, reduced marketing spend, or stronger monetization assumptions. It also supports investor and lender conversations by showing the expected path from initial cash burn to sustainable profitability, making the forecast more practical and easier to evaluate.
File types:
Excel – Single-User: .xlsx
Excel – Multi-User: .xlsx
Similar ProductsOther customers were also interested in...

 HenrySheykin
Online Clothing Store Financial Model Excel Templa...
The Online Clothing Store Financial Model helps founders, entrepreneurs, business owners, consultant... Read more
Dropshipping Financial Model Excel Template
The Dropshipping Business Financial Model helps entrepreneurs, founders, consultants, analysts, and ... Read more
Private Labeling Financial Model Excel Template
The Private Labeling Financial Model Financial Model Template helps entrepreneurs, founders, busines... Read more
White Labeling Financial Model Excel Template
The White Labeling Financial Model helps entrepreneurs, founders, consultants, analysts, and busines... Read more
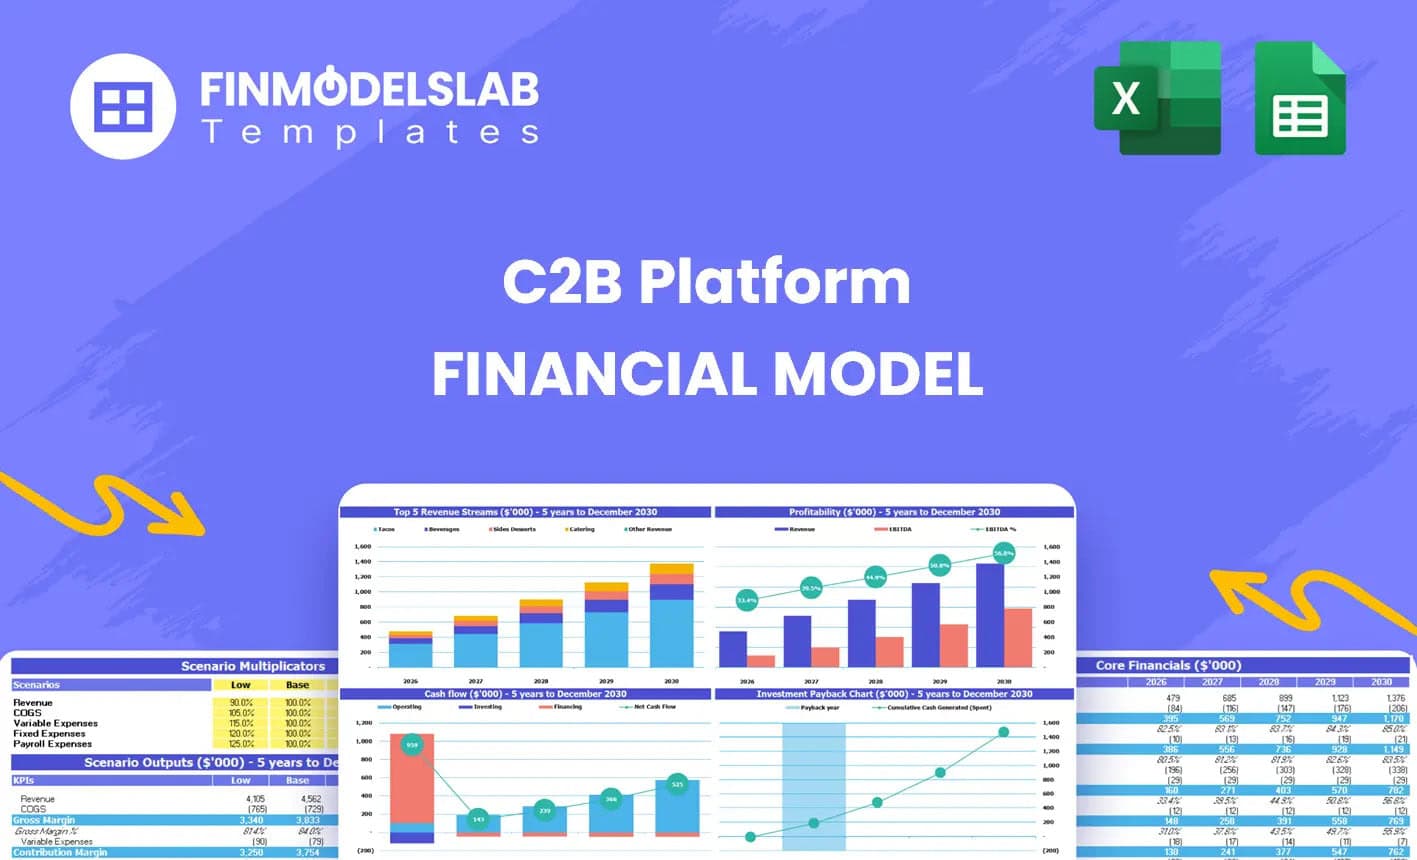
C2B Financial Model Excel Template
The C2B Platform Financial Model Financial Model Template helps users evaluate the financial potenti... Read more
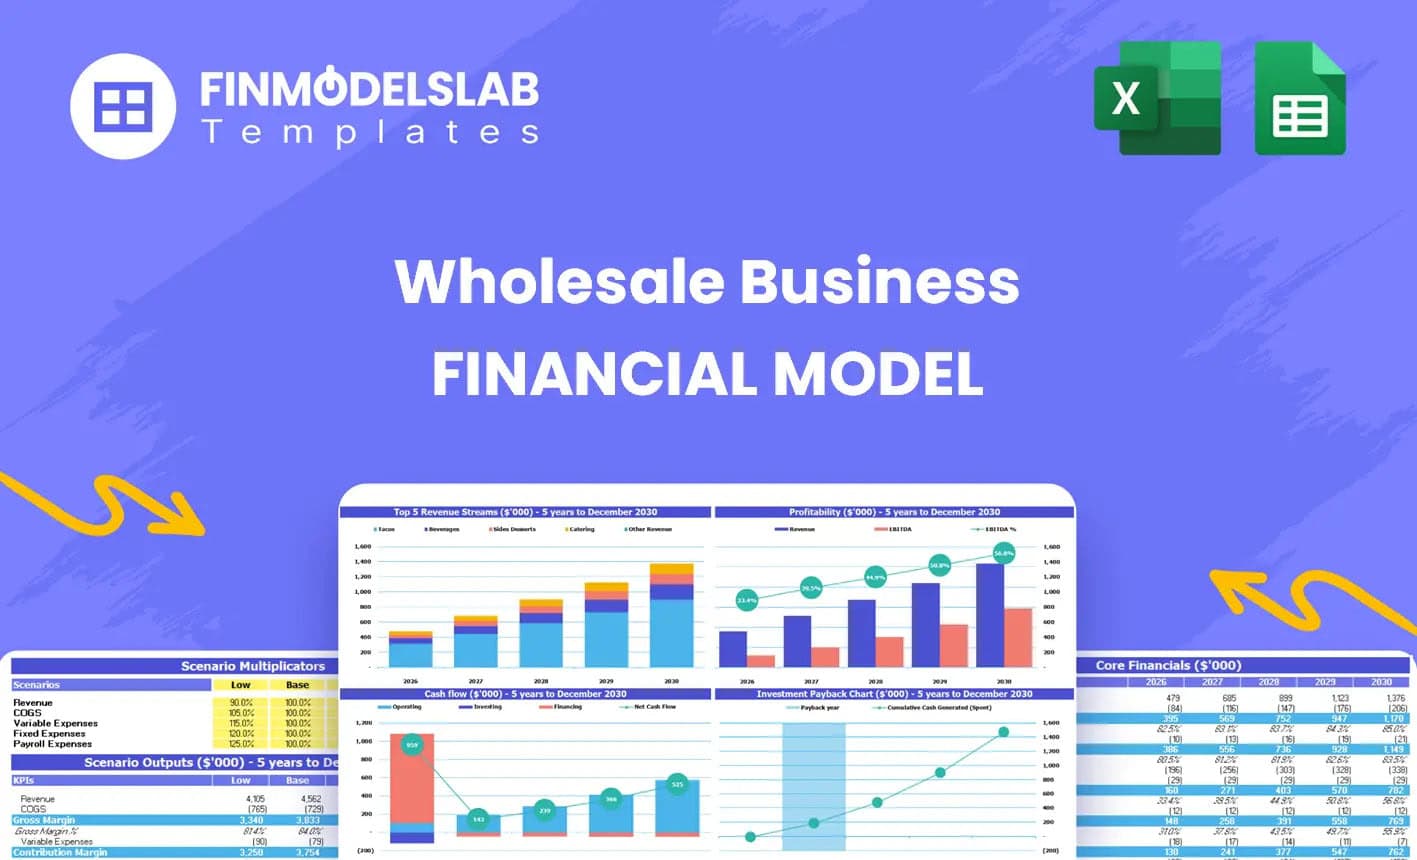
Wholesaling E-Commerce Financial Model Excel Templ...
The Wholesale Business Financial Model helps entrepreneurs, founders, business owners, consultants, ... Read more
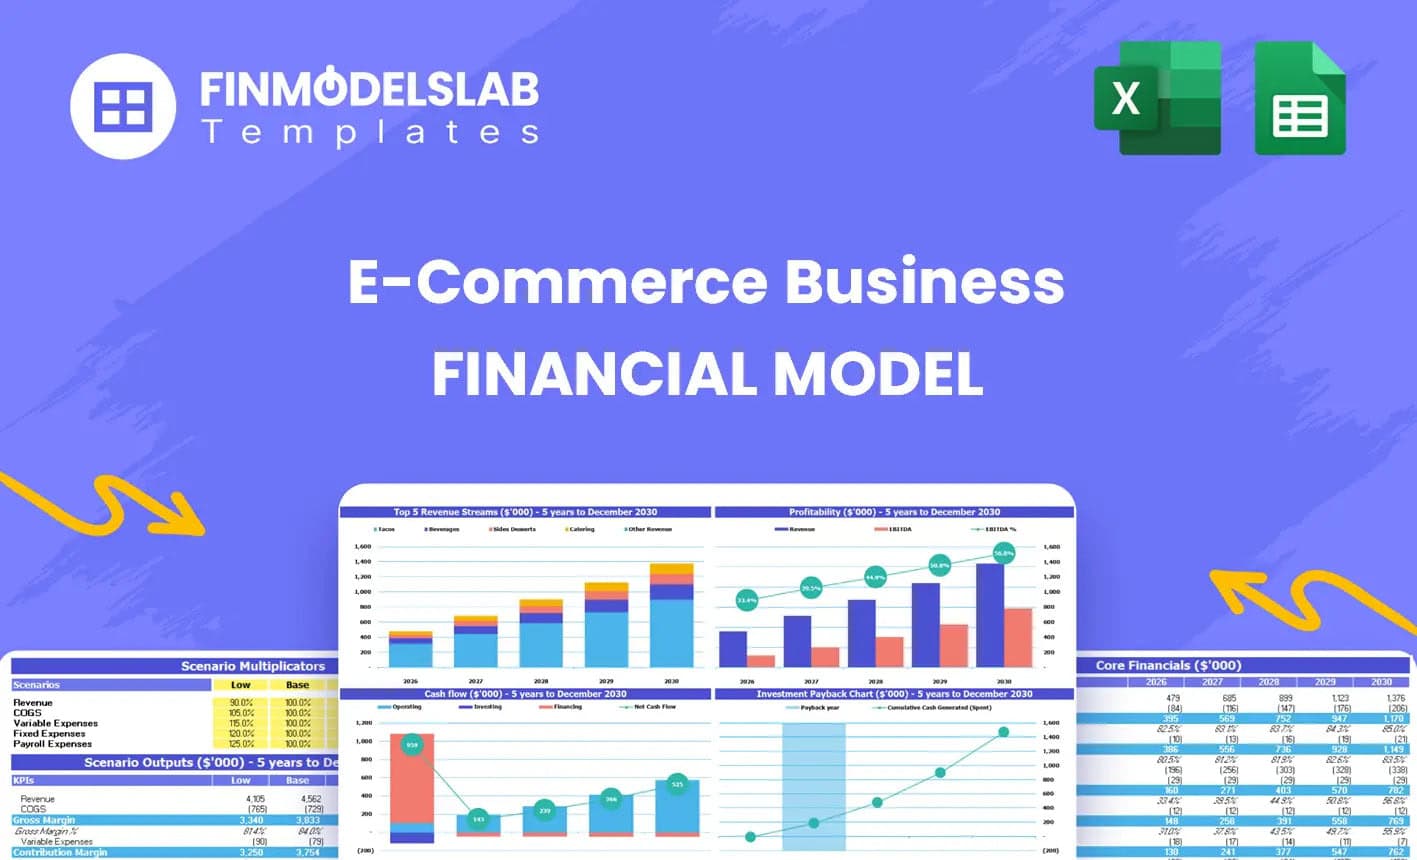
E-com Simple Financial Model Excel Template
The E-Commerce Business Financial Model Template helps founders, online store owners, consultants, a... Read more
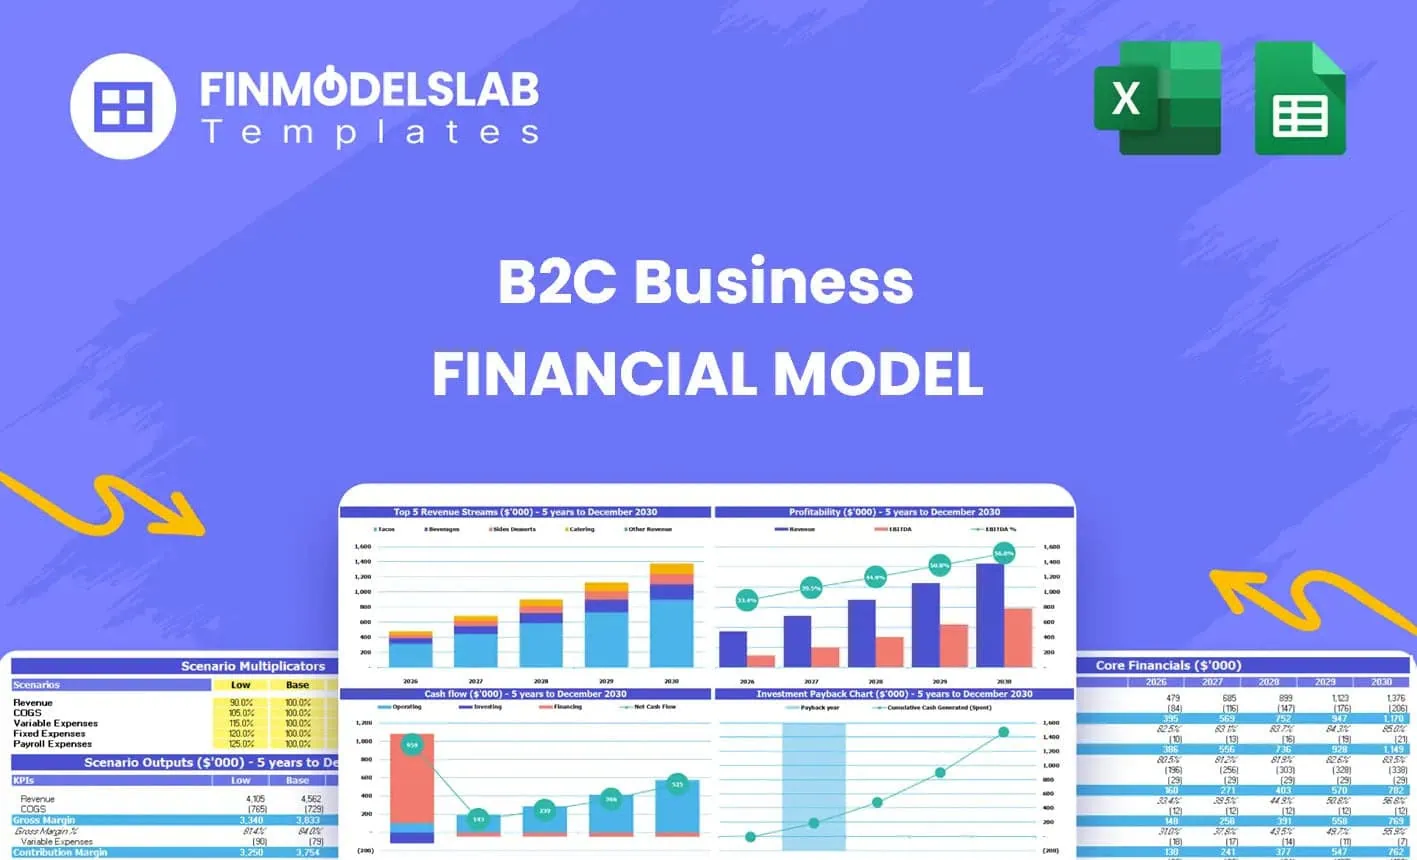
B2C Financial Model Excel Template
The B2C Business Financial Model Financial Model Template helps entrepreneurs, founders, business ow... Read more
B2B Financial Model Excel Template
The B2B Business Financial Model Financial Model Template helps entrepreneurs, founders, consultants... Read more
E-Commerce Software Financial Model Excel Template
The E-Commerce Platform Financial Model Financial Model Template helps founders, entrepreneurs, cons... Read more
You must log in to submit a review.