
0 ITEMS

C2B Financial Model Excel Template
The C2B Platform Financial Model Financial Model Template helps users evaluate the financial potential of a consumer-to-business platform before launch, expansion, fundraising, or strategic planning. It is designed for entrepreneurs, founders, business owners, consultants, analysts, and anyone preparing a business plan or funding document for a marketplace-style platform where consumers, sellers, buyers, commissions, subscriptions, and value-added services all need to be forecast together. Instead of starting from a blank spreadsheet, users can work from a structured model that organizes revenue assumptions, startup costs, operating expenses, payroll, cash flow, profitability, and key performance metrics in one editable file. This template is especially useful for planning a C2B platform because the business model depends on several connected drivers. Transaction volume, average order value, commission rates, fixed order fees, seller and buyer subscriptions, customer acquisition costs, repeat activity, and seller services can all influence the forecast. The model helps users translate those assumptions into five-year financial projections, showing how revenue may grow, how costs may scale, and when the business may move toward sustainable profitability. It also supports practical decision-making by helping users test whether pricing, marketing spend, staffing, and platform development plans are financially realistic. The C2B Platform Financial Model is built to support both internal planning and external presentation. Users can estimate the startup capital required to launch, review monthly cash flow needs, assess the impact of payroll and operating expenses, and understand how long it may take to reach break-even. The template can be used to prepare investor discussions, lender submissions, pitch deck financials, business plan projections, and management reviews. Its editable structure makes it suitable for early-stage founders validating a concept as well as established operators planning a new platform, new market, or expansion strategy. By combining assumptions, projections, reports, dashboards, and visual outputs, the template helps users make better financial decisions with less manual spreadsheet work. It gives a clearer view of cash requirements, revenue potential, cost structure, profitability, return metrics, and operational performance. Whether the goal is to raise capital, secure a loan, compare scenarios, refine a business model, or present a more professional financial plan, this ready-to-use financial model template provides a practical foundation for building a credible C2B platform forecast.
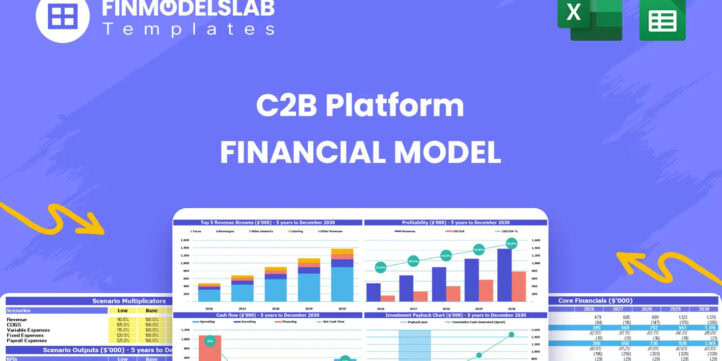


Financial Model Overview
The C2B Platform Financial Model Financial Model Template gives entrepreneurs, founders, consultants, analysts, and business planners a structured way to forecast the economics of a consumer-to-business platform. A C2B platform can include transaction commissions, buyer or seller subscriptions, value-added seller tools, promoted listings, payment processing fees, and other marketplace services, so the financial plan needs to connect multiple revenue streams with operating costs, payroll, startup investment, cash flow, and profitability. This template is designed to help users move beyond rough estimates and build a more organized five-year forecast that can support business planning, investor discussions, lender submissions, and internal decision-making. The model is editable, ready to use, and built around practical assumptions that can be adjusted to reflect a specific platform strategy, pricing structure, customer acquisition plan, and growth path.
All-in-One Dashboard
The all-in-one dashboard brings the core inputs and core outputs of the C2B Platform Financial Model into a single planning view. This section is useful because a platform business has many moving parts, including order volume, commission rates, average order value, subscription pricing, seller services, acquisition costs, operating expenses, payroll, capital spending, and cash reserves. The dashboard helps users review the most important financial assumptions without having to search through every supporting tab, while also displaying key outputs such as revenue, gross profit, EBITDA, net income, cash position, and funding needs. For a founder preparing a pitch, this makes it easier to explain the business model clearly. For a consultant or analyst, it creates a central control point for updating assumptions and reviewing how changes affect the forecast. The dashboard is also helpful for decision-making because it shows whether the C2B platform can support its growth plan, cover its expense base, and maintain enough liquidity as transaction volume scales. By combining input visibility with output summaries, this component helps turn a complex financial model into a practical planning tool.
Low Base High Scenario Analysis
The low, base, and high scenario analysis section allows users to test how the C2B platform may perform under different business conditions. Instead of relying on one fixed forecast, users can compare a conservative case, a realistic base case, and an upside case based on changes in assumptions such as customer growth, seller acquisition, buyer activity, average order value, commission rates, subscription uptake, marketing efficiency, churn, and operating cost discipline. This is especially important for platform businesses because early-stage results can vary significantly depending on marketplace liquidity, trust, user adoption, and acquisition costs. The section helps generate alternative revenue, expense, cash flow, and profitability outcomes, making it easier to understand risk and opportunity before committing capital. Investors and lenders often want to know how the business performs if growth is slower than planned or costs are higher than expected, and this component provides a structured way to answer those questions. It also helps management make better decisions by showing which assumptions have the biggest impact on cash runway, break-even timing, and long-term profitability.
Professional Charts
The professional charts section converts the financial model’s projections into visual outputs that are easier to understand, present, and discuss with stakeholders. A C2B platform forecast can include detailed monthly and annual data, but decision-makers often need a quick visual summary of revenue growth, expense trends, gross margin, EBITDA, cash balance, user activity, return metrics, and other performance indicators. This component helps transform the model from a working spreadsheet into a presentation-ready financial planning document. The charts may use forecast outputs from revenue schedules, expense calculations, cash flow projections, and profitability statements to show trends over time and highlight major turning points, such as when operating losses begin to narrow or when the platform reaches positive cash flow. For investor meetings, these visuals help communicate the financial story more clearly than raw rows of data. For internal management, they make it easier to spot trends, compare actual performance against the plan, and identify areas that need attention. This section is particularly useful for pitch decks, board updates, business plans, and strategic reviews where clear financial communication matters.
ROE Components and DuPont Analysis
The ROE components and DuPont analysis section helps users understand the drivers behind return on equity rather than only viewing a final return percentage. Return on equity can be influenced by profit margin, asset efficiency, and financial leverage, and this component breaks those elements into a more useful analytical view. For a C2B platform, this is valuable because profitability is affected by take rate, subscription revenue, technology costs, payroll, marketing spend, operating efficiency, and the capital required to scale the business. The section may use inputs and outputs from the income statement, balance sheet, and operating assumptions to calculate return metrics and show how changes in margins, revenue productivity, and funding structure influence shareholder returns. This helps founders and analysts evaluate whether the platform is generating attractive returns from the capital invested. It can also support investor conversations by showing not only what the return profile may be, but why those returns are expected. By connecting performance to financial structure, this component helps users make more informed decisions about pricing, cost management, reinvestment, debt, equity funding, and long-term growth strategy.
Revenue Inputs
The revenue inputs section is where users define the main assumptions that drive sales performance for the C2B platform. Because this type of business often earns revenue from multiple sources, the model allows users to structure assumptions around transaction commissions, fixed order fees, seller subscriptions, buyer subscriptions, promoted listings, payment processing, advertising, and other seller services. Inputs may include average order value, order volume, commission percentage, fixed fee per transaction, number of sellers, number of buyers, subscription price, conversion rates, repeat purchase behavior, and adoption rates for add-on services. This section is useful because it connects the commercial logic of the platform directly to the financial forecast. Users can test whether a higher commission rate improves profit or reduces adoption, whether subscriptions create more predictable recurring revenue, or whether value-added services can improve margins over time. A well-organized revenue input section also helps make assumptions transparent for investors, lenders, or business partners. Instead of presenting revenue as a single unexplained number, the model shows the operating drivers behind the forecast, making the plan easier to review, defend, and refine.
Bank-Ready Reports
The bank-ready reports section organizes the C2B Platform Financial Model into clear financial outputs that can be shared with lenders, funding partners, and other professional stakeholders. Banks and lenders typically want to see structured projections, not just a high-level revenue estimate, so this component supports reporting around profit and loss, cash flow, balance sheet movement, debt service capacity, funding requirements, and repayment ability. The section may draw from operating assumptions, revenue schedules, payroll, startup costs, capital expenditures, and financing inputs to produce lender-friendly summaries that explain how the platform is expected to generate revenue and manage expenses over time. For a C2B platform, this is important because early cash burn, technology development costs, customer acquisition expenses, and working capital needs must be shown clearly. The reports can help users demonstrate whether the business can maintain sufficient liquidity, reach break-even, and support any planned financing. This component is also helpful for business plan submissions because it gives users a cleaner and more professional way to present financial forecasts than a raw spreadsheet. It supports credibility, organization, and practical funding discussions.
Revenue Breakdown
The revenue breakdown section provides a detailed view of how each revenue stream contributes to the total financial forecast. A C2B platform may rely on a combination of transaction commissions, fixed order fees, seller subscriptions, buyer subscriptions, advertising products, promoted listings, payment processing fees, enterprise services, or premium marketplace tools, and each stream can scale differently. This component helps users separate those streams so they can see which sources are expected to drive early revenue, which may become more important over time, and which carry the strongest margin potential. Inputs may include pricing, customer counts, transaction activity, adoption rates, service mix, retention, and average revenue per user or seller. Outputs can include monthly and annual revenue by category, percentage contribution by stream, growth trends, and total revenue forecasts. This is valuable for planning because it prevents the business from depending on a single vague sales line. It also helps users evaluate diversification, identify high-margin opportunities, and decide where to focus product development or sales efforts. For investor and management discussions, the revenue breakdown makes the platform’s monetization strategy easier to understand and more defensible.
KPI Dashboard
The KPI dashboard section tracks the performance metrics that matter most for a C2B platform and connects operational activity to financial outcomes. Useful KPIs may include gross merchandise value, order volume, take rate, average order value, active sellers, active buyers, subscription conversion, repeat purchase rate, customer acquisition cost, lifetime value, churn, gross margin, EBITDA margin, cash burn, runway, and payback period. This component is valuable because platform businesses are usually judged not only on revenue, but also on marketplace health, efficiency, growth quality, and unit economics. The dashboard helps users monitor whether the assumptions in the model are realistic and whether the business is improving over time. It may also include benchmark-style comparisons so users can evaluate customer acquisition costs, commission rates, staffing levels, and operating spending against reasonable expectations for a platform model. For founders, this helps identify what to track after launch. For consultants and analysts, it provides a concise performance view for clients or stakeholders. For investors, it helps show whether growth is supported by strong underlying economics rather than only increasing marketing spend or transaction volume.
Startup Costs and Capital Requirements
The startup costs and capital requirements section helps users estimate how much funding is needed before the C2B platform can launch and operate through its early growth period. This component may include initial platform development, product design, hosting infrastructure, security setup, legal formation, compliance, office setup, branding, launch marketing, software tools, consulting fees, hiring costs, and initial working capital. It also helps separate one-time startup investments from recurring operating expenses, which is important for understanding true launch funding needs and ongoing burn rate. For a C2B platform, technology development is often one of the largest early costs, while marketing and staffing become major drivers as the marketplace grows. The section can generate a clear startup cost summary, capital outlay estimate, pre-opening budget, and funding requirement that users can include in business plans or investor materials. It is useful for decision-making because it shows whether the planned launch scope is affordable, whether additional funding may be required, and which costs can be delayed, reduced, or scaled in phases. A structured startup cost section helps users avoid underestimating the investment required to build, launch, and support a functioning platform.
Break-Even and Cash Flow Forecast
The break-even and cash flow forecast section helps users understand when the C2B platform may become profitable and whether it can maintain enough cash before reaching that point. Break-even analysis may consider revenue growth, gross margin, commission income, subscription revenue, seller services, payroll, marketing expenses, fixed overhead, platform costs, and other operating expenses to estimate the point at which the business covers its cost base. The cash flow forecast then shows the timing of money coming in and going out, including startup investment, monthly operating burn, working capital needs, financing inflows, capital expenditures, and ending cash balances. This component is critical because a platform can show strong long-term potential while still facing early liquidity pressure. Users can review monthly cash movement, identify periods of tight cash, estimate runway, and plan funding rounds or cost controls before a cash shortfall occurs. For investors and lenders, this section provides evidence that the user understands the financial path from launch to sustainability. For management, it supports practical decisions around hiring pace, marketing spend, technology investment, pricing changes, and timing of expansion. By linking break-even timing with cash availability, the model helps users plan for both profitability and survival.
File types:
Excel – Single-User: .xlsx
Excel – Multi-User: .xlsx
Similar ProductsOther customers were also interested in...

 HenrySheykin
Online Clothing Store Financial Model Excel Templa...
The Online Clothing Store Financial Model helps founders, entrepreneurs, business owners, consultant... Read more
Private Labeling Financial Model Excel Template
The Private Labeling Financial Model Financial Model Template helps entrepreneurs, founders, busines... Read more
Dropshipping Financial Model Excel Template
The Dropshipping Business Financial Model helps entrepreneurs, founders, consultants, analysts, and ... Read more
White Labeling Financial Model Excel Template
The White Labeling Financial Model helps entrepreneurs, founders, consultants, analysts, and busines... Read more
Wholesaling E-Commerce Financial Model Excel Templ...
The Wholesale Business Financial Model helps entrepreneurs, founders, business owners, consultants, ... Read more
C2C Financial Model Excel Template
The C2C Platform Financial Model helps founders, entrepreneurs, consultants, analysts, and business ... Read more
E-com Simple Financial Model Excel Template
The E-Commerce Business Financial Model Template helps founders, online store owners, consultants, a... Read more
B2C Financial Model Excel Template
The B2C Business Financial Model Financial Model Template helps entrepreneurs, founders, business ow... Read more
E-Commerce Software Financial Model Excel Template
The E-Commerce Platform Financial Model Financial Model Template helps founders, entrepreneurs, cons... Read more
Surprise Subscription Box Financial Model Excel Te...
The Subscription Box Financial Model Template helps entrepreneurs, founders, analysts, consultants, ... Read more
You must log in to submit a review.