
0 ITEMS

Apartments Development REFM Financial Model Excel Template
The Apartment Development Financial Model Template helps real estate developers, entrepreneurs, business owners, consultants, analysts, and investment teams evaluate a develop-and-sell apartment project before committing major capital. It is built to organize the key assumptions lenders and investors typically review first, including project costs, acquisition timing, construction budgets, sale proceeds, operating expenses, payroll, cash flow, profitability, and return expectations. Instead of starting from a blank spreadsheet, users can work from a structured financial planning tool designed specifically for apartment development feasibility, budgeting, funding preparation, and strategic decision-making. This template is especially useful for users preparing a business plan, investor presentation, loan package, development feasibility study, or internal project review. It allows you to model multiple apartment development projects, estimate revenue assumptions from planned property exits, schedule project timelines, track startup costs, and understand how upfront investment affects liquidity before sales revenue is realized. The model supports a realistic view of development cash flow, where significant spending may occur long before profitability is achieved, making it easier to identify funding gaps, test assumptions, and communicate the project’s financial path. The Apartment Development Financial Model Template includes an editable framework for reviewing revenue inputs, operating expenses, payroll, capital expenditures, financing needs, cash flow movement, investor returns, and break-even analysis. Users can adjust assumptions for land acquisition, construction costs, sale values, development schedules, and operating structure to reflect their own market, deal pipeline, and growth strategy. Built-in outputs help translate those assumptions into financial statements, performance metrics, charts, and decision-ready summaries. Designed for both planning and presentation, the model helps buyers understand whether an apartment development strategy can support its cost structure, reach break-even, generate acceptable returns, and withstand changes in market conditions. It is suitable for early-stage developers building their first forecast, established real estate teams comparing project scenarios, consultants preparing client deliverables, and analysts reviewing investment feasibility. With editable inputs, lender-friendly outputs, and professional formatting, it provides a practical foundation for apartment development financial planning and capital conversations.
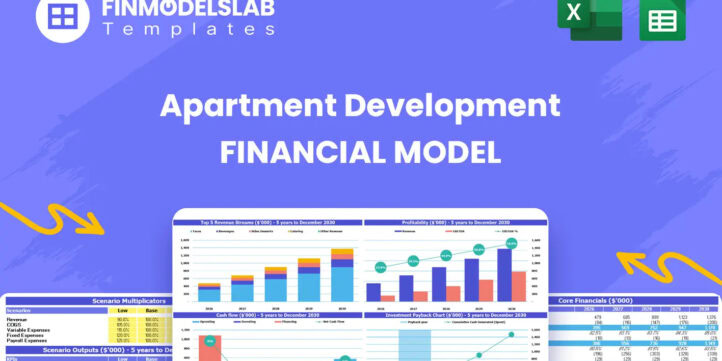


Financial Model Overview
The Apartment Development Financial Model Template gives developers, founders, consultants, analysts, and investment teams a structured way to evaluate the financial feasibility of an apartment development business or project pipeline. It is designed for a develop-and-sell strategy where revenue is generated from the sale of completed apartment buildings rather than ongoing rental operations. The model brings together acquisition costs, construction budgets, startup expenses, payroll, operating costs, sale timing, financing needs, cash flow, profitability, and investor return metrics in one editable workbook. This makes it useful for business planning, funding preparation, lender discussions, investor presentations, and internal decision-making. Instead of building a complex real estate development forecast from scratch, users can update the assumptions to reflect their own projects, markets, timelines, sale values, and capital structure. The result is a practical financial planning tool that helps show how much capital is required, when cash flow pressure is likely to peak, when profitability may occur, and whether the projected return profile supports the risk of the apartment development strategy.
All-in-One Dashboard
The all-in-one dashboard provides a centralized view of the most important inputs and outputs in the Apartment Development Financial Model Template. It helps users review the model quickly by bringing together core assumptions such as project timing, acquisition costs, construction budgets, sale values, operating expenses, financing assumptions, and high-level return targets. The dashboard can also summarize outputs such as revenue, EBITDA, cash flow, funding needs, profitability, payback timing, and overall project performance. For apartment development planning, this is useful because many decisions depend on multiple moving parts happening over several years. A centralized dashboard allows a developer or analyst to see whether the forecast is internally consistent before going deeper into the detail tabs. It also helps stakeholders understand the overall deal profile without having to interpret every worksheet individually. When preparing for lender meetings, investor discussions, or internal approvals, the dashboard can act as the starting point for explaining the project pipeline, the capital required, the expected exit timing, and the projected financial outcome.
Low, Base, and High Scenario Analysis
The low, base, and high scenario analysis component allows users to test how different market conditions and execution outcomes affect the apartment development forecast. A base case may reflect the user’s expected assumptions for sale prices, construction costs, development timelines, financing terms, overhead, and project exits. A low case can be used to model downside conditions such as lower sale proceeds, cost overruns, delayed approvals, slower absorption, higher interest rates, or postponed exits. A high case can reflect stronger market demand, faster construction, improved sale values, or more favorable financing terms. This component is valuable because apartment development projects often involve long lead times and large upfront capital commitments, making assumptions highly sensitive to market shifts. Scenario analysis helps users compare projected cash flow, profitability, break-even timing, IRR, ROE, and funding requirements under different outcomes. It supports more disciplined decision-making by showing whether the project still works if assumptions move against the plan and how much upside may be available if execution and market conditions improve.
Professional Charts
The professional charts component turns the financial forecast into visual outputs that are easier to understand, review, and present. Apartment development models can be complex because costs, debt draws, equity contributions, construction spending, sale events, and cash flow movements may occur at different times across multiple projects. Charts help simplify this information by displaying trends in revenue, cash balance, EBITDA, cumulative cash flow, development costs, returns, and other key financial metrics. These visuals are useful for investor decks, bank packages, internal strategy meetings, and management reviews because they make the story behind the numbers easier to communicate. Rather than forcing stakeholders to study detailed spreadsheet rows, the model can show when cash burn accelerates, when project sales begin to improve liquidity, when profitability turns positive, and how returns develop over time. Professional charts also help identify potential issues quickly, such as a major funding gap before the first exit or an extended period of negative cash flow. For planning and presentation, this component strengthens the credibility and usability of the financial model.
ROE Components and DuPont Analysis
The ROE components and DuPont analysis section helps users understand what is driving the projected return on equity in the apartment development forecast. Instead of showing only a single ROE figure, this component breaks performance into underlying drivers that may include profitability, asset efficiency, leverage, margins, financing structure, and the relationship between equity investment and net returns. For apartment development, this is especially useful because a project can appear attractive at the revenue level while still producing weak equity returns if construction costs are too high, leverage is poorly structured, sale timing is delayed, or overhead consumes too much of the gain. DuPont-style analysis helps users isolate where performance is being created or diluted. It can support decisions about whether to renegotiate acquisition pricing, revise construction budgets, adjust the debt and equity mix, delay or accelerate a sale, or refine the project pipeline. Investors and lenders often want to understand not just what the return is, but why it occurs. This section helps make the return profile more transparent and easier to defend.
Revenue Inputs
The revenue inputs component allows users to define the assumptions that drive apartment development sales revenue. Because this model is built around a develop-and-sell strategy, revenue is primarily connected to the planned sale of completed apartment buildings, the timing of each exit, the expected sale value, and the structure of each project in the pipeline. Users may input or edit assumptions related to land or existing property acquisition costs, development budgets, completion dates, sale months, market values, unit or building absorption expectations, and project-specific exit proceeds. This section is important because small changes in final sale price or sale timing can have a major effect on cash flow, profitability, IRR, payback, and funding needs. By organizing revenue assumptions clearly, the model helps users build a more credible real estate development proforma and avoid mixing operating activity with one-time project exits. Revenue inputs also support better planning discussions because developers can compare projects, prioritize higher-return opportunities, and test how the forecast changes when sale prices, development timelines, or project phasing are adjusted.
Bank-Ready Reports
The bank-ready reports component presents the financial outputs in a format that is suitable for lender review, funding conversations, and stakeholder analysis. Lenders typically want to understand total project costs, construction spending, funding gaps, debt requirements, equity contributions, expected sale proceeds, cash flow timing, and repayment capacity. This section helps organize the model’s outputs into clear financial statements, summaries, and lender-friendly views that can support financing discussions. It may include projected profit and loss, cash flow, balance sheet, funding needs, loan draw assumptions, debt service considerations, and key investment metrics. For apartment development, bank-ready reporting is important because the business may show large negative cash flow during acquisition and construction before any sale proceeds are received. A structured report helps explain why the cash burn occurs, when liquidity is expected to improve, and how the development plan supports repayment or refinancing. This component saves time when preparing loan packages and helps users present the project in a polished, consistent, and financially organized way.
Revenue Breakdown
The revenue breakdown component provides a detailed view of the model’s revenue streams and project-level sales assumptions. While the overall revenue forecast may show total proceeds across the forecast period, the revenue breakdown helps users understand which developments, sale events, or property exits are contributing to those totals. In an apartment development model, this may include separate lines for each project, planned completion and sale dates, expected sale proceeds, project size, absorption assumptions, and timing of cash receipts. This level of detail is useful because revenue in a development business is often lumpy rather than evenly distributed month to month. One major sale can shift EBITDA, cash flow, break-even timing, and investor returns significantly. By showing revenue at a more granular level, the model helps users identify concentration risk, compare project contributions, and evaluate whether the pipeline is balanced. It can also support better communication with partners and investors by clarifying exactly where projected sales are coming from and how each project contributes to the overall financial plan.
KPI Dashboard
The KPI dashboard component tracks the key performance indicators that matter most for apartment development feasibility and investment review. These metrics may include IRR, ROE, equity multiple, payback period, EBITDA, net profit, gross margin, cash balance, cumulative cash flow, break-even timing, project cost ratios, and other benchmarks relevant to real estate development. The KPI dashboard is useful because it condenses a large amount of financial detail into decision-ready metrics. Developers can use it to compare the forecast against internal targets, investor expectations, lender requirements, or industry benchmarks. Analysts can use it to identify whether a project is underperforming due to weak sale values, excessive construction costs, delayed exits, high overhead, or insufficient leverage discipline. For business planning and funding documents, KPI reporting helps make the financial model more persuasive and easier to review. It also supports ongoing updates because users can change assumptions and immediately observe how the main performance indicators respond, improving the quality of financial decision-making.
Startup and Development Cost Planning
The startup and development cost planning component helps users estimate the capital required before and during the apartment development process. This section can separate corporate setup costs from project-specific costs, giving a clearer view of what must be funded to launch operations and what must be funded to acquire, build, and prepare each property for sale. Inputs may include land acquisition, existing property purchases, construction budgets, design and engineering, permits, legal fees, due diligence, technology systems, office setup, vehicles, insurance, marketing, professional services, payroll, and contingency reserves. Outputs may show total startup capital, development cost by project, monthly spending, cumulative investment, and the timing of major cash outflows. This is particularly important in apartment development because the largest cash requirements often occur before revenue is realized. A detailed cost plan helps users avoid underestimating the funding needed to reach completion and sale. It also supports lender and investor discussions by showing that the budget has been organized, categorized, and linked to the overall forecast.
Cash Flow, Funding Requirements, and Break-Even Analysis
The cash flow, funding requirements, and break-even analysis component helps users understand how money moves through the apartment development plan and when the business may become financially self-sustaining. Inputs may include acquisition spending, construction draw schedules, overhead, payroll, financing costs, equity injections, debt proceeds, project sale timing, and expected sale receipts. Outputs may include monthly and annual cash flow, minimum cash balance, cumulative cash burn, required funding, liquidity gaps, break-even month, payback period, and the timing of positive cash generation. This is one of the most important parts of an apartment development financial model because development projects can show significant negative cash flow for months or years before completed properties are sold. By identifying the lowest cash point and the break-even timeline, users can plan adequate debt and equity funding, build contingency reserves, and avoid liquidity shortfalls. This component is also valuable for decision-making because it shows whether project phasing, financing terms, sale timing, or cost reductions are needed to create a more resilient development plan.
File types:
Excel – Single-User: .xlsx
Excel – Multi-User: .xlsx
Similar ProductsOther customers were also interested in...

 HenrySheykin
Multi Family Development REIT Financial Model Exce...
The Multi-Family Development Financial Model helps developers, real estate entrepreneurs, consultant... Read more
Townhomes Development Real Estate Financial Model ...
The Townhome Development Financial Model Template helps developers, founders, consultants, analysts,... Read more
Condominium Development REFM Financial Model Excel...
The Condo Development Financial Model helps developers, investors, analysts, consultants, and busine... Read more
Residential Development REIT Financial Model Excel...
The Residential Development Financial Model helps users evaluate the financial feasibility of a resi... Read more
Single Family Development REFM Financial Model Exc...
The Residential Development Financial Model helps users evaluate the financial feasibility of a resi... Read more
Condo Hotel Financial Model Excel Template
The Condo Hotel Financial Model helps users turn a condo hotel concept, launch plan, or investment o... Read more
 Eastwich Advisors
Multifamily Rehab Model (Includes Investor Returns...
Introducing the Multifamily Rehab Flip Model with Investor Returns Waterfall - a comprehensive tool ... Read more
 JILL LIU
Real Estate Acquisition-Rent-Sell Comprehensive An...
An integrated, dynamic and ready-to-use Real Estate Acquisition-Rent-Sell Comprehensive Analysis Mod... Read more
Reviews
 Awesome
Very nice model which is useful for the exercise at hand
Thank you for your feedback.
615 of 1231 people found this review helpful.
You must log in to submit a review.